PLEXUS (PLXS)·Q1 2026 Earnings Summary
Plexus Hits High End of EPS as Record A&D Wins Signal FY26 Breakout
January 28, 2026 · by Fintool AI Agent
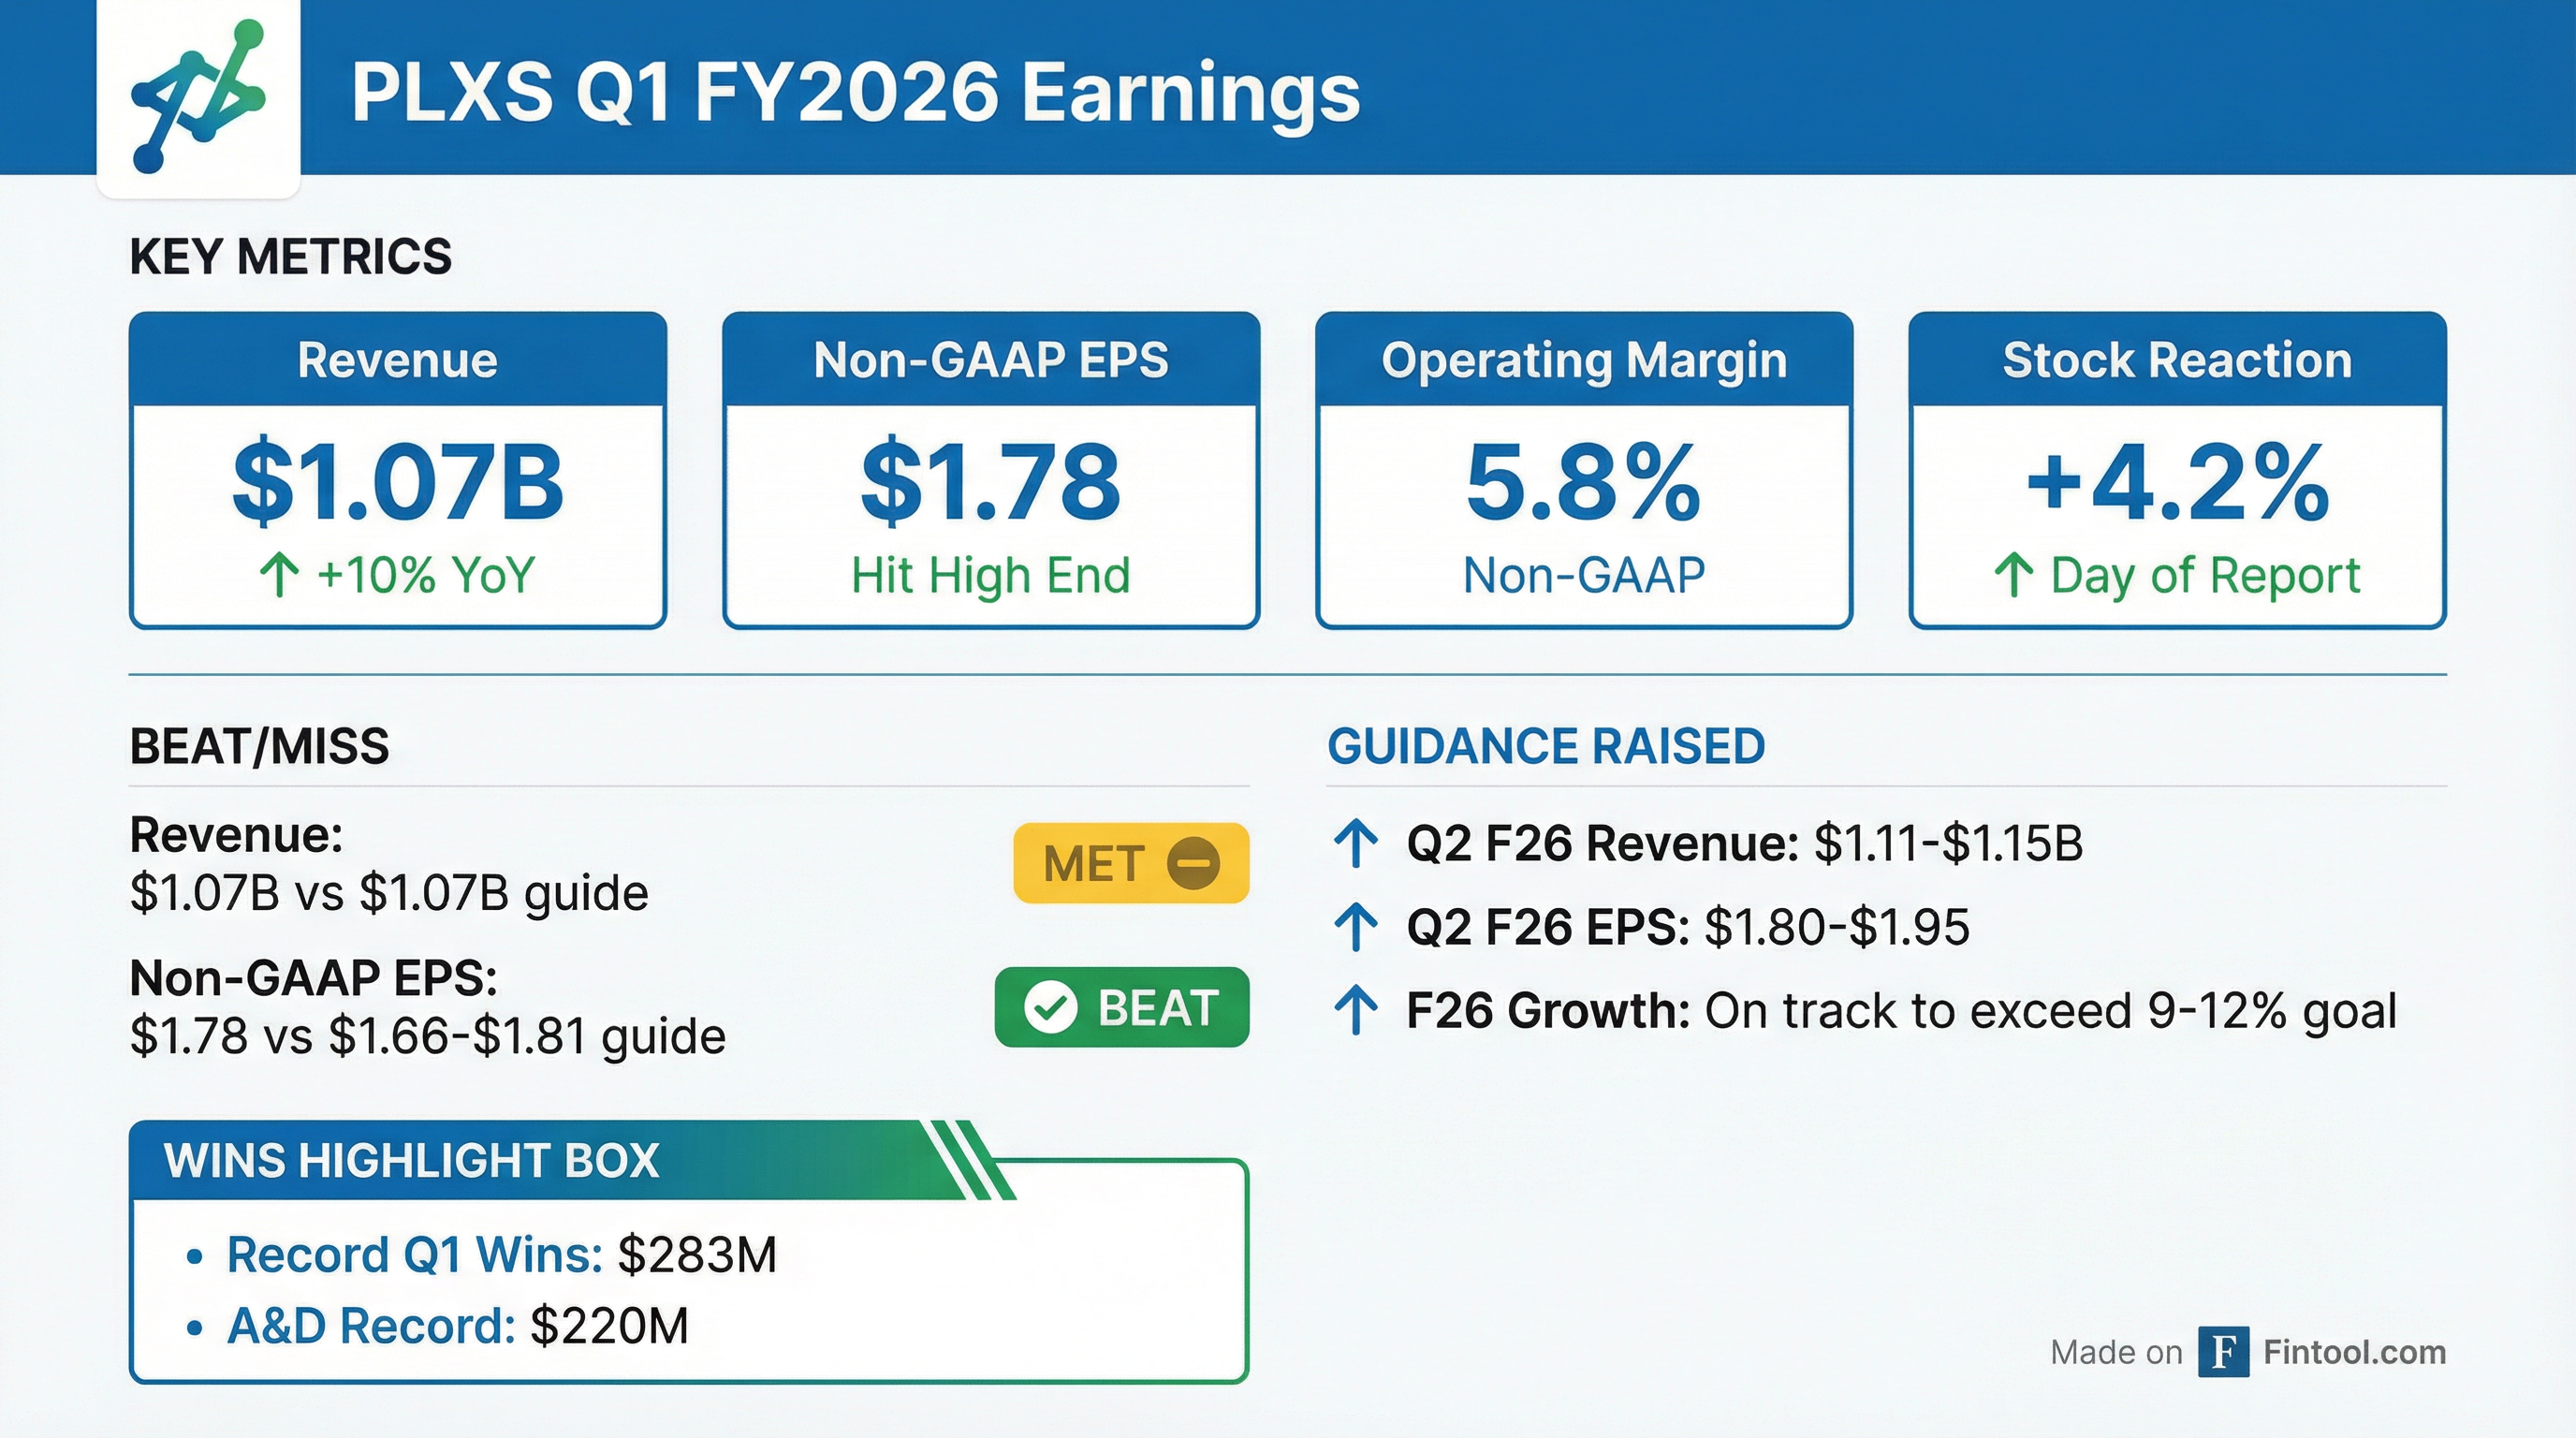
Plexus Corp. (NASDAQ: PLXS) delivered Q1 FY2026 results that checked all the boxes: Non-GAAP EPS of $1.78 met the high end of guidance, revenue grew 10% year-over-year to $1.07 billion, and the company posted record quarterly wins of $283 million—including a stunning $220 million in Aerospace/Defense alone.
The stock responded with a 4.2% gain to $180.85, approaching its 52-week high of $186.47. More importantly, management raised the bar for FY26, signaling potential to exceed the high end of its 9-12% revenue growth target.
Did Plexus Beat Earnings?
Plexus delivered a clean quarter that met or exceeded expectations across key metrics:
This marks the fourth consecutive quarter of sequential revenue growth and the seventh consecutive quarter of beating or meeting EPS expectations.
What Did Management Guide?
Q2 FY26 guidance shows continued momentum with sequential acceleration:
Full-year FY26 outlook is where it gets interesting:
- Revenue growth: Potential to "meet or exceed high end of 9-12% goal"
- Operating profit: "Significant F26 operating profit expansion" expected
- Free cash flow: Approximately $100 million forecast despite growth investments
Management explicitly noted that "program wins, share gains, and improving market demand position Plexus in F26 to meet or exceed high end of 9-12% revenue growth goal."
What Changed From Last Quarter?
The Win Acceleration
The headline number: $283 million in Q1 FY26 wins, representing the highest Q1 win total in company history.
But the real story is Aerospace/Defense, which posted $220 million in record quarterly wins—nearly 4x the prior year's Q1 wins of $29 million.
The wins funnel remains robust at $3.587 billion, with record Aerospace/Defense total funnel.
Segment Divergence
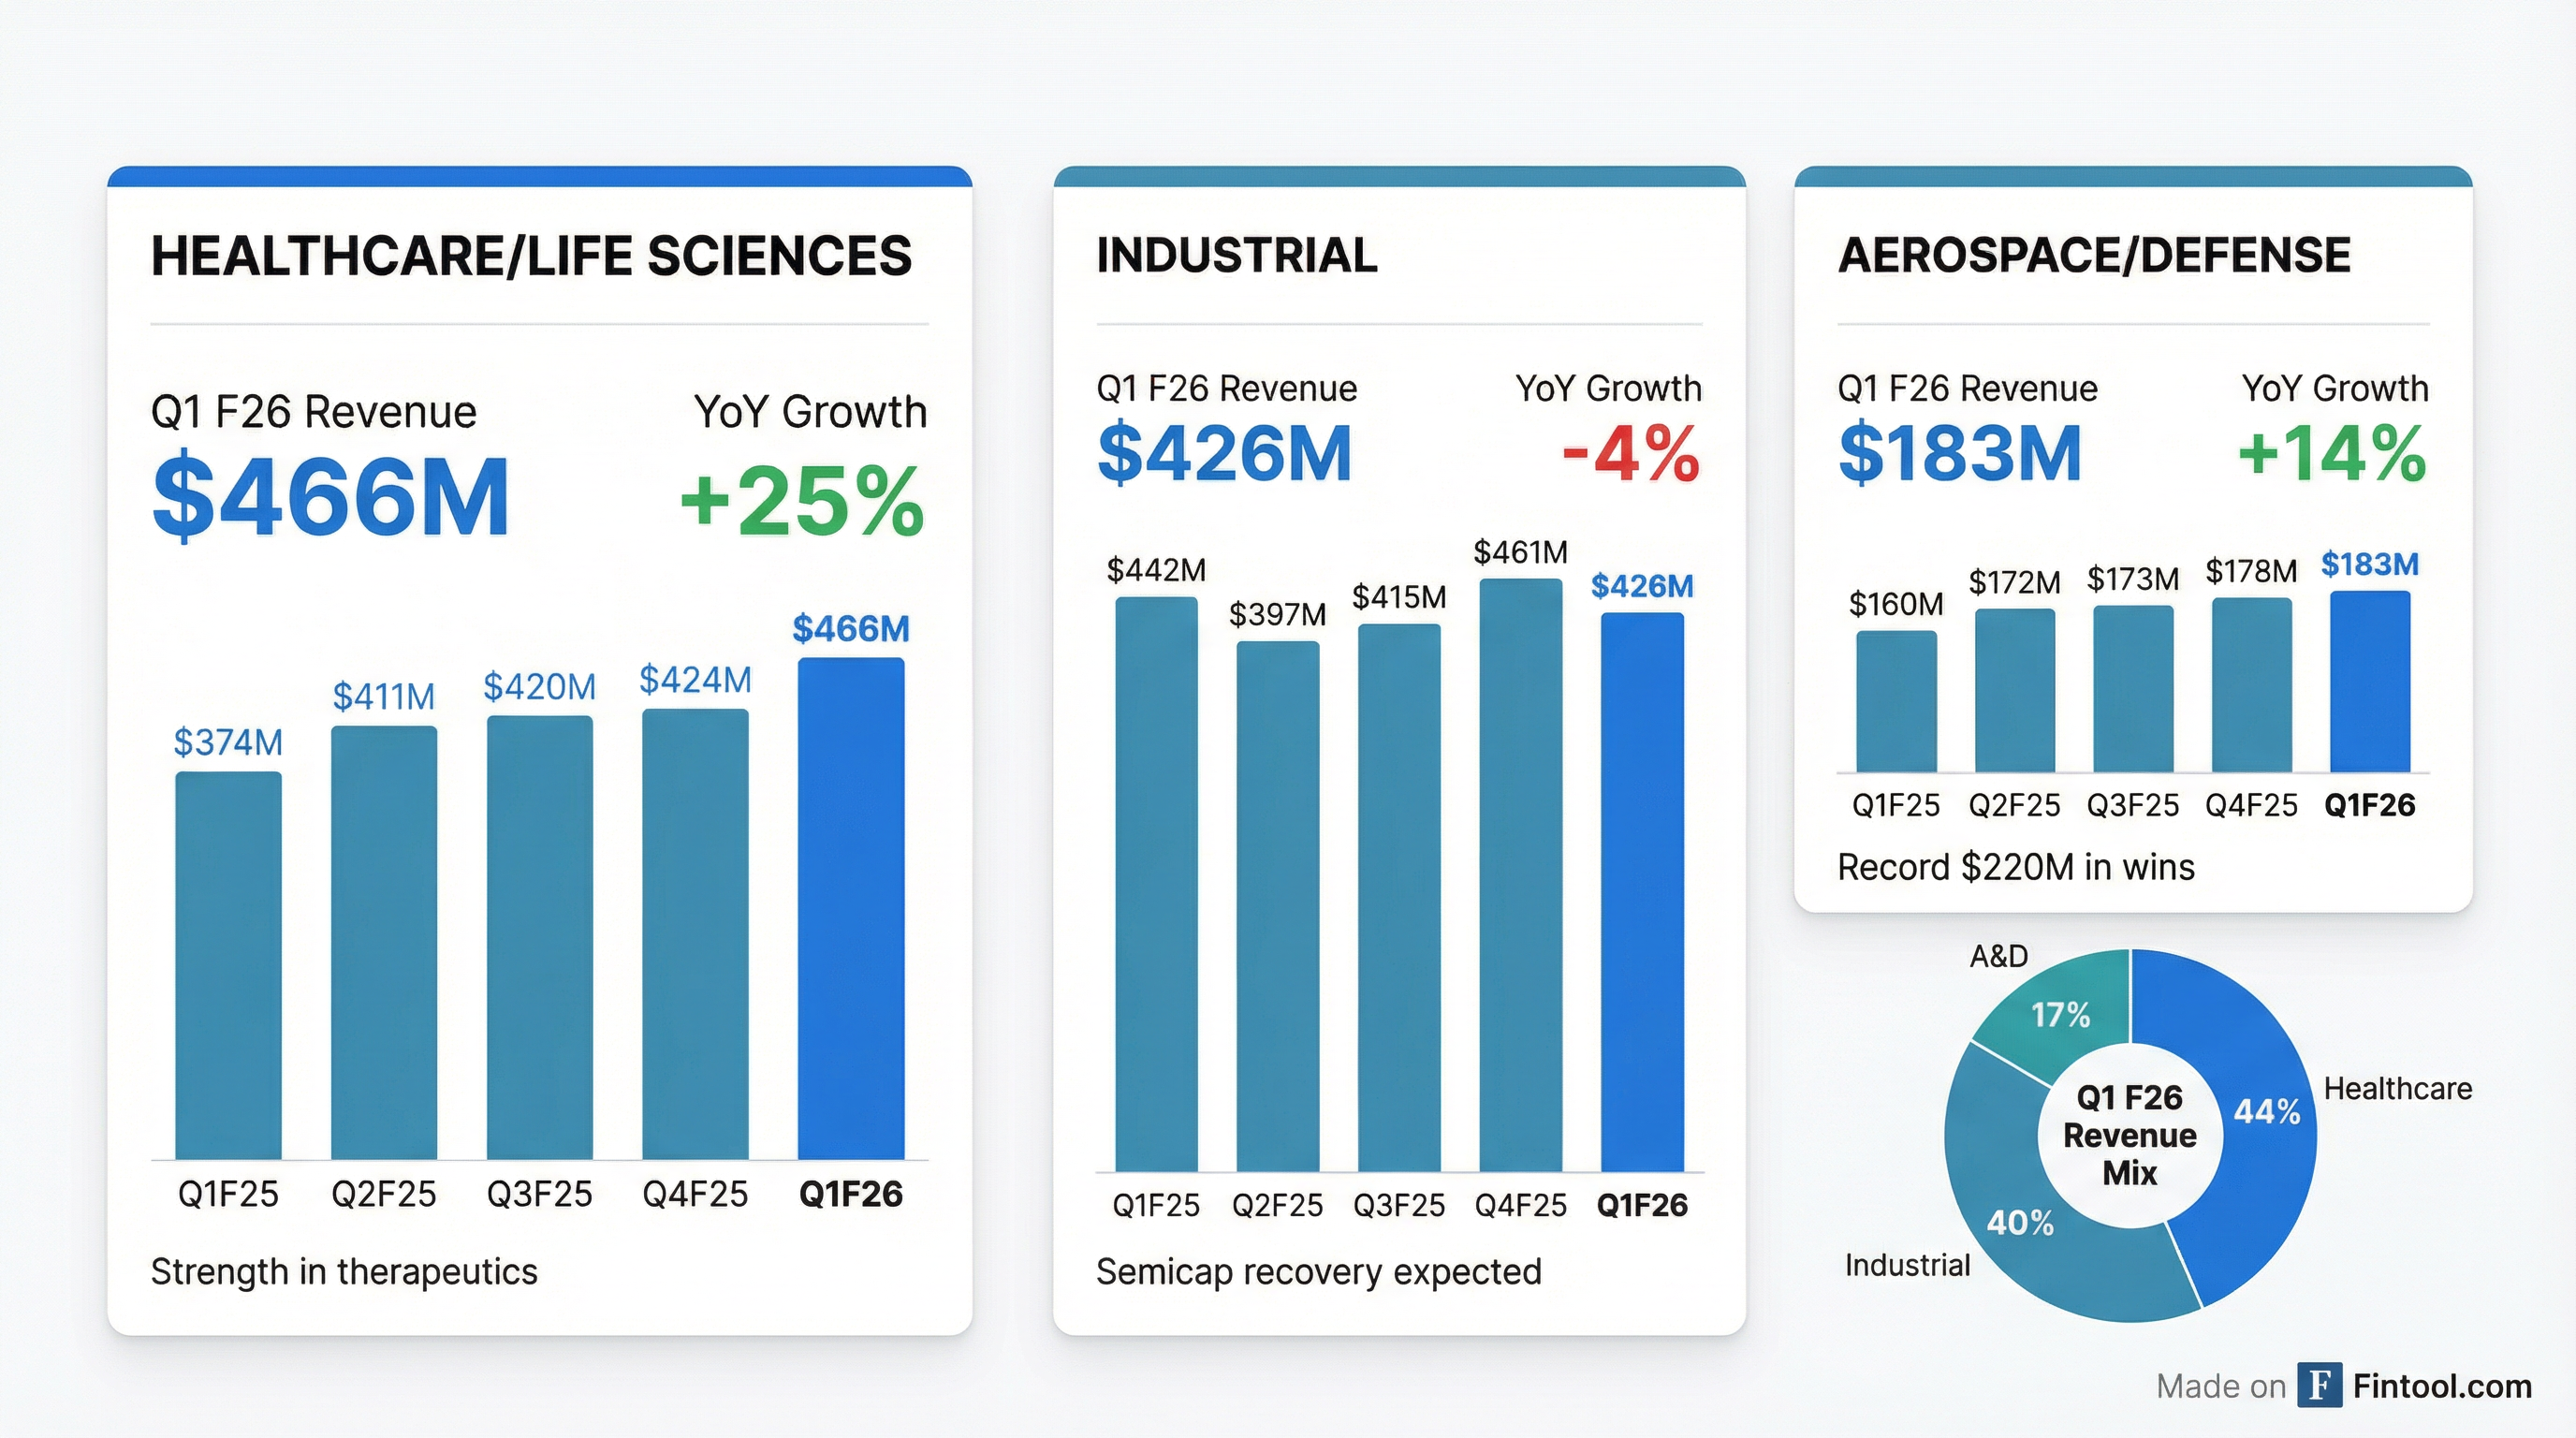
Healthcare/Life Sciences is the growth engine:
- Q1 FY26 revenue: $466M (+25% YoY)
- Driven by strength in therapeutics
- FY26 growth expected to exceed 9-12% goal
Aerospace/Defense is building momentum:
- Q1 FY26 revenue: $183M (+14% YoY)
- Below expectations on customer inventory management
- Q2 growth expected from new program ramps
- FY26 revenue growth expected to exceed 9-12% goal
Industrial faces near-term softness:
- Q1 FY26 revenue: $426M (-4% YoY)
- Robust Q2 forecast on semicap strength
- FY26 expected to approach 9-12% goal
How Did the Stock React?
PLXS shares rose 4.2% to $180.85 on January 28, 2026—within striking distance of the 52-week high of $186.47.
Key stock metrics:
- Day's range: $173.75 - $181.97
- After-hours: $180.01
- 52-week range: $103.43 - $186.47
- Market cap: $4.84 billion
The stock has roughly doubled from its 52-week low, driven by consistent execution on the 9-12% growth framework and expanding margins.
Key Metrics Trend
Cash Flow and Capital Allocation
Q1 FY26 saw negative free cash flow of $(50.6) million, a sharp reversal from Q4 FY25's $97.2 million.
This was intentional—management is investing in working capital to support "robust anticipated F26 revenue growth." Cash cycle days expanded to 69 from 63, primarily driven by inventory builds for new program ramps.
Management maintained its FY26 free cash flow guidance of approximately $100 million while continuing share repurchases.
Forward Catalysts
Near-term (Q2 FY26):
- New program ramps in Aerospace/Defense
- Semicap recovery benefiting Industrial
- Continued Healthcare/Life Sciences strength
Full-year FY26:
- Potential to exceed 9-12% revenue growth target
- Significant operating profit expansion
- $100M free cash flow while investing for growth
Strategic positioning:
- Record Aerospace/Defense wins signal multi-year program visibility
- Expanded leadership in commercial space
- Share gains from internal manufacturing transitions
Upside not in guidance:
- Boeing production ramp not yet reflected in forecasts
- Defense spending from recent news headlines hasn't flowed through
- Data center power/thermal solutions funnel building
Risks and Concerns
-
Industrial softness: The segment declined 4% YoY and requires semicap recovery to approach growth targets
-
Working capital pressure: Cash cycle expanded 6 days sequentially, and negative FCF in Q1 reflects growth investments
-
Customer concentration: Year-end inventory management by A&D customers caused Q1 to miss expectations for that segment
-
S&A expense growth: Selling & administrative expense guidance of $54-55M for Q2 is up from $51.7M in Q1 as the company invests in "talent, technology, facilities and advanced capabilities"
-
Seasonal margin headwinds: Q2 faces 50-60 bps headwind from compensation cost increases that must be overcome through productivity and revenue leverage
-
Lead time risk: Semiconductor and PCB lead times are extending—while manageable, this bears monitoring
Q&A Highlights
The earnings call Q&A revealed several important insights not captured in the prepared remarks:
Semi-Cap Recovery Timing
When asked about semi-cap OEMs calling for >20% growth, management noted: "It's still early days...This is something we've seen here just through the last quarter, the uptick in demand from our customers." Demand increases will flow through in 1-2 quarters—faster than typical win ramps—because Plexus has buffer stock inventory and can respond rapidly.
Boeing Upside Not Yet Reflected
A key disclosure: "We're not seeing the full pull-through from Boeing yet. So while we're seeing some modest improvement, we're not seeing the full pull-through from their increasing volumes." This suggests additional A&D upside as Boeing production rates normalize.
Defense Spending Tailwinds Ahead
Management noted that "the implied spending from news headlines has not trickled through in any substantial way for us here yet in terms of demand signal from our end customers." Another potential upside not baked into guidance.
Facility Margin Progression
- New Malaysia facility: <10 bps headwind in Q1, break-even in Q2, approaching corporate average margins by back half of FY26
- Thailand facility: Contributing 25-30 bps tailwind to overall margins in FY26—"part of the reason why I think we can get to our 6% or above back half of this year"
Capacity Runway
When asked about capacity constraints: "We think we could comfortably support about $6 billion in revenue with the existing footprint." Current revenue run-rate is ~$4.3B annualized, implying significant runway.
Supply Chain Watch
Lead times are extending in semiconductors and APAC-sourced printed circuit boards. Plexus is pre-positioning inventory and extending PO coverage with suppliers. Management believes improved SIOP processes put them in "significantly better position" than during 2021-2022 shortages.
AI and Automation Initiatives
Management provided detailed commentary on operational technology investments:
Material Handling Robots: Piloted in FY25, now deployed across all global sites by spring 2026. Each bot replaces 1.5-2 FTEs with <12 month ROI. One site achieved 75% reduction in material deployment mileage after floor layout optimization.
AutoStore 3D Warehouses: Converting traditional warehouses to three-dimensional cube systems with robots—yielding 60% reduction in warehouse space that can be converted to production floor.
AI Applications:
- Work order optimization: "Significant reduction in WIP on the production floor expected"
- Camera + AI for standard work times: Improving labor efficiency in high-mix assembly
- Quoting process acceleration: "Will have an impact on revenue as well, bringing in new wins"
- Enterprise-wide deployment: "We've fully deployed AI tools to the desks of all our employees. And that's getting well over 30% daily usage from our staff."
Capital Shift: "I see a shifting over the next few years from more footprint additions to these automation investments." CapEx expected to remain ~2.5% of revenue.
Energy & Data Center Opportunity
A notable disclosure buried in the Industrial segment discussion: Plexus is seeing strong funnel growth in data center-adjacent technologies:
- Power management and storage
- Thermal cooling solutions (supporting thermal density requirements)
- Distribution and control systems
Management noted "several good-sized opportunities in the funnel" for technology supporting data center infrastructure.
Bottom Line
Plexus delivered a clean beat on the metric that matters most—EPS at the high end—while posting record wins that support management's increasingly confident FY26 outlook. The $220 million Aerospace/Defense win quarter is a potential inflection point for a segment that could become a material growth driver.
The Q&A revealed multiple sources of upside not reflected in guidance: Boeing production ramps haven't flowed through, defense spending headlines haven't converted to orders, and semi-cap demand is just beginning to inflect. With capacity to support ~$6B in revenue (vs. ~$4.3B current run-rate), Plexus has significant runway without footprint additions.
The operational story is equally compelling: AI tools at 30%+ daily adoption, automation investments replacing headcount with <12 month ROI, and new facilities in Malaysia and Thailand approaching corporate-average margins. This positions Plexus for margin expansion even as it invests for growth.
The stock's 4% pop reflects growing confidence that the 9-12% revenue growth framework isn't just achievable—it may prove conservative. With Healthcare/Life Sciences growing 25%, A&D wins accelerating, and multiple sources of unpriced upside, Plexus has rarely looked this well-positioned.
Related: