Schneider National (SNDR)·Q4 2025 Earnings Summary
Schneider National Misses Q4 as Weak Peak Season Hits Results; Stock Slides 14%
January 29, 2026 · by Fintool AI Agent
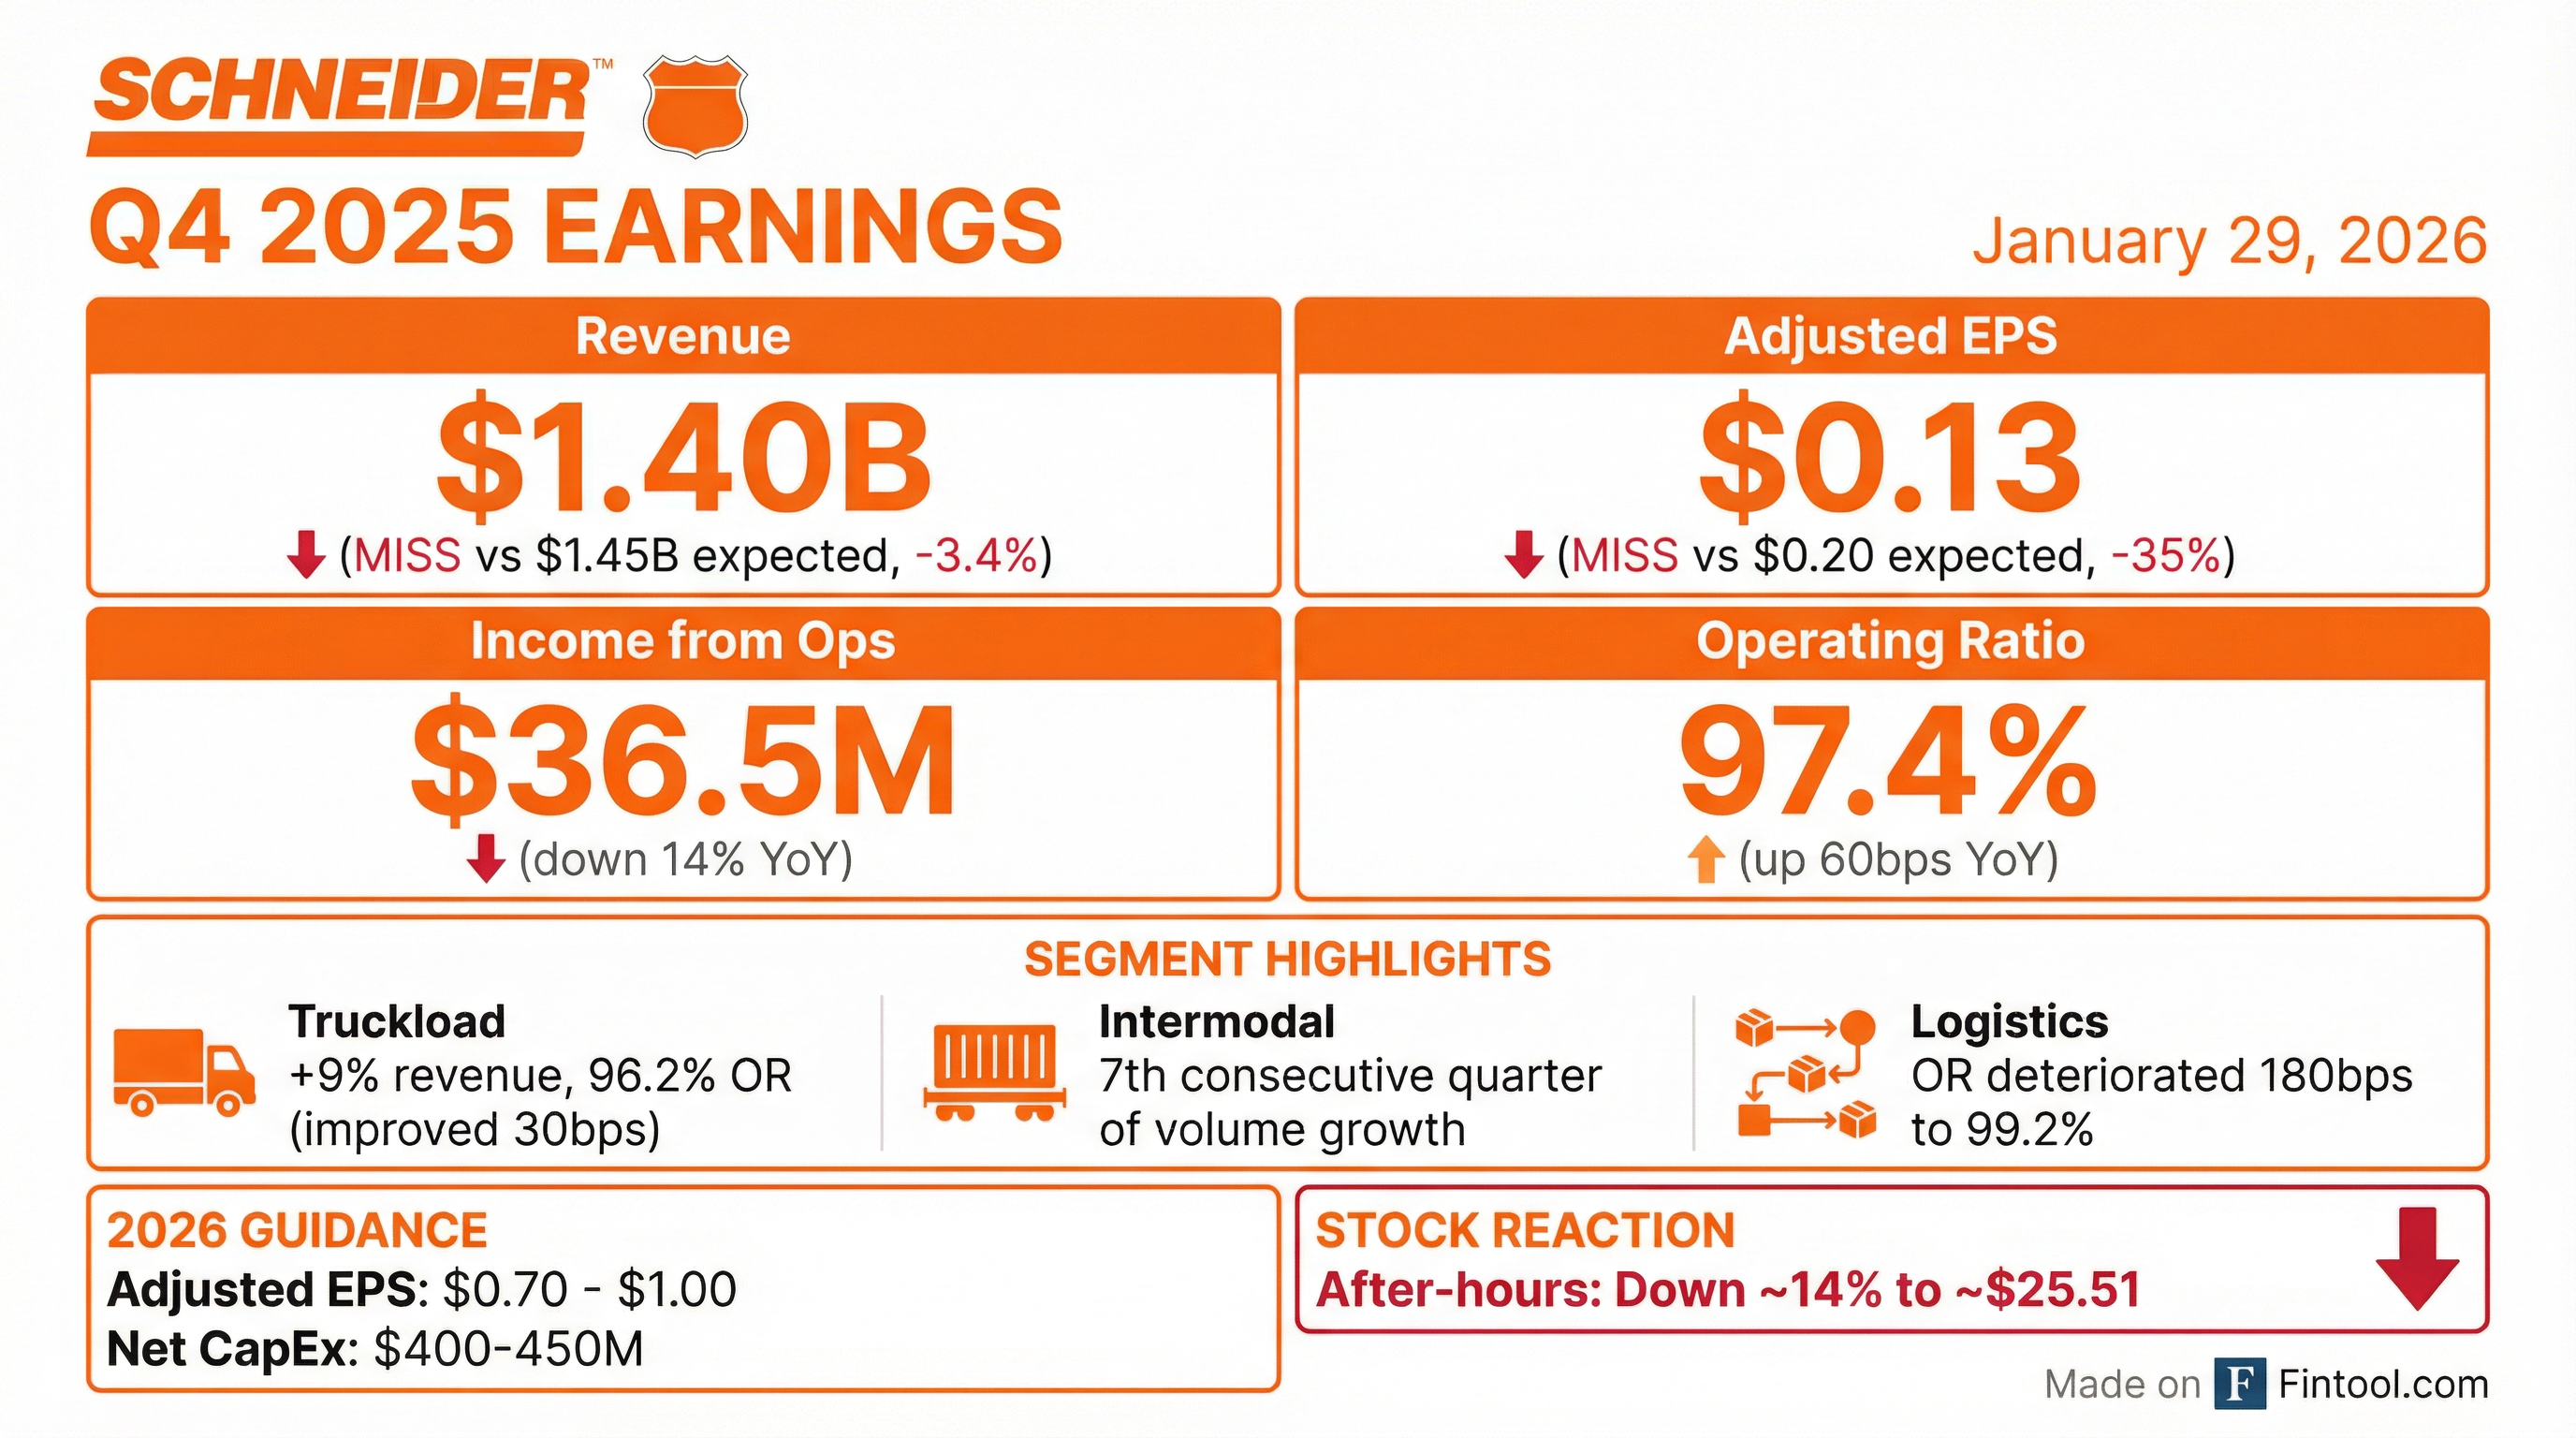
Schneider National (NYSE: SNDR) delivered a disappointing Q4 2025, missing both revenue and EPS estimates as a truncated peak season and elevated costs weighed on results. The stock plunged ~14% in after-hours trading to approximately $25.51 as the company also provided 2026 guidance well below current consensus expectations.
Did Schneider Beat Earnings?
No. Schneider missed on both revenue and EPS.
This marks Schneider's second consecutive quarterly EPS miss, following the Q3 2025 miss where the company reported $0.12 vs. $0.21 expected.
Income from operations declined 14% year-over-year to $36.5 million, while the operating ratio deteriorated 60 basis points to 97.4%.
What Happened This Quarter?
CEO Mark Rourke attributed the miss to several factors that emerged mid-quarter:
"Fourth quarter results fell short of our guidance as a result of softer than expected market conditions beginning in November, particularly for volume, reflecting a very truncated peak season. There was strong improvement in late December reflecting a combination of weather disruption and some positive seasonality being met with thinner supply, a direct result of the accelerated capacity attrition seen in recent months. However, the strength exiting the year was not enough to offset the tempered demand that characterized much of the quarter."
Key headwinds this quarter:
- Truncated peak season with soft November demand
- Spiking third-party carrier capacity costs, especially in California
- Unplanned auto production shutdowns due to chip/component issues
- Elevated healthcare costs (majority hitting Dedicated)
The silver lining: late December saw improvement as accelerated capacity exit from the market met lingering demand. Management noted that December saw a "multi-year high" in bill miles per truck despite the soft quarter.
Importantly, management framed the pricing opportunity around industry cost inflation: "They look at the same ATRI data that we do that says our costs are up about 25% since before the pandemic. Meanwhile, rates haven't moved very much."
How Did the Segments Perform?
Truckload: The Bright Spot
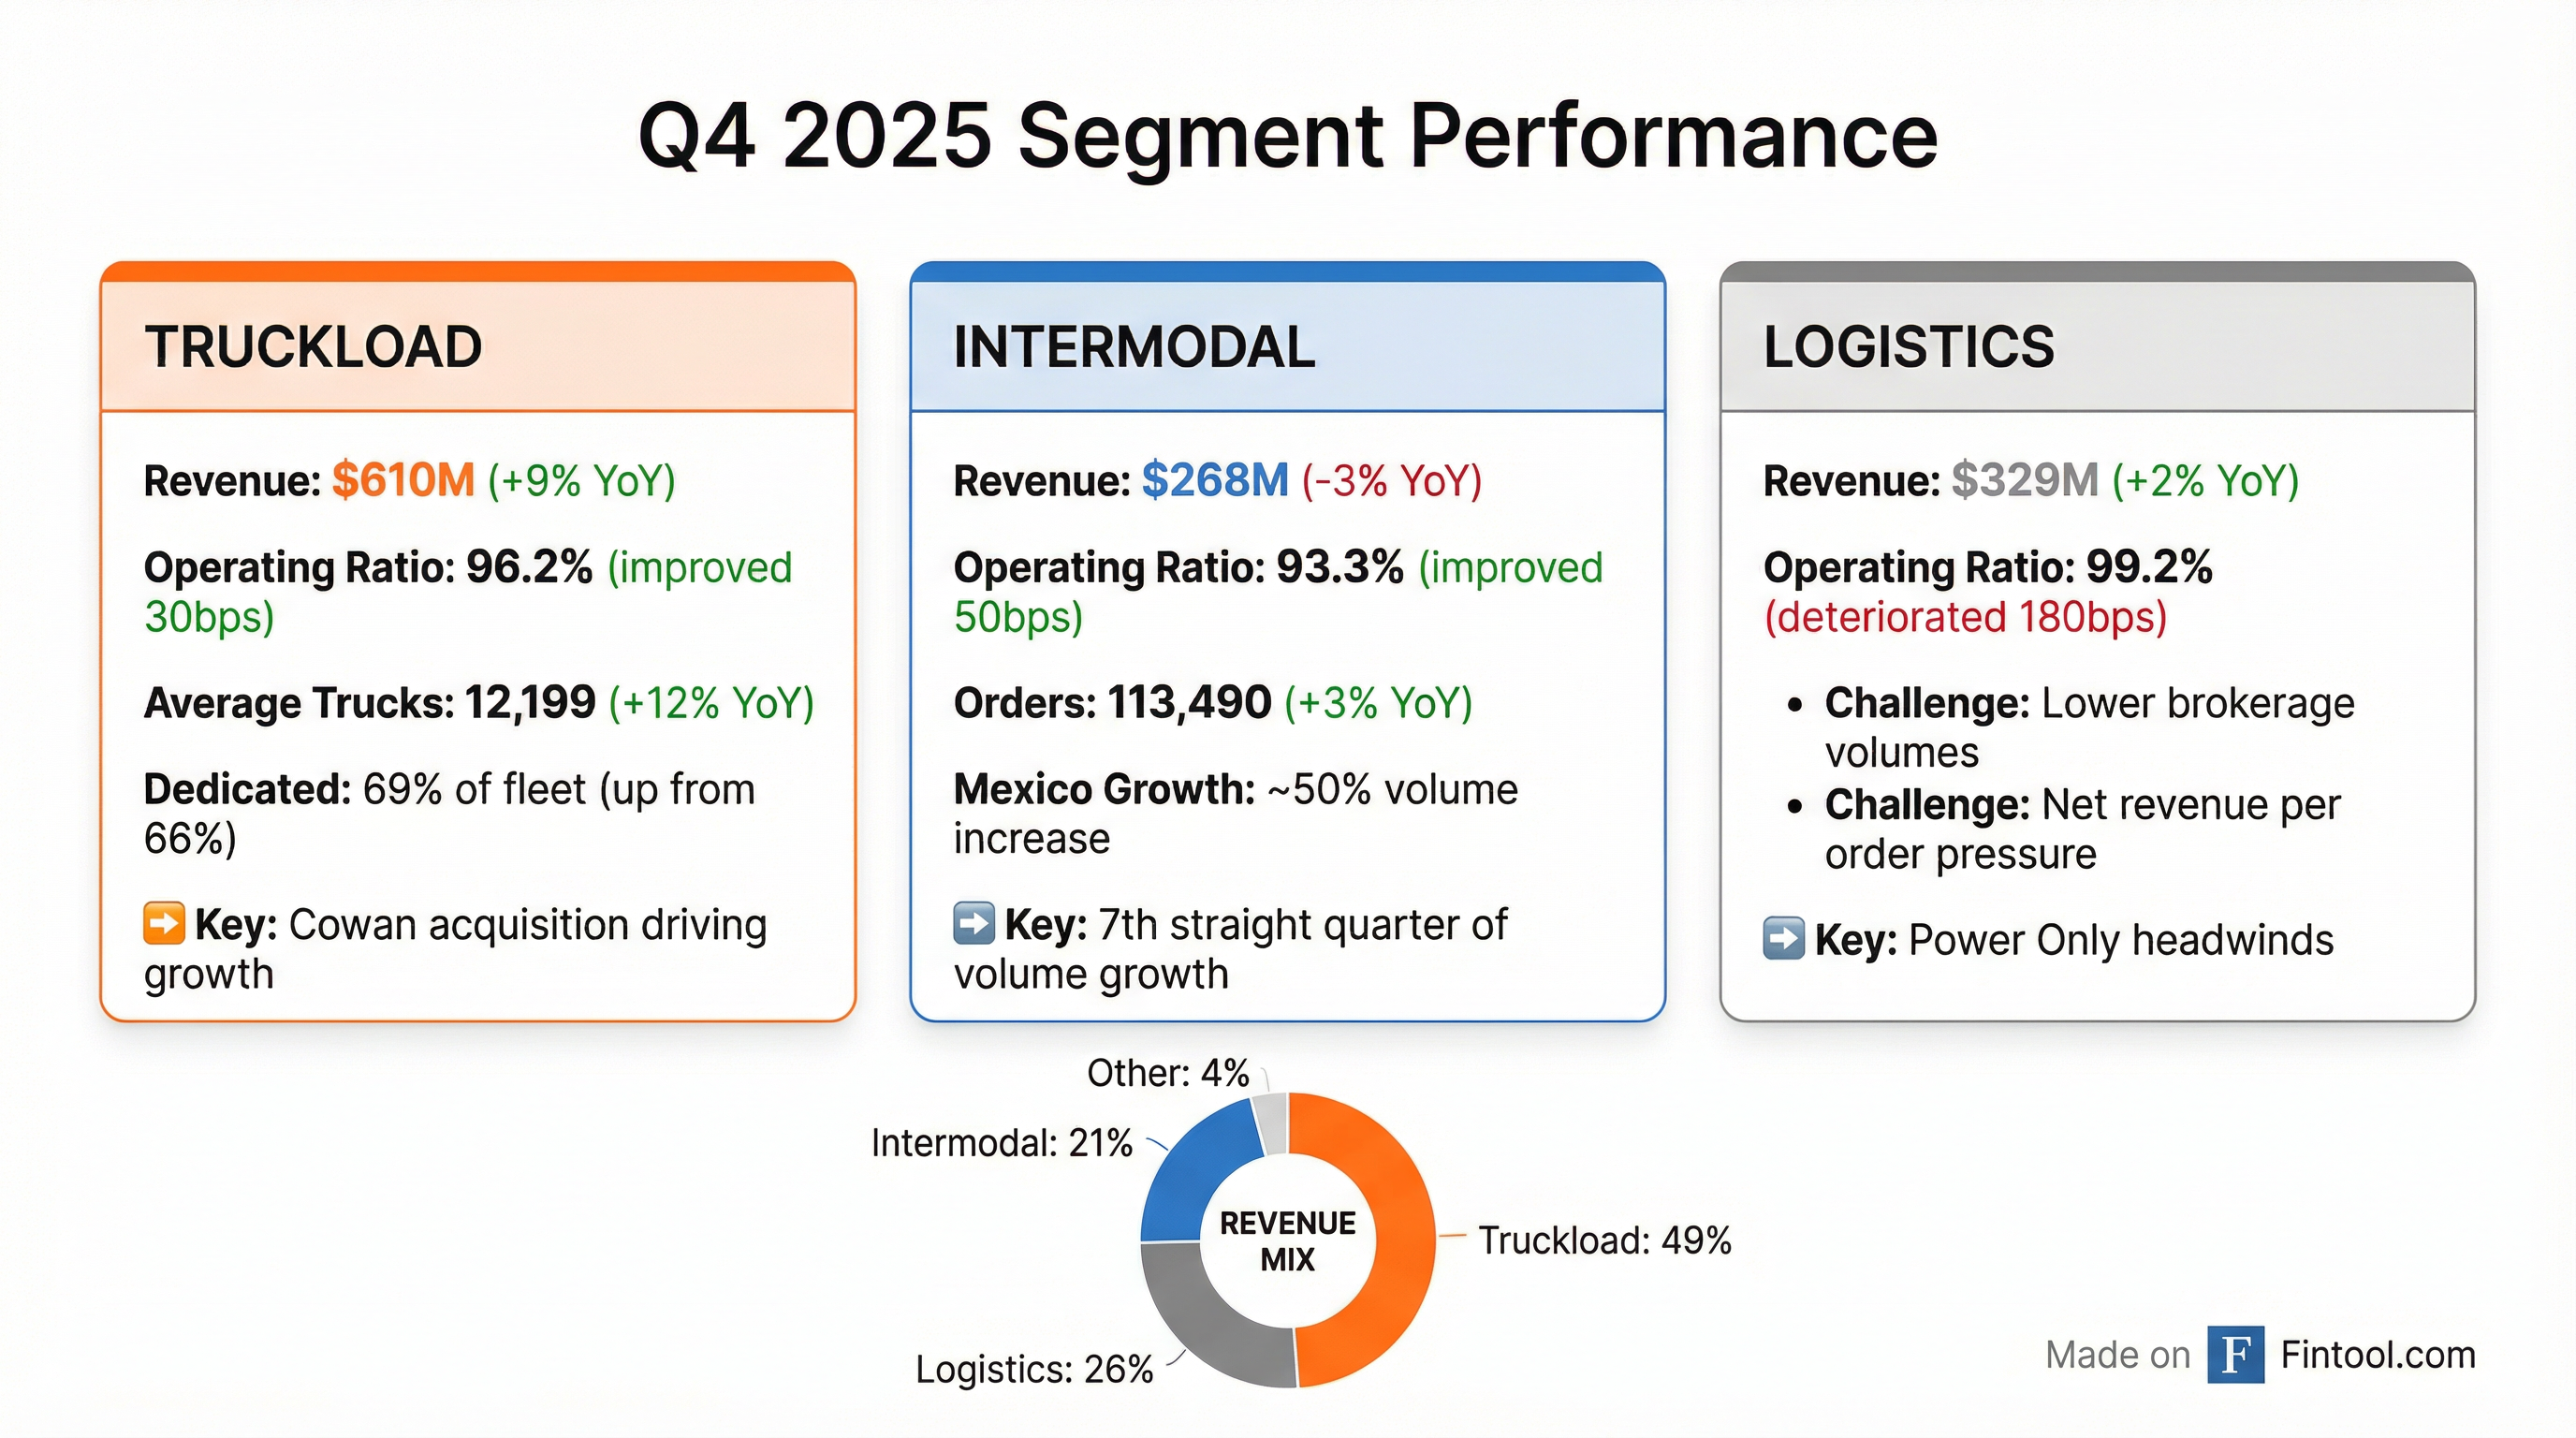
Truckload was the best-performing segment, with revenue growing 9% year-over-year to $610 million, driven largely by the Cowan Systems acquisition completed in December 2024.
Dedicated now represents 69% of the Truckload fleet, up from 66% a year ago.
Intermodal: Volume Momentum Continues
Intermodal marked its seventh consecutive quarter of volume growth, with orders up 3% year-over-year. Mexico volumes were particularly strong, growing approximately 50%.
Revenue declined despite volume growth due to a 5% decrease in revenue per order from customer rate and freight mix.
Logistics: Under Pressure
Logistics was the weakest segment, with operating ratio deteriorating 180 basis points to 99.2% — essentially breakeven.
The decline was driven by lower volumes in the brokerage business and reduced net revenue per order in Power Only.
What Did Management Guide?
Schneider provided 2026 guidance that came in below Street expectations:
CFO Darrell Campbell provided context:
"We are entering 2026 with capacity continuing to exit the market at an accelerated pace as a result of various regulatory actions that have been taken which will be supportive of improving market conditions. However, fourth quarter results also underscore the variability in demand, which will be key in determining the pace and magnitude of improvement in the cycle."
The company is targeting an additional $40 million in cost savings for 2026, building on the $40 million achieved in 2025.
How Did the Stock React?
The stock closed the regular session at $29.71, down 1.7%, but plunged approximately 14% in after-hours trading to ~$25.51. This represents a stark reversal from the stock's recent momentum — SNDR had been up nearly 48% from its 52-week low of $20.11.
Key stock metrics:
What Changed From Last Quarter?
While sequential EPS improved slightly, the market was disappointed by:
- Miss versus elevated expectations heading into peak season
- Wide and below-consensus 2026 guidance range
- Logistics segment continuing to struggle
Leadership Transition Announced
Separately, Schneider announced a CEO transition. Jim Filter will succeed Mark Rourke as CEO, with Rourke becoming Executive Chairman.
Filter has been with Schneider since 1998 and currently serves as Executive Vice President and Group President of Transportation and Logistics.
Capital Allocation Update
Shareholder returns remain a priority:
- Dividend increased 5% to $0.10 per share quarterly (from $0.095)
- New $150 million share repurchase program authorized in January 2026, replacing the prior program
- Repurchased 4.4 million shares for $110 million under the prior program
- Dividends have increased 100% since the 2017 IPO
Balance sheet remains strong:
- Net debt leverage: 0.3x
- Cash: $201.5 million
- Total debt: $402.5 million
- Free cash flow: $348 million for full year 2025
Q&A Highlights
On Regulatory-Driven Capacity Exit
Management expressed strong conviction that regulatory enforcement is fundamentally reshaping the supply side of trucking. EVP Jim Filter provided detail:
"We've been talking about shadow capacity for quite a while. And that's coming from non-documented workers that are able to get CDLs, CDL mills, graduating students without the investment to become safe drivers, drivers that don't meet the English language proficiency, B-1 committing cabotage, and ELDs that are self-certified improperly. So the step-up in enforcement that we're starting to see, that's not only removing capacity, but that's starting to constrict the top of the funnel with new drivers entering."
Management believes the impact will be "greater than what we saw from the electronic logging mandate in 2017" and will play out "over several quarters."
On Shipper Behavior
Shippers are responding to supply risk by seeking more stability:
"What I've been hearing from shippers more recently is they're focused on the supply risk. They're looking for rate assurance. They saw this in December. They're seeing it through these storms. We have more shippers asking us for multi-year deals."
On AI Implementation
Schneider is deploying AI across its operations:
"We continue to roll out agentic AI throughout all our service offerings and a variety of support functions. We're already seeing enthusiastic adoption across the enterprise and early payoffs in improving service levels and in lowering our cost to serve."
For Dedicated specifically, management sees AI-driven backhaul optimization as a high-margin opportunity:
"This is one of the really great places of using agentic AI to talk to other agent AI to garner efficient volumes on our backhauls that can. It's a very high incremental margin play for us."
On Intermodal Differentiation
Jim Filter highlighted competitive advantages in Mexico operations:
"You think about in Mexico, we're delivering service that's 1-3 days faster, 99.98% claims-free. That's a big advantage, not just to other intermodal carriers, but over the road as well. And now we're leveraging some of our differentiation with Fast Track with shippers that have really high service expectations."
The company also launched its Fast Track service for high-service customers and believes it can grow Intermodal 20%-25% without adding containers.
On Demand Catalysts
Management sees several potential tailwinds for freight demand:
"If we look further out on the horizon, there's a lot of positive catalysts that we see out there, whether it's from capital investments as a result of the One Big Beautiful Bill Act, some strong tax refunds, interest rate cuts that start to spur home investment again."
Key Risks and Watchpoints
Near-term concerns:
- Freight demand variability continues to pressure results
- Logistics segment profitability at critical levels (99.2% OR)
- Customer rate pressure in Intermodal despite volume growth
- Healthcare cost inflation impacting margins
Potential positives:
- Accelerated capacity exit from regulatory enforcement could support pricing
- Intermodal volume momentum continues (7 consecutive quarters of growth, 20% operating income growth for FY25)
- Mexico nearshoring opportunity — volumes up 50% YoY with service that's "1-3 days faster, 99.98% claims-free"
- Strong balance sheet supports investment through the cycle (0.3x net leverage)
- Cost savings program ($40M achieved, $40M targeted for 2026)
- agentic AI rollout driving service and cost improvements
- Fast Track intermodal service launch for high-service customers
- Shippers seeking multi-year deals, indicating supply concern
Historical Earnings Performance
*Values retrieved from S&P Global and company filings.
Related Resources: