Earnings summaries and quarterly performance for BIO-TECHNE.
Executive leadership at BIO-TECHNE.
Kim Kelderman
President and Chief Executive Officer
James Hippel
Executive Vice President – Finance and Chief Financial Officer
Matthew McManus
President – Diagnostics and Spatial Biology
Shane Bohnen
Senior Vice President – General Counsel and Corporate Secretary
William Geist
President – Protein Sciences
Board of directors at BIO-TECHNE.
Research analysts who have asked questions during BIO-TECHNE earnings calls.
Puneet Souda
Leerink Partners
6 questions for TECH
Patrick Donnelly
Citi
5 questions for TECH
Dan Arias
Stifel Financial Corp.
3 questions for TECH
Daniel Leonard
Stifel Financial Corp.
3 questions for TECH
Dan Leonard
UBS Group AG
3 questions for TECH
Matthew Larew
William Blair & Company
3 questions for TECH
Matt Larew
William Blair & Co.
3 questions for TECH
Sung Ji Nam
Scotiabank
3 questions for TECH
Brandon Couillard
Wells Fargo
2 questions for TECH
Daniel Arias
Stifel, Nicolaus & Company, Incorporated
2 questions for TECH
Daniel Markowitz
Evercore ISI
2 questions for TECH
Mac Etoch
Stephens Inc.
2 questions for TECH
Brandon Couillard
Wells Fargo & Company
1 question for TECH
Catherine Schulte
Baird
1 question for TECH
Conor Noel McNamara
RBC Capital Markets
1 question for TECH
Hannah Hefley
Stephens
1 question for TECH
Jacob Johnson
Stephens Inc.
1 question for TECH
Justin Bowers
Deutsche Bank AG
1 question for TECH
Kyle Boucher
TD Cowen
1 question for TECH
Paul Knight
KeyBanc Capital Markets
1 question for TECH
Steven Etoch
Stephens Inc.
1 question for TECH
Thomas Peterson
Robert W. Baird & Co. Incorporated
1 question for TECH
Tom DeBourcy
Nephron Research LLC
1 question for TECH
Recent press releases and 8-K filings for TECH.
- End-market demand: large pharma (≈30% of revenue) grew low double-digit, biotech (≈20%) saw mid-single-digit declines amid funding volatility but funding has rebounded to high-single-digit/90%+ growth, academic (≈20%) stabilized at low-single-digit declines post NIH +1% funding, and Asia (≈16%; half China) delivered three quarters of growth with double-digit expansion in rest of Asia.
- FY2026 guidance targets mid-single-digit growth exiting Q4, with timing uncertainty around biotech and academic spending recovery; GMP protein headwinds from two large customers will ease from 400 bps in Q2 to 300 bps in Q3 and 150 bps in Q4.
- Excluding the two GMP customers, the remaining 700+ cell therapy clients grew 30% in the quarter (TTM high-teens), with >80 in clinical trials (≈12 in Phase I/II, ≈6 in Phase III) and net customer additions of low-single-digit percentage, indicating robust pipeline progression.
- Strategic priorities include quality-focused M&A in cell therapy adjacencies, organoids, antibodies, and data-driven tools, supported by an enhanced corporate development team ; integration of AI for next-generation protein development and increased demand for data-driven wet-lab and instrument solutions is viewed as a long-term tailwind.
- Bio-Techne exited Q2 FY2026 with low-double-digit growth in its pharma segment (30% of revenues) and mid-single-digit declines in biotech (20% of revenues), though biotech funding showed green shoots with high-single-digit growth, underpinned by renewed M&A activity.
- Academic end markets (20% of revenues) stabilized, with European academic up low- to mid-single digits and U.S. academic down low single digits, supported by a 1% NIH budget increase and removal of indirect cost caps; Asia (16–17% of revenues) delivered three quarters of growth, including double-digit in Rest of Asia, driven by government funding and cell therapy demand in China.
- For FY2026, management expects to exit Q4 at mid-single-digit revenue growth and expand margins by 100 bps to the mid-30s%, benefiting from easing headwinds as two large GMP customers progress to commercialization and continued China tailwinds.
- Excluding its two largest GMP customers, the remaining 700+ GMP protein customers grew 30% in Q2 (TTM high teens%), underpinning an expected 20% floor growth for the segment; M&A remains a priority with strategic focus on cell therapy, organoids, antibodies, and AI-driven protein development.
- Pharma (30% of revenue) recorded low double-digit growth in Q2, driven by large pharma rebounding after MFN tariff concerns.
- Biotech (20% of revenue) saw mid-single-digit declines exiting Q2, but Jan-Feb 2026 funding grew high single digits, indicating renewed spending and M&A activity.
- Academic (~20% of revenue) stabilized at low single-digit declines; a 1% NIH budget increase and removal of indirect cost caps support a recovery as grants roll out starting in March.
- Asia (16-17% of revenue) continues to recover, achieving three consecutive quarters of growth in China and double-digit expansion in the rest of Asia in the latest quarter.
- Fiscal 2026 guidance targets mid-single-digit full-year growth, with performance hinging on the timing of biotech and academic spending realization and reduced GMP headwinds in Q4.
- In fiscal Q2, total underlying organic growth was 3%, despite headwinds from GMP reagents, and the company expects to exit FY26 with mid-single digit organic growth.
- Large pharma segment (~30% of revenue) delivered five consecutive quarters of double-digit growth, driven by demand for reproducible, automated workflows and AI-enabling data.
- Biotech funding rose ~90% over the last four months, historically translating to reagent spend in about three quarters, potentially faster under existing capacity.
- Plans to acquire the remaining 80% of Wilson Wolf by December 2027, integrating the G-Rex bioreactor to enhance cell and gene therapy offerings and high-margin reagent pull-through.
- CFO projects 50 basis points of margin expansion at 5–10% growth and 100 basis points at double-digit growth, aiming for adjusted EBIT margins in the mid-30s% range as markets recover.
- Bio-Techne expects to exit fiscal 2026 at mid-single digit organic growth, driven by double-digit large pharma growth and 90% biotech funding uptick over recent months, with overall underlying growth at 3% in Q2FY26.
- The core reagents portfolio (52% of revenues) and four growth verticals—protein analytics, cell & gene therapy, spatial biology, molecular diagnostics—provide outperformance, with proteomic analytics consumables up double-digit in 10 of the last 13 quarters.
- The GMP reagents business (
$60 M run rate) plus media ($20 M run rate) faces a 200–400 bps organic headwind in Q1–Q2FY26 from two large cell therapy customers granted Fast Track designation, easing by Q4. - Plans to acquire Wilson Wolf’s G-Rex bioreactor (remaining 80% in Dec 2027) will bolster cell therapy workflows; Wilson Wolf grew mid-teens TTM, holds ~45% clinical market share, and delivers ~70% EBITDA margins (modeled to 60% post-close).
- Bio-Techne reported Q2 FY26 underlying organic growth of ~3% and reaffirmed its outlook for low-single-digit growth, expecting to exit June at mid-single-digit growth.
- Large pharma (30% of revenues) delivered double-digit growth for the fifth consecutive quarter, while biotech funding rose 90% over the last four months, expected to flow through to tool spending in ~3 quarters.
- GMP reagents business faces lumpiness from two major cell therapy customers with Fast Track designation, creating a headwind of 200 bps in Q1, 400 bps in Q2, 300 bps in Q3 and 150 bps in Q4, before comps normalize.
- Agreed to acquire the remaining 80% of Wilson Wolf by Dec 2027, integrating its G-Rex bioreactor to pull-through high-margin reagents; Wilson Wolf grew 20% last quarter with ~70% EBITDA margins.
- Proteomic analytics (ProteinSimple) franchise exceeded $300 M in revenues (25% of company), with consumables growing double digits in 10 of the last 13 quarters, driven by automation and AI-ready data.
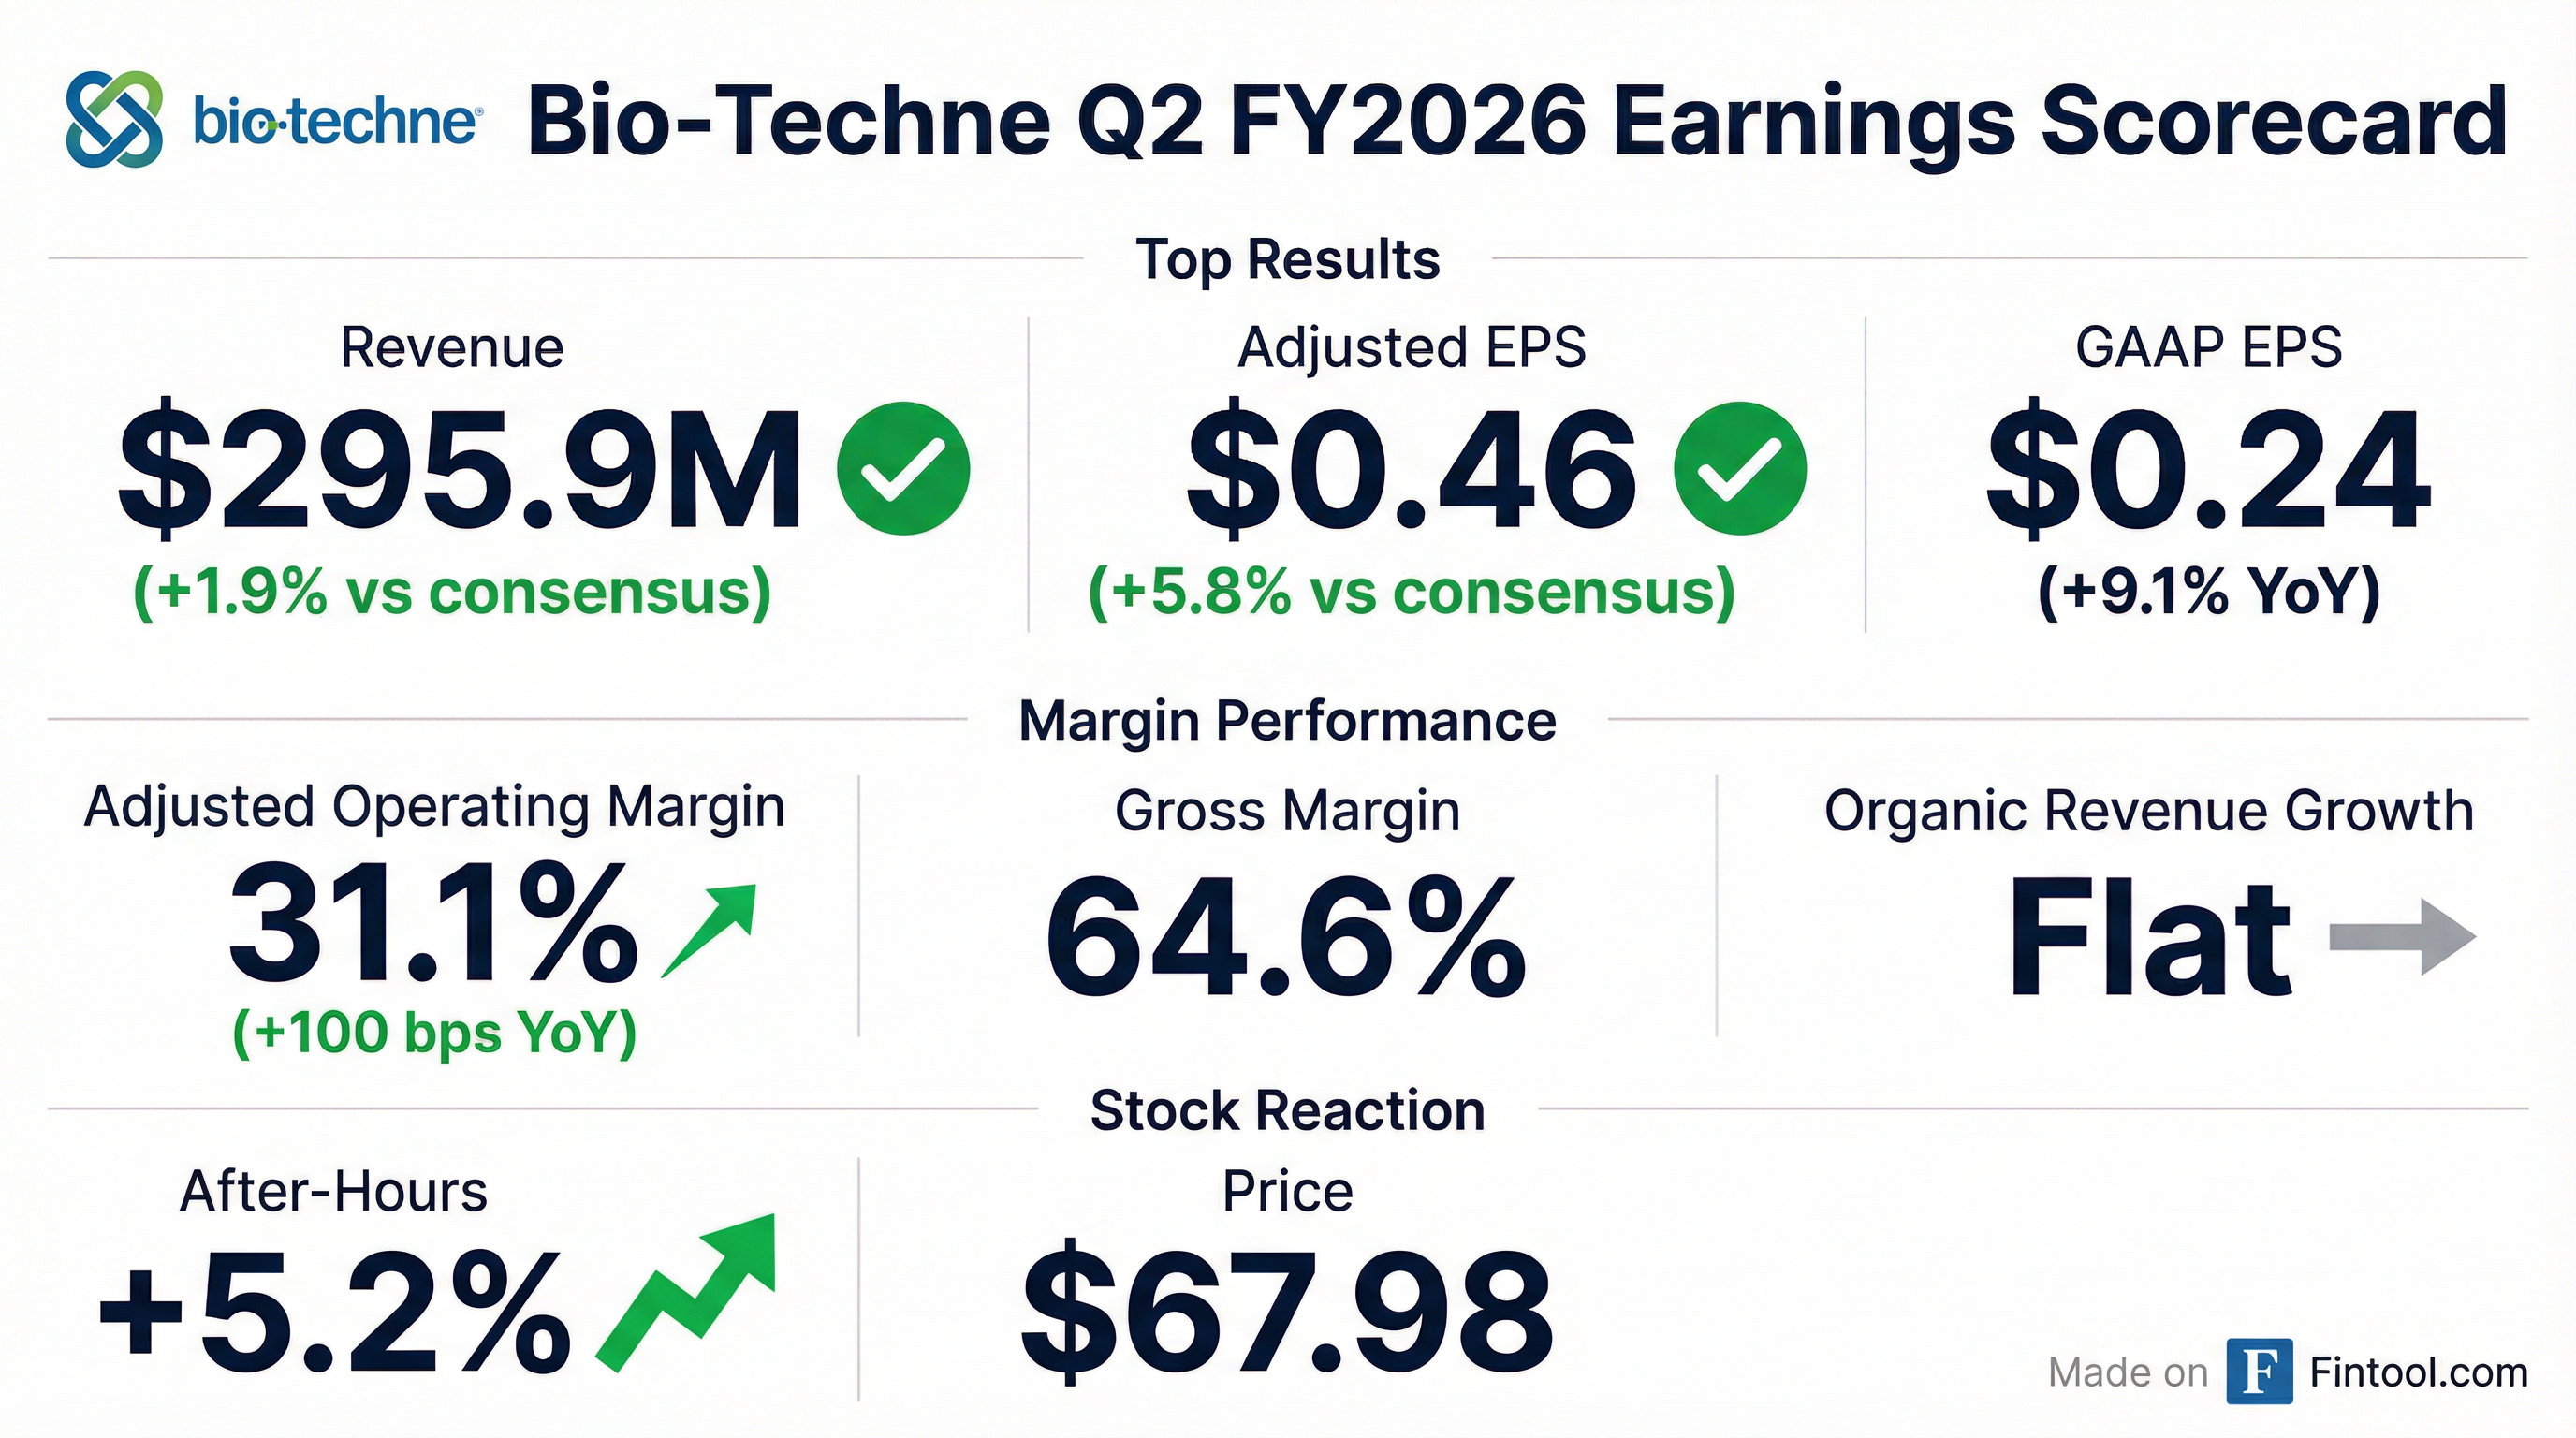
- Total revenue was $295.9 M, flat year-over-year; adjusted EPS was $0.46, up 10% YoY; adjusted operating margin expanded to 31.1%, +100 bps YoY.
- Protein Sciences sales of $215.1 M (+2% reported, –1% organic; +4% ex-cell therapy timing impacts); Diagnostics & Spatial Biology sales of $81.2 M (–4% reported, +3% organic) with segment margin improving to 10.4% from 3.9% YoY.
- Geographically, North America revenue declined upper single digits, Europe was flat, China grew mid-single digits for the third consecutive quarter, and APAC ex-China rose almost 20%.
- Q3 organic growth is expected to mirror Q2 when excluding cell therapy and OEM timing headwinds, with underlying mid-single-digit growth; full-year operating margin expansion of 100 bps remains on track.
- Strategic growth verticals (cell therapy, proteomic instruments, spatial biology, diagnostics) now represent 47% of revenue (vs. 32% in FY2020) with an upper-teens CAGR; M&A remains a priority, including the pending Wilson Wolf acquisition (20% stake, closing by end of 2027).
- Revenue flat at $295.9 M, with reported and organic growth flat YoY; excluding FDA Fast Track cell therapy timing headwinds, organic growth was 4%.
- Adjusted EPS of $0.46 (up 10% YoY) and adjusted operating margin of 31.1% (up 100 bps).
- Generated $82.4 M in operating cash flow, invested $5.9 M in capex, ending with $172.9 M cash and a leverage ratio below 1× EBITDA.
- Segment highlights: Protein Sciences revenue rose 2% to $215.1 M; Diagnostics & Spatial Biology sales were $81.2 M (–4% reported, +3% organic), with segment margin improving to 10.4%.
- Q3 outlook: organic growth expected to be consistent with Q2, with underlying mid-single-digit growth excluding cell therapy and OEM timing headwinds.
- Bio-Techne reported total Q2 revenue of $295.9 million, flat y/y, with 4% organic growth excluding timing impacts from two large cell therapy customers.
- Adjusted operating margin widened 100 bps y/y to 31.1%, driven by productivity and cost management; adjusted EPS increased 10% to $0.46.
- Large pharma revenues rose low double digits; emerging biotech declined mid-single digits; U.S. academic end market down low single digits; China sales grew mid-single digits, APAC excluding China up ~20%.
- Protein Sciences segment organic sales fell 1% (reported +2%), but grew 4% excluding cell therapy timing; Diagnostics & Spatial Biology segment achieved 3% organic growth after divestiture impacts.
- Q3 organic growth is expected to remain in line with Q2, with underlying (ex-cell therapy/OEM headwinds) growth of mid-single digits; full-year operating margin expansion of 100 bps reiterated.
- Revenue was flat year-over-year at $295.9 million in Q2 FY2026.
- GAAP EPS of $0.24 rose from $0.22 a year ago; adjusted EPS improved to $0.46 from $0.42.
- Adjusted operating margin expanded by 100 bps to 31.1%, while GAAP operating margin increased to 18.4% from 16.0% in Q2 FY2025.
- By segment, Protein Sciences net sales grew 2% to $215.1 million, and Diagnostics & Spatial Biology revenue declined 4% to $81.2 million (organic +3%).
Quarterly earnings call transcripts for BIO-TECHNE.
Ask Fintool AI Agent
Get instant answers from SEC filings, earnings calls & more