Earnings summaries and quarterly performance for UNITEDHEALTH GROUP.
Executive leadership at UNITEDHEALTH GROUP.
Board of directors at UNITEDHEALTH GROUP.
Research analysts who have asked questions during UNITEDHEALTH GROUP earnings calls.
Justin Lake
Wolfe Research, LLC
9 questions for UNH
Lisa Gill
JPMorgan Chase & Co.
8 questions for UNH
Lance Wilkes
Sanford C. Bernstein & Co., LLC
7 questions for UNH
Erin Wright
Morgan Stanley
6 questions for UNH
Scott Fidel
Stephens Inc.
6 questions for UNH
Andrew Mok
Barclays
5 questions for UNH
Ann Hynes
Mizuho Financial Group
5 questions for UNH
Joshua Raskin
Nephron Research
5 questions for UNH
Kevin Fischbeck
Bank of America
5 questions for UNH
A.J. Rice
UBS
4 questions for UNH
Albert Rice
UBS
4 questions for UNH
Josh Raskin
Nathron Research
4 questions for UNH
Sarah James
Cantor Fitzgerald
4 questions for UNH
Stephen Baxter
Wells Fargo
4 questions for UNH
Stephen Baxter
Wells Fargo & Company
4 questions for UNH
David Windley
Jefferies Financial Group Inc.
3 questions for UNH
Jessica Tassan
Piper Sandler
3 questions for UNH
Joanna Gajuk
Bank of America
3 questions for UNH
Dave Windley
Jefferies LLC
2 questions for UNH
George Hill
Deutsche Bank
2 questions for UNH
Whit Mayo
Leerink Partners
2 questions for UNH
A.J. Rice
UBS Group AG
1 question for UNH
Benjamin Hendrix
RBC Capital Markets
1 question for UNH
Jessica Tasan
Piper Sandler Companies
1 question for UNH
Matthew Gillmor
KeyCorp
1 question for UNH
Recent press releases and 8-K filings for UNH.
- The S&P 500 closed at a record high for a fifth straight day, led by mega-cap tech stocks, with the Nasdaq near recent highs and the S&P approaching 7,000.
- UnitedHealth shares dropped sharply after the Trump administration proposed raising Medicare Advantage payments by only 0.09% for 2027, well below investor expectations, triggering the insurer selloff.
- UnitedHealth warned it expects 2026 revenue to decline, marking its first annual contraction in over three decades.
- The insurer rout erased roughly $100 billion in market value across UnitedHealth and peers including Humana and CVS.
- Outside of tech, UPS rallied on higher 2026 revenue guidance, FedEx gained, and General Motors jumped on stronger fourth-quarter core profit.
- FY 2025 adjusted EPS of $16.35, slightly ahead of expectations, and revenues of $448 billion (+12% YoY); results include a $1.6 billion net-of-tax non-cash charge.
- 2026 outlook: adjusted EPS > $17.75 (+8.6%), revenues ~$440 billion, medical care ratio 88.8% ± 50 bps, operating cost ratio 12.8% ± 50 bps, and cash flow ≥ $18 billion (1.1× net income).
- UnitedHealthcare expects Medicare Advantage membership contraction of 1.3–1.4 million (margin +50 bps), Medicaid membership contraction of 565–715 thousand, and total commercial membership decline of 2.3–2.8 million, driving ~40 bps margin expansion.
- Optum segment guidance for 2026: Optum Rx margins +20 bps; Optum Insight earnings > 4% with +90 bps margin; Optum Health earnings +9% with +30 bps margin expansion.
- Targeted $1 billion in AI-enabled operating cost reductions in 2026 and planned $1.5 billion investment in intelligent technologies, alongside enhanced transparency and independent oversight.
- UnitedHealth delivered adjusted EPS of $16.35 in 2025 and revenues of ~$448 billion (+12%), with a medical care ratio of 89.1%, operating cost ratio of 13.3%, and operating cash flow of $19.7 billion (1.5× net income).
- For 2026, the company forecasts adjusted EPS >$17.75 (+8.6%), net EPS ≥$17.10, revenues of ~$440 billion, operating cash flow ≥$18 billion (1.1× net income), a medical care ratio of ~88.8%±50 bps, and an operating cost ratio of ~12.8%±50 bps.
- UnitedHealthcare expects Medicare Advantage membership to contract by 1.3–1.4 million, Medicaid membership by 565k–715k, and overall commercial membership by 2.3–2.8 million, supporting ~13% UHC adjusted operating earnings growth and ~40 bps margin expansion.
- Optum segment guidance includes 20 bps margin expansion at Optum Rx from >800 new customer wins; >4% earnings growth and 90 bps margin expansion at Optum Insight; and ~9% growth with 30 bps margin expansion at Optum Health, alongside realignment of Optum Financial under Optum Insight.
- Full-year 2025 results exclude a $1.6 billion net-of-tax, largely non-cash charge (including $625 million in Optum lost contract reserves).
- UnitedHealth Group delivered full-year 2025 adjusted EPS of $16.35 and revenues of $448 billion (+12% y/y), reflecting a $1.6 billion net-of-tax non-cash charge
- The company expects 2026 adjusted EPS > $17.75 (≥ 8.6% growth), revenues of ~$440 billion, a medical care ratio of 88.8% ± 50 bps, and an operating cost ratio of 12.8% ± 50 bps, with slightly under two-thirds of earnings in H1
- In UnitedHealthcare, repricing actions will drive Medicare Advantage membership contraction of 1.3–1.4 million with ~50 bps margin improvement, and Medicaid membership contraction of 565–715 thousand
- Optum segments are forecast to deliver low-to-high single-digit adjusted earnings growth with margin expansions of +20 bps at Optum Rx, +90 bps at Optum Insight, and +30 bps at Optum Health, supported by AI integration and value-based care strategies
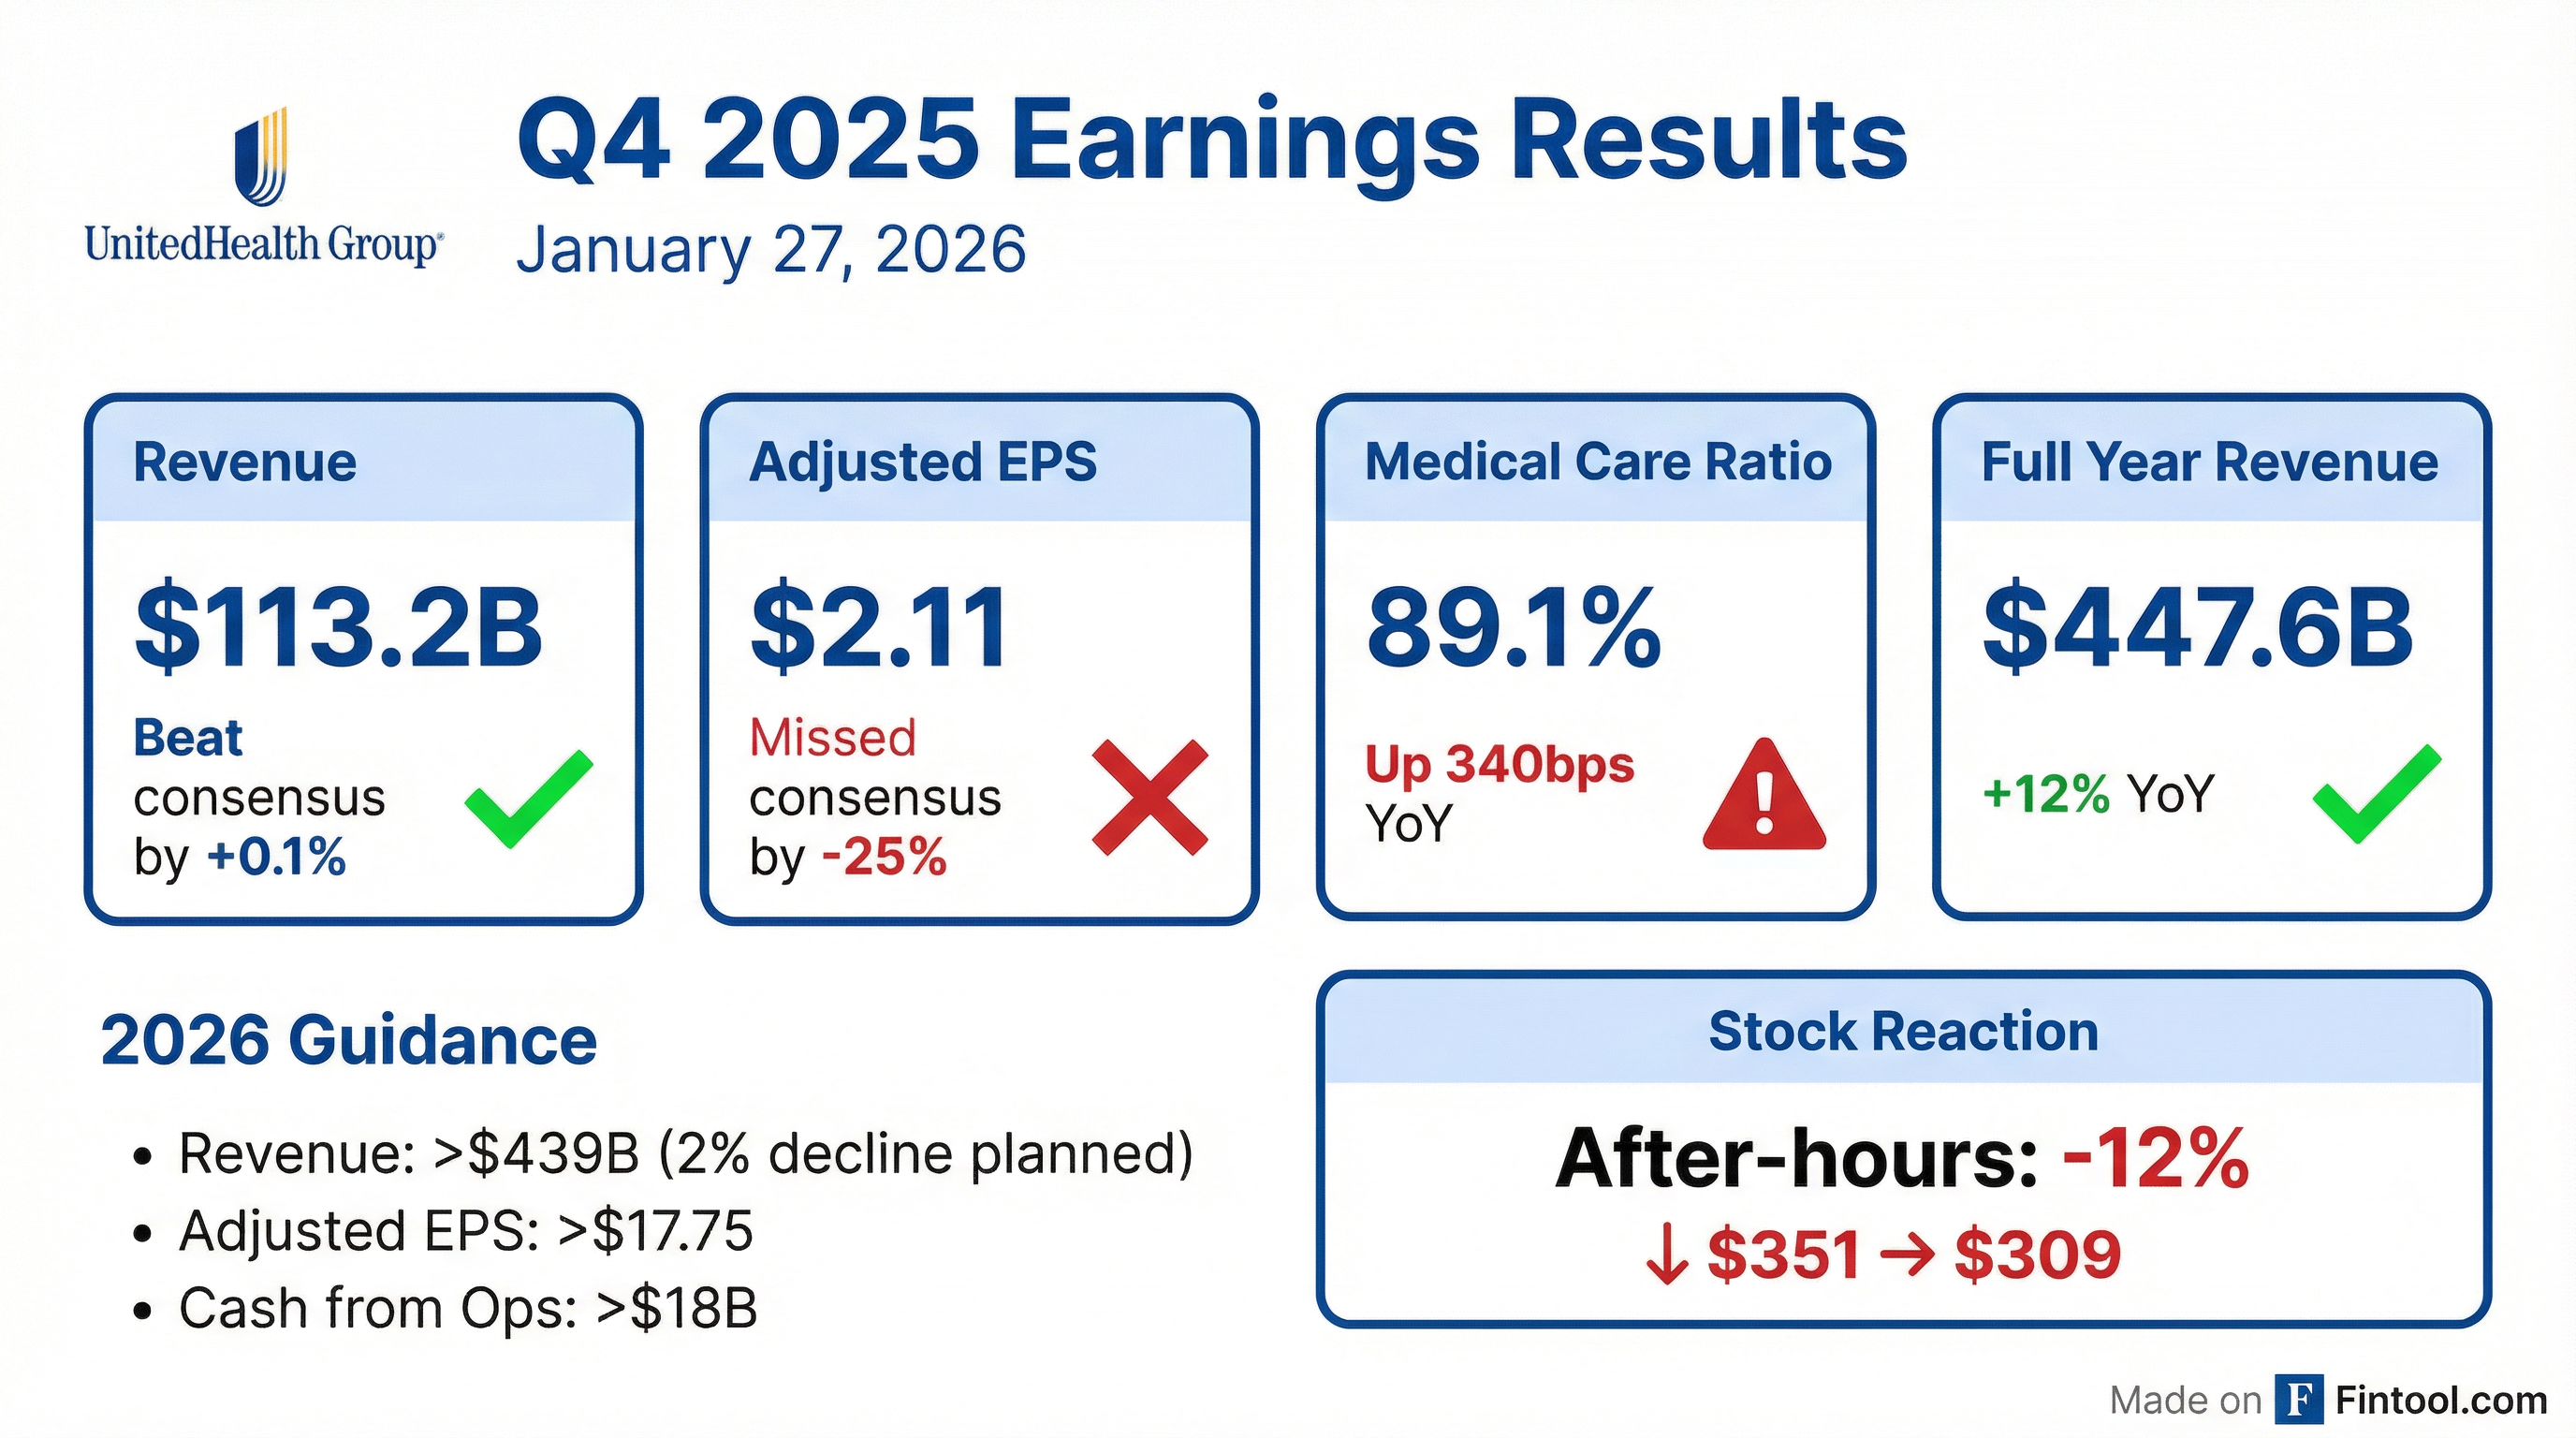
- UnitedHealth Group posted $447.6 bn in full-year 2025 revenue, a 12% increase YoY, with GAAP EPS of $13.23 and adjusted EPS of $16.35 per share.
- Q4 2025 revenue was $113.2 bn, with GAAP EPS of $0.01 and adjusted EPS of $2.11, reflecting a $1.6 bn net charge ($1.78 per share) for cyberattack remediation, divestitures and restructuring.
- Segment results for 2025 included $344.9 bn in UnitedHealthcare revenues (+16%) and $270.6 bn in Optum revenues (+7%).
- 2026 outlook assumes revenue exceeding $439.0 bn, earnings from operations over $24.0 bn, GAAP EPS > $17.10 and adjusted EPS > $17.75.
- Full-year 2025 revenues were $447.6 billion, up 12% year-over-year; net earnings per share were $13.23, with adjusted EPS of $16.35.
- UnitedHealthcare revenues grew 16% to $344.9 billion, while Optum revenues increased 7% to $270.6 billion in 2025.
- Issued 2026 guidance calling for revenues above $439.0 billion, earnings from operations over $24.0 billion, and adjusted EPS above $17.75.
- Outlook anticipates a net margin of ~3.6%, cash flows from operations exceeding $18.0 billion, and modest membership declines in key segments.
- UnitedHealth shares fell 19.1% intraday to $284.37, marking its largest one-day percentage drop since April 17, 2025 and trading more than 50% below its November 2024 closing high.
- The decline followed weaker-than-expected Q4 revenue and underwhelming guidance, alongside CMS’s proposed 0.09% increase in Medicare Advantage payment rates.
- UnitedHealth was the second-worst performer in the S&P 500 and removed roughly 350–414 Dow points, making it the primary driver of the Dow’s early 500-point slide.
- Other major health insurers, notably Humana, also saw substantial declines, highlighting sector-wide profitability concerns amid a heavy earnings calendar.
- New Medicare pilot requiring prior authorization for 17 procedures for 6.4 million traditional Medicare beneficiaries in six states, raising concerns over delays and administrative burdens.
- CMS proposed a 0.09% increase in 2027 Medicare Advantage payments, far below expectations and medical inflation, effectively a funding cut that blindsided insurers led by UnitedHealth.
- UnitedHealth reported $19 billion in full-year 2025 earnings, a 41% year-over-year decline, and Q4 2025 GAAP EPS of about $0.01 due to restructuring and cyberattack costs, with revenue roughly in line with estimates.
- Executives warned the low rate increase threatens seniors’ benefits and access, pledging to press CMS for higher rates, while the outlook fueled a historic single-day stock drop.
- MA costs federal government 9% less than traditional Medicare in 2025, at $1,117 vs $1,234 per member per month, saving ~$117 monthly or over $1,400 annually.
- Managed care structure delivers $63 billion in additional annual value to enrollees through lower cost sharing, reduced premiums, and enhanced supplemental benefits.
- Average non-dual eligible aged-in MA-PD beneficiary spent 53% less ($3,651 vs $7,790) on total health care in 2025 compared to traditional Medicare with a PDP and Medigap Plan G.
- Phase-in of CMS’s V28 risk model led to a 4% reduction in MA revenue compared to the V24 model.
- A U.S. Senate Judiciary staff report found UnitedHealth Group used aggressive strategies, supported by enhanced staffing and AI, to capture diagnoses that raise Medicare Advantage payments.
- The findings add to longstanding allegations from watchdogs and whistleblowers that Advantage plans exaggerate patient illness, following a probe by Sen. Chuck Grassley after Wall Street Journal reporting.
- The report stops short of formal recommendations or allegations of legal wrongdoing, and UnitedHealth did not immediately comment.
- News of the report sent shares down 1.4%–3.1% in premarket trading, touching $339.42.
Fintool News
In-depth analysis and coverage of UNITEDHEALTH GROUP.

UnitedHealth CEO Hemsley Made Private Bets on Healthcare Startups Through Investment Firm

Death Penalty Dismissed Against Luigi Mangione as UNH Stock Languishes 53% Below Pre-Shooting Levels

Medicare Rate Shock Wipes $80 Billion From Health Insurers in Single Day

Trump's CMS Proposes Flat Medicare Advantage Rates, Insurers Plunge Up to 13%

Medicare Advantage Rate Shock: Insurers Plunge 10-14% After CMS Proposes Near-Zero Increase

Senate Report: UnitedHealth Used 'Aggressive Strategies' to Maximize Medicare Payments
Quarterly earnings call transcripts for UNITEDHEALTH GROUP.
Ask Fintool AI Agent
Get instant answers from SEC filings, earnings calls & more