Costco Digital Sales Surge 34% in January as Non-Foods Drive 7.1% Comp Growth
February 4, 2026 · by Fintool Agent
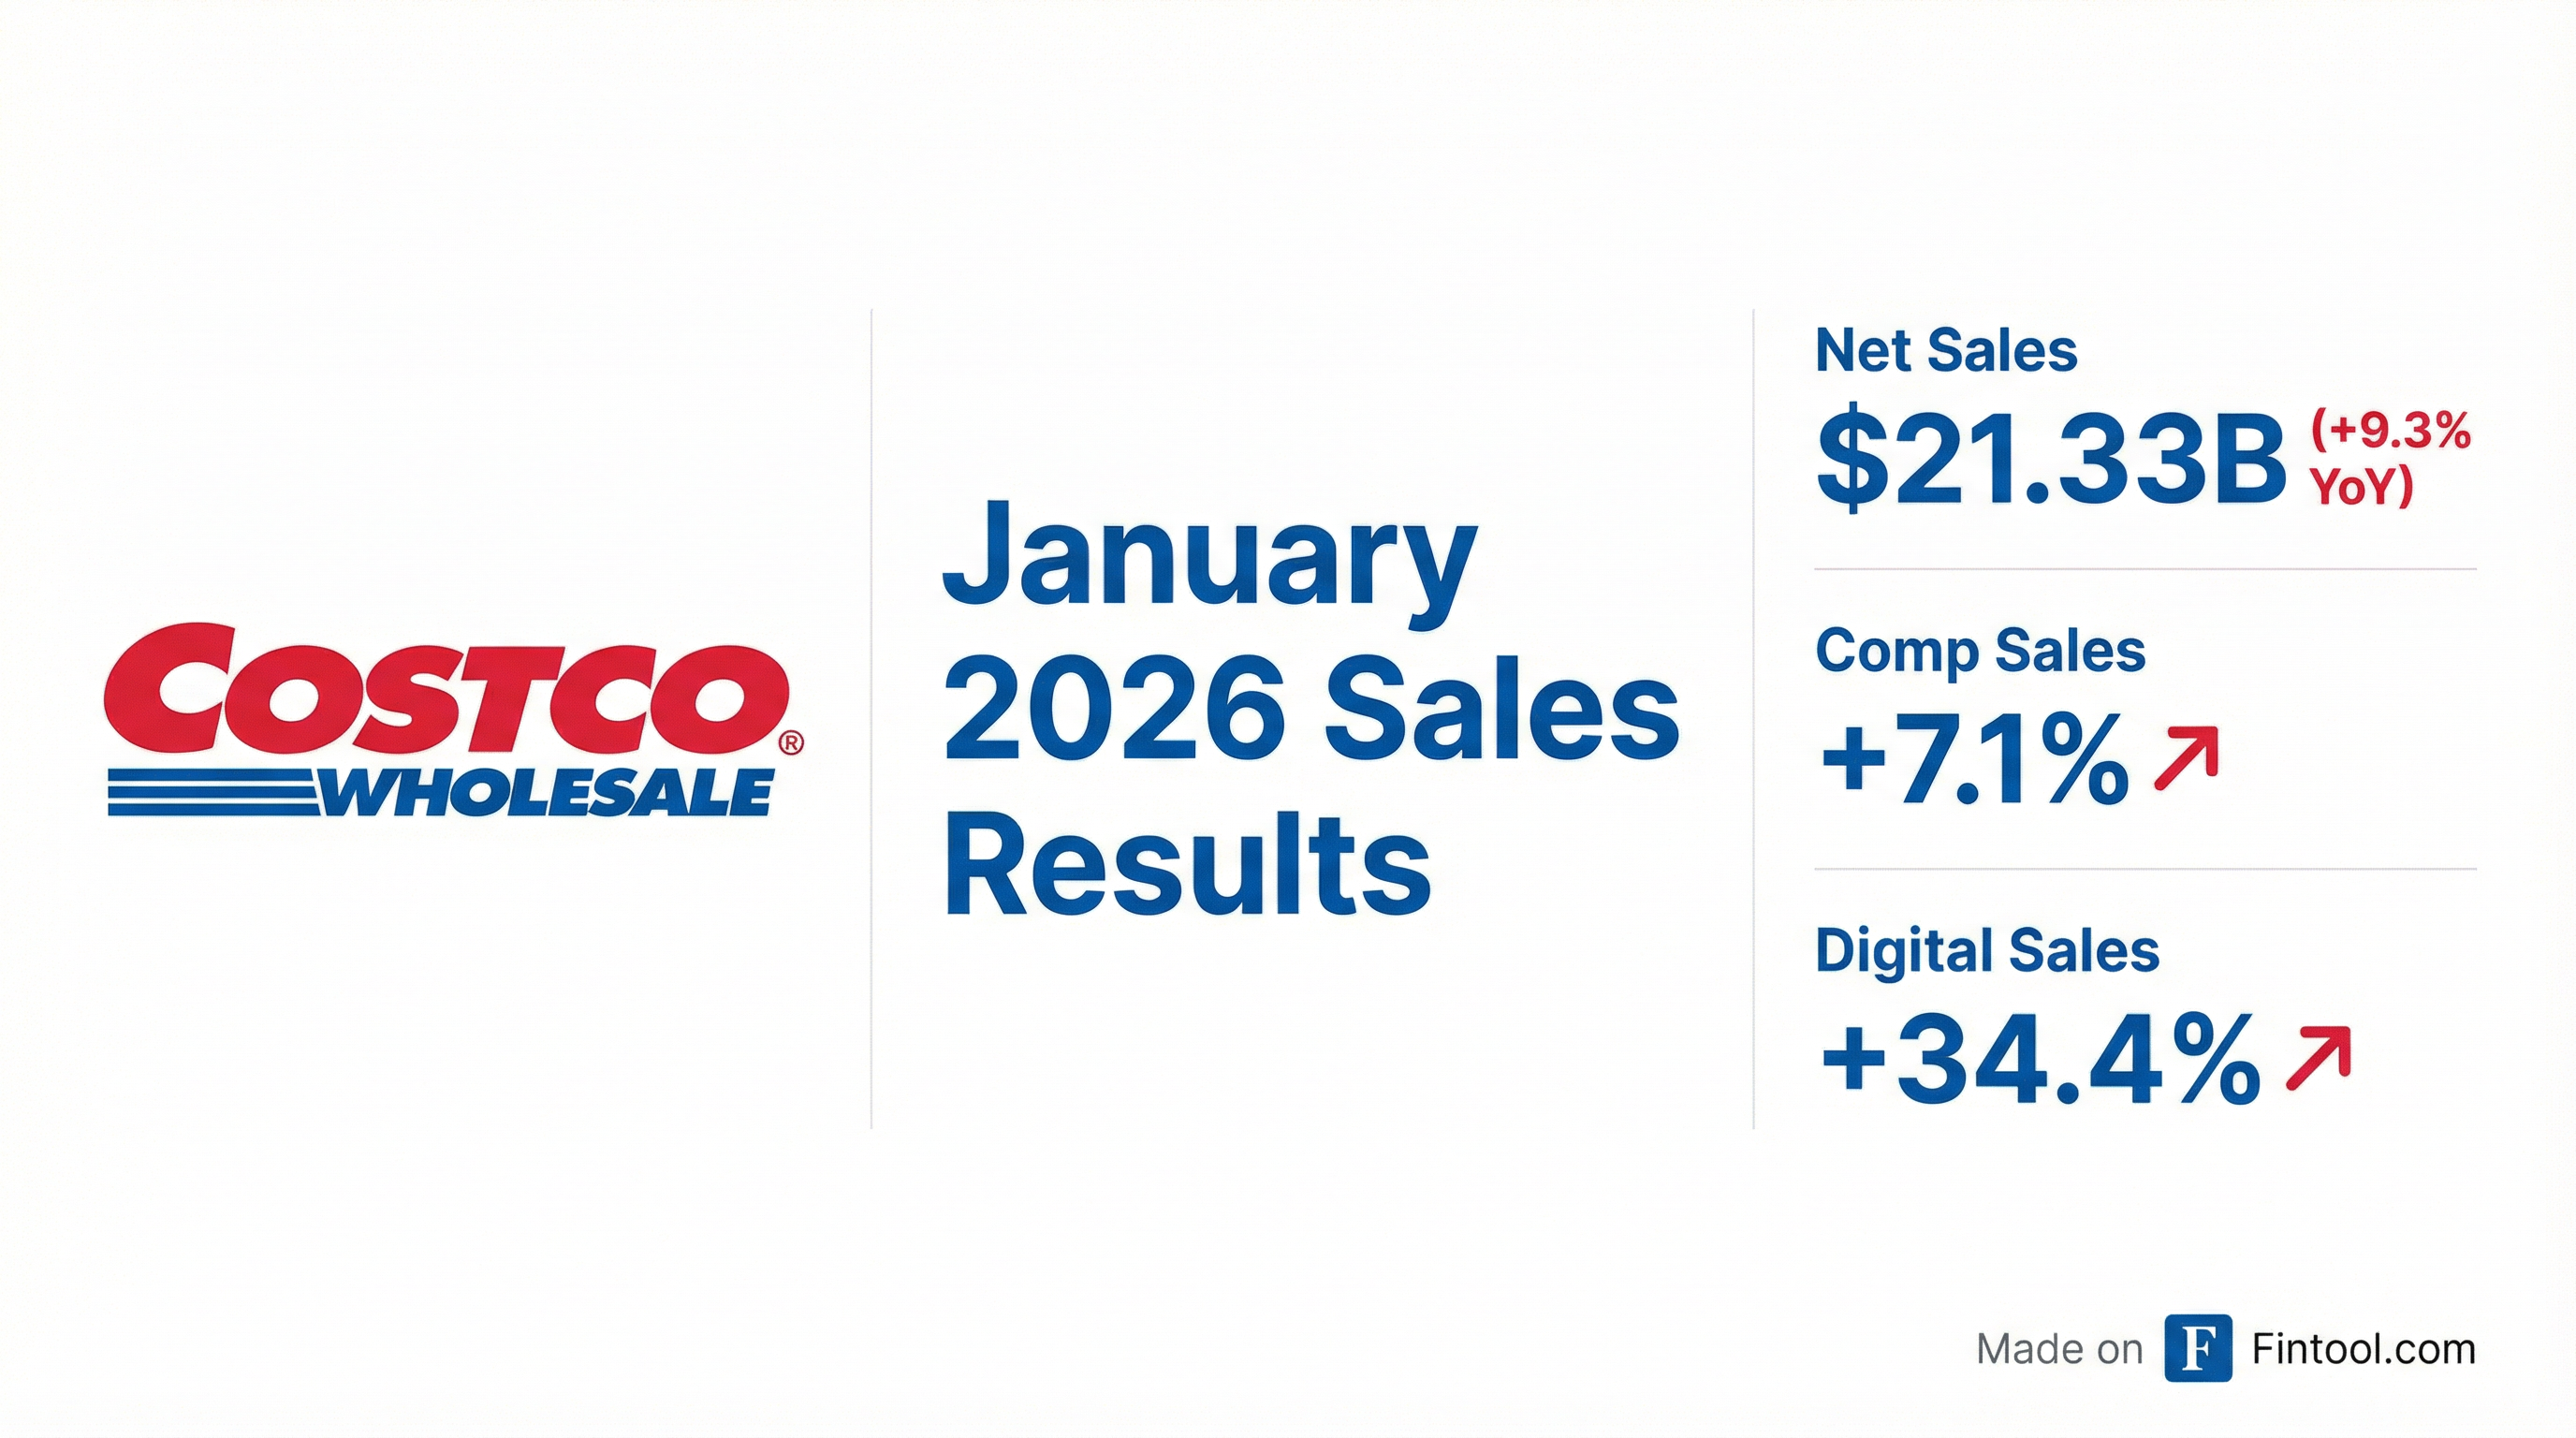
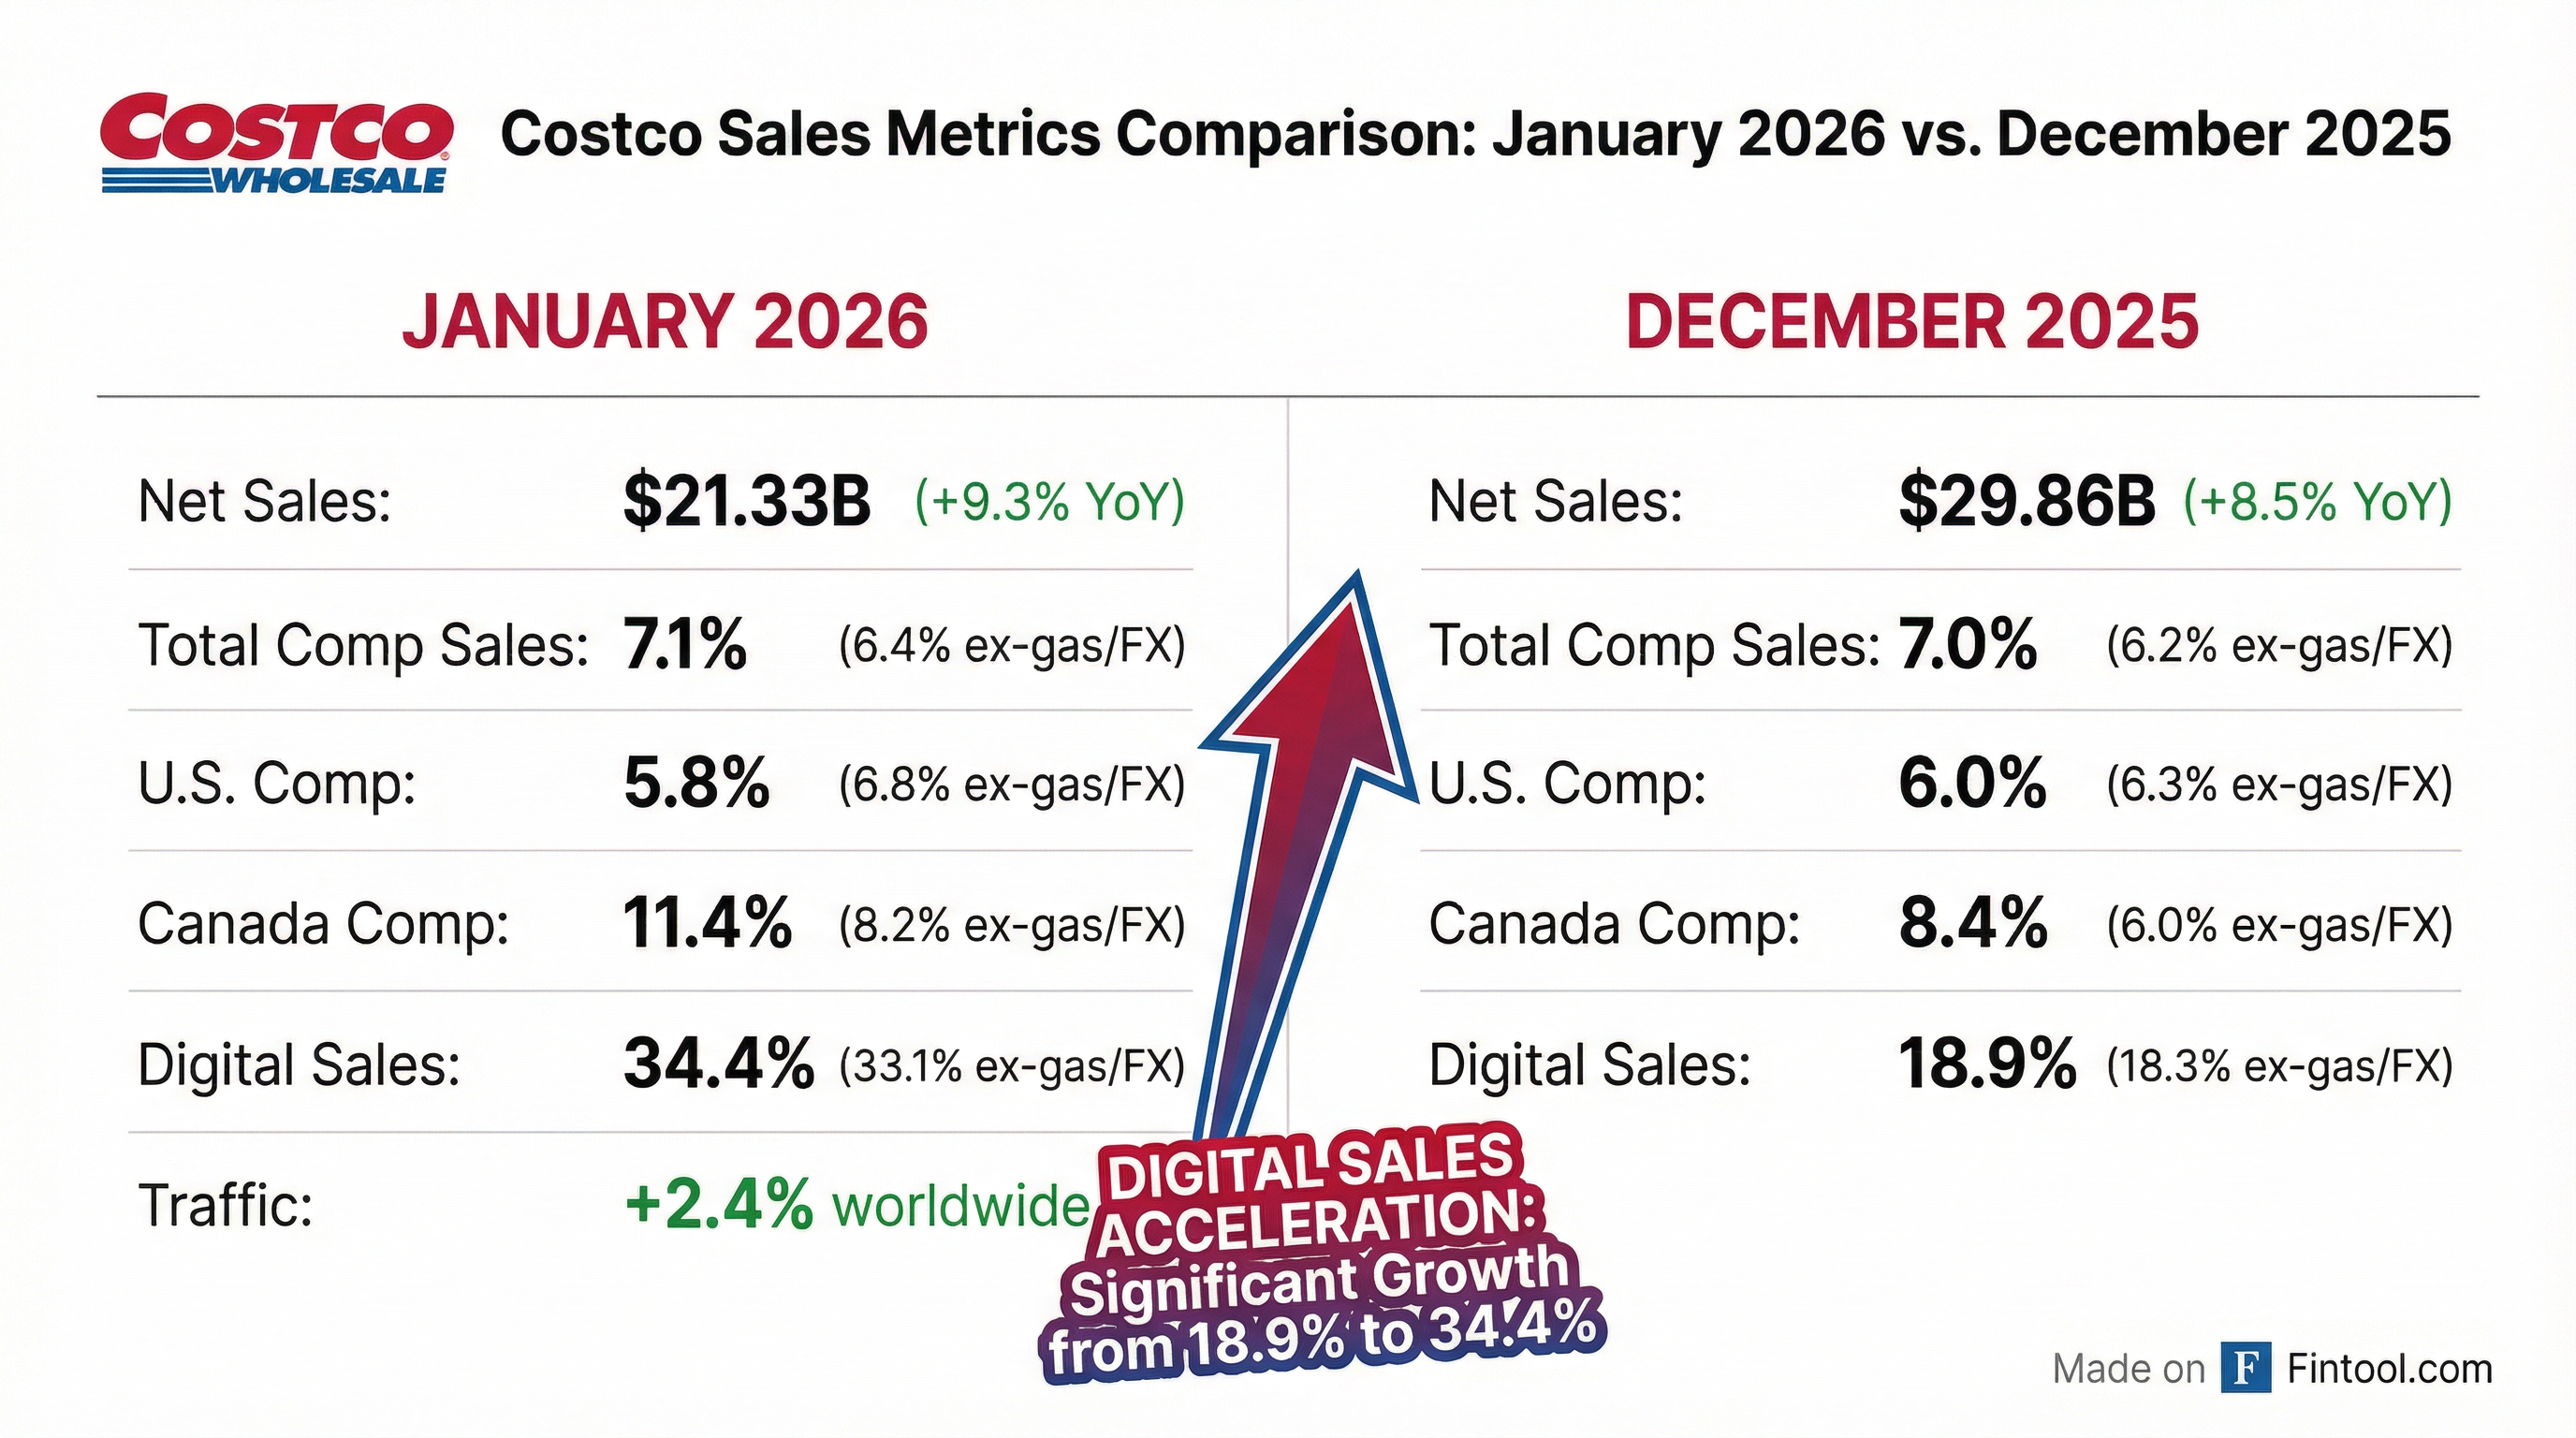
Costco's e-commerce engine shifted into high gear in January, with digitally enabled sales surging 34.4%—nearly double December's 18.9% pace—as the warehouse giant posted another month of steady mid-single-digit comparable sales growth.
Net sales for the four-week retail month ending February 1 reached $21.33 billion, up 9.3% year-over-year from $19.51 billion in the prior-year period. Total company comparable sales rose 7.1%, or 6.4% when excluding the impacts of gasoline price deflation and foreign exchange.
The results, disclosed in Costco's pre-recorded investor relations call featuring Director of Finance Andrew Youn, underscore the retailer's consistent execution even as the company navigates calendar shifts and currency headwinds.
The Digital Acceleration Story
The headline number is the digital surge. January's 33.1% adjusted digital growth (excluding FX) represents a dramatic acceleration from the prior month:
| Metric | January 2026 | December 2025 | Change |
|---|---|---|---|
| Digital Comp (Reported) | 34.4% | 18.9% | +15.5pp |
| Digital Comp (Ex-FX) | 33.1% | 18.3% | +14.8pp |
This marks the strongest digital growth since Q1 FY2026, when the company reported 20.5% digitally enabled comp growth. The reacceleration suggests Costco's investments in e-commerce fulfillment and its revamped app experience are gaining traction with members.
Regional Performance: Canada Stands Out
Canada emerged as the standout region, posting 11.4% comparable sales growth (8.2% excluding gas and FX)—the strongest among Costco's major markets.
| Region | Comp Sales | Adjusted (Ex-Gas/FX) |
|---|---|---|
| U.S. | 5.8% | 6.8% |
| Canada | 11.4% | 8.2% |
| Other International | 9.5% | 2.7% |
| Total Company | 7.1% | 6.4% |
The stark difference between reported and adjusted international comps (9.5% vs 2.7%) reflects significant foreign currency tailwinds, with FX positively impacting international sales by approximately 7.6%.
A timing quirk dampened international results: Lunar and Chinese New Year falls on February 17 this year, 19 days later than last year. This shift negatively impacted other international and total company sales by approximately 4% and 0.5%, respectively.
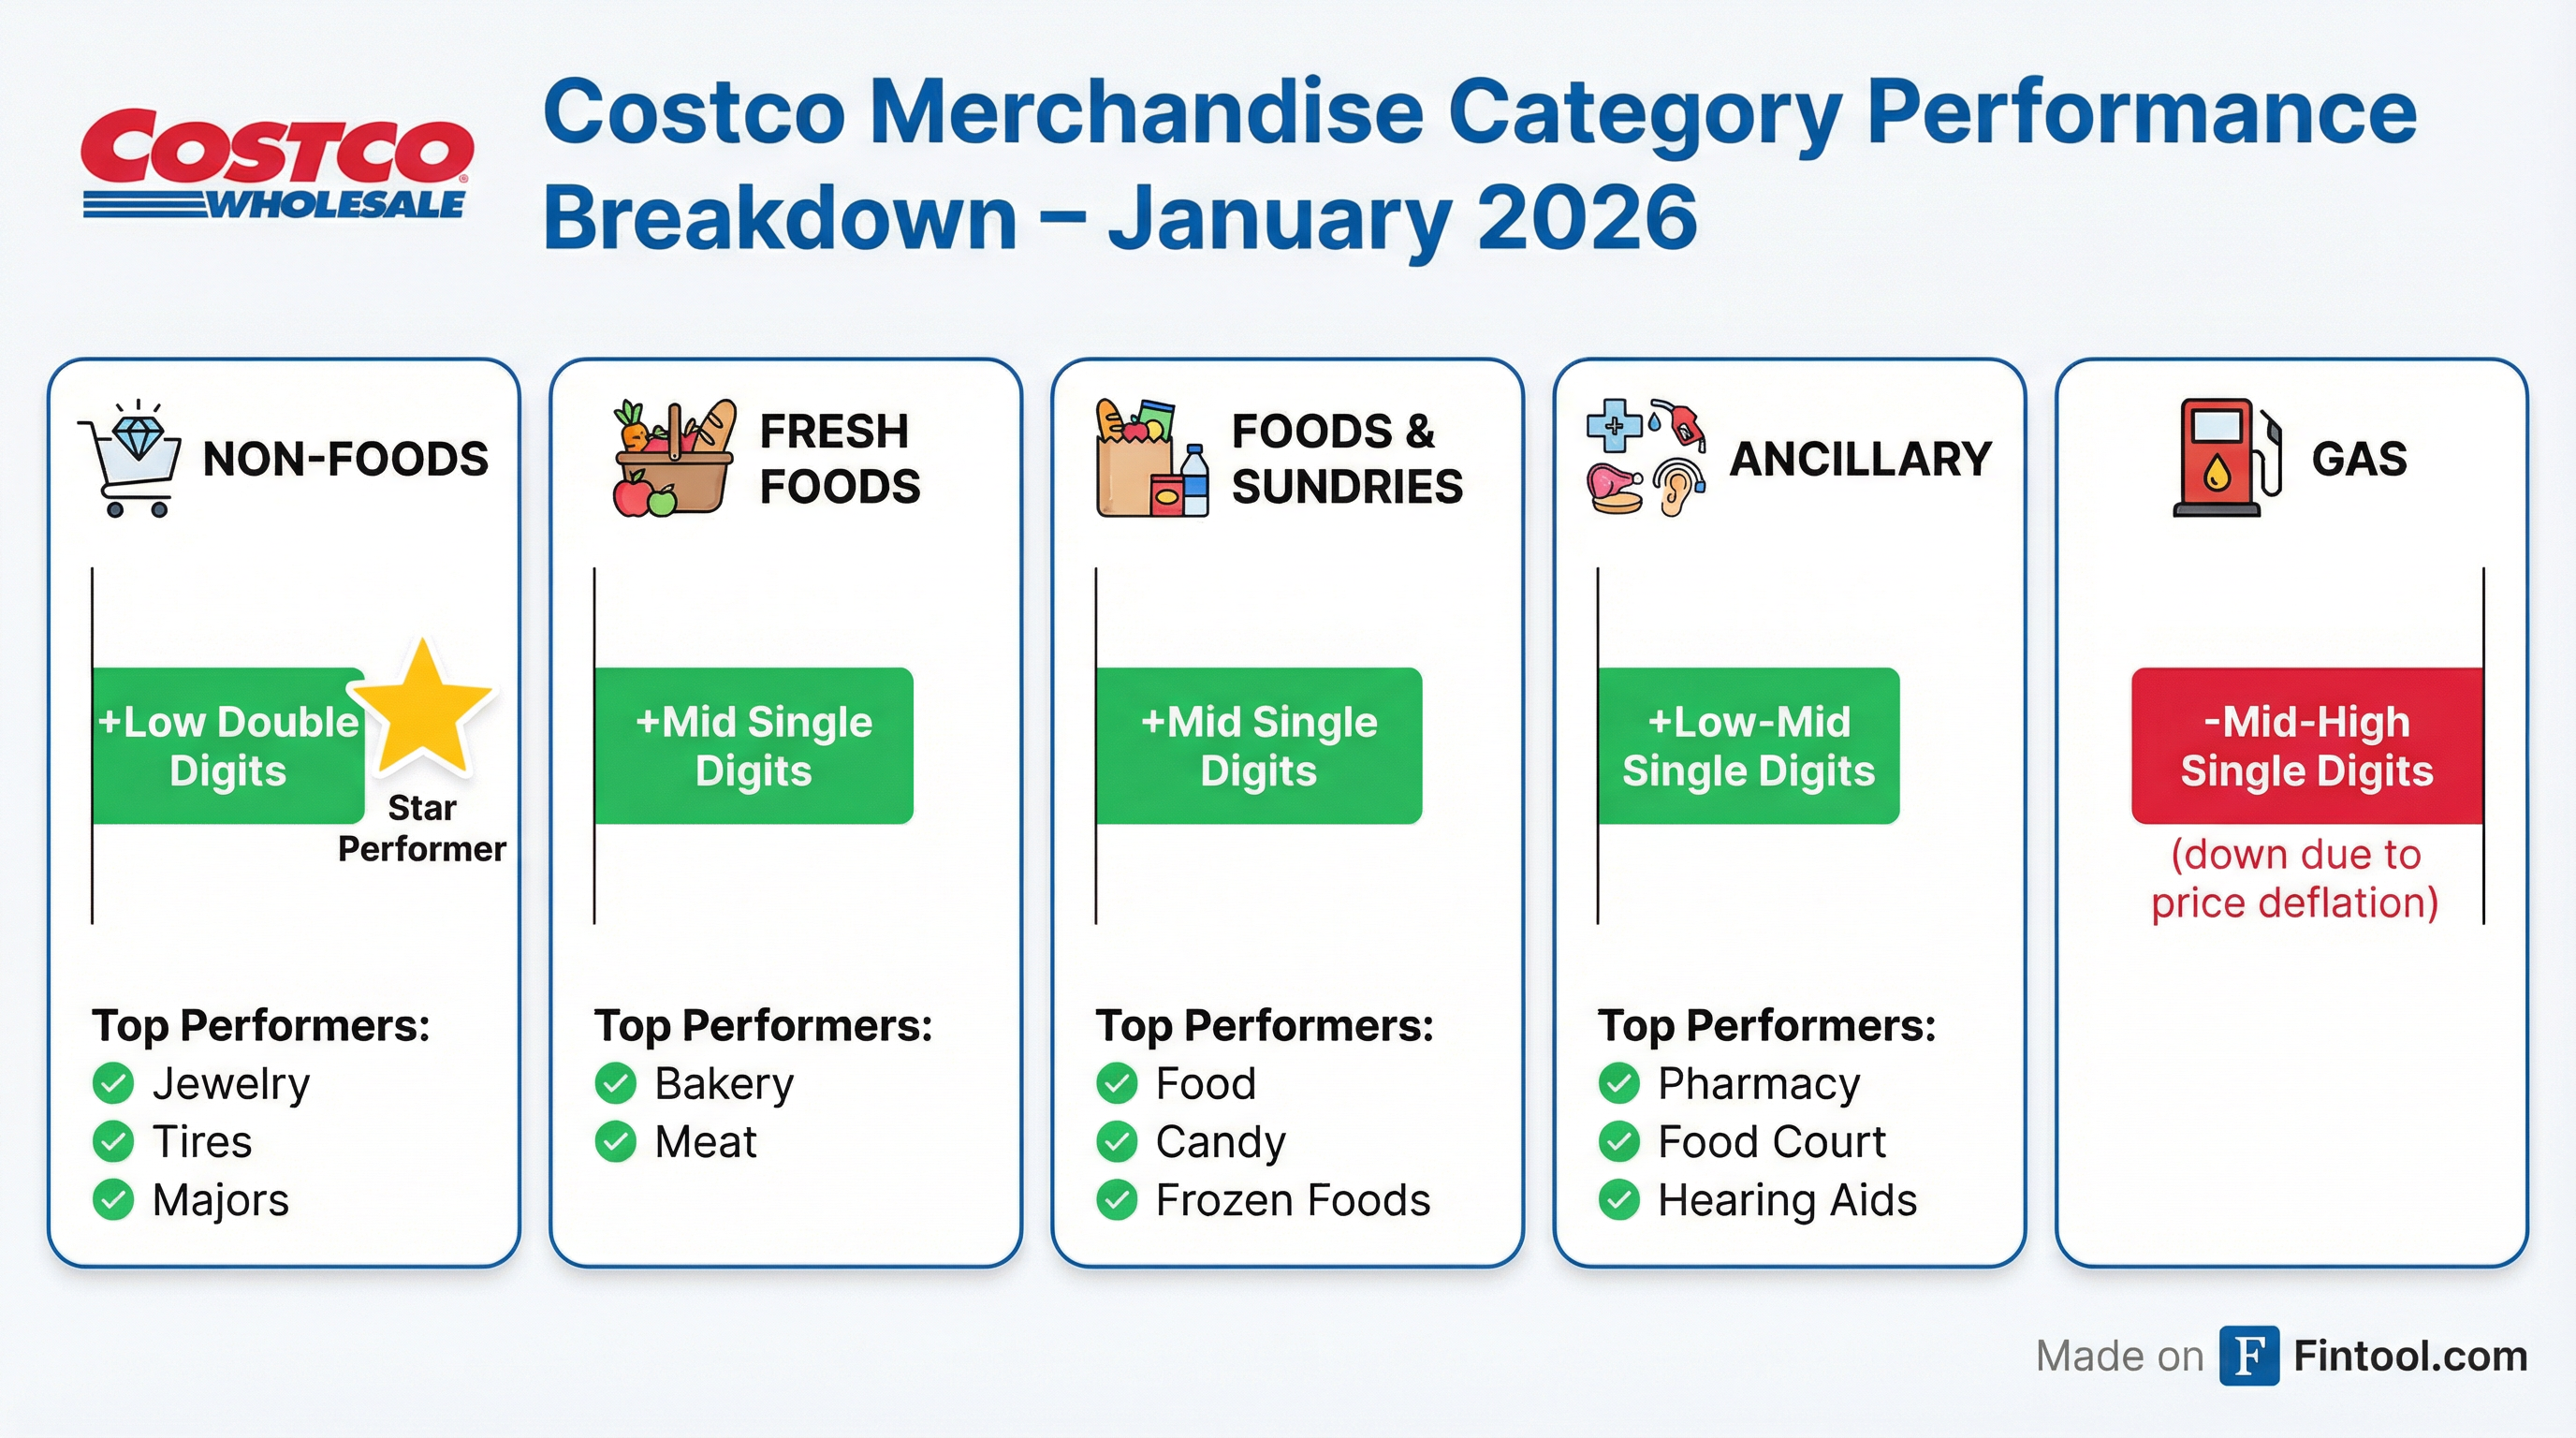
Non-Foods Powers the Mix
The merchandise breakdown reveals where consumer spending is flowing. Non-foods categories delivered low double-digit comparable sales growth, with jewelry, tires, and major appliances leading the charge.
| Category | Growth | Top Performers |
|---|---|---|
| Non-Foods | Low double-digits | Jewelry, Tires, Majors |
| Fresh Foods | Mid-single-digits | Bakery, Meat |
| Foods & Sundries | Mid-single-digits | Food, Candy, Frozen Foods |
| Ancillary | Low-to-mid single-digits | Pharmacy, Food Court, Hearing Aids |
| Gas | -Mid-to-high single-digits | (Price deflation impact) |
The non-foods strength is notable given the discretionary nature of these categories. Jewelry and major appliances typically correlate with consumer confidence, suggesting Costco's affluent member base remains healthy.
Gas sales continued to be a drag, with the average worldwide selling price per gallon down 9.6% versus last year, negatively impacting total reported comp sales by approximately 100 basis points.
Traffic Trends Remain Healthy
Foot traffic continues to tell a positive story. Comp traffic increased 2.4% worldwide and 2.2% in the U.S. for the month, while the average transaction rose 4.6% (3.9% excluding gas deflation and FX).
This traffic/ticket split is constructive—it shows both more frequent visits and larger basket sizes, rather than growth driven purely by inflation-driven ticket increases.
Regional strength in the U.S. was concentrated in the Midwest, Southeast, and Texas, while internationally, Australia, the United Kingdom, and Mexico outperformed.
The negative impact of cannibalization (new stores taking sales from existing locations) was approximately 60 basis points for the total company, consistent with recent quarters.
Financial Context
Costco enters Q2 FY2026 with solid momentum. The company's Q1 results (twelve weeks ended November 23, 2025) showed:
| Metric | Q1 FY2026 | Q4 FY2025 | Q3 FY2025 | Q2 FY2025 |
|---|---|---|---|---|
| Revenue | $67.3B | $86.2B | $63.2B | $63.7B |
| Net Income | $2.0B | $2.6B | $1.9B | $1.8B |
| Gross Margin | 13.1%* | 12.9%* | 13.0%* | 12.5%* |
*Values retrieved from S&P Global
Analyst consensus expects Q2 FY2026 revenue of $69.0 billion with EPS of $4.51, implying continued mid-single-digit growth. For the full fiscal year 2026, the Street models revenue approaching $310 billion.
Stock Reaction and Valuation
Costco shares closed Tuesday's session at $978.35, essentially flat (+0.04%) on the day. After-hours trading saw the stock tick higher to $988.60, up about 1% as investors processed the digital acceleration.
The stock has climbed roughly 13% year-to-date through late January, significantly outpacing the S&P 500's 1.5% gain. However, that performance has pushed valuation to demanding levels:
- P/E Ratio: ~53x trailing earnings
- Forward P/E: ~49x consensus estimates
- Market Cap: $434 billion
As one analyst noted, "The stock's valuation simply doesn't leave any room for a soft patch in the company's growth story."
What to Watch
February Sales Report: The next monthly update will cover the four weeks from February 2 through March 1, 2026, compared against February 3 through March 2, 2025. The Lunar New Year timing shift that hurt January international will provide a tailwind in February.
Q2 FY2026 Earnings: Costco typically reports fiscal Q2 results in early March. Key questions for the call:
- Is the digital acceleration sustainable or a one-month anomaly?
- How is the company thinking about tariff risk on imported merchandise?
- Update on Executive membership upgrade rates and renewal trends
Warehouse Expansion: Costco currently operates 923 warehouses globally, including 633 in the U.S. and Puerto Rico. The company has signaled plans to open 30+ new locations annually.
The Bottom Line
January's results reinforce what investors have come to expect from Costco: steady, consistent execution with mid-single-digit comparable sales growth. The digital surge is the notable development—if sustained, it addresses one of the few bear case arguments (that Costco is losing ground to e-commerce competitors).
At 53x earnings, the market is pricing in continued excellence. January's numbers don't disappoint, but they also don't dramatically exceed the high bar already set. For a stock trading at these multiples, that's what maintaining position looks like.