Earnings summaries and quarterly performance for ESAB.
Executive leadership at ESAB.
Shyam Kambeyanda
President and Chief Executive Officer
Curtis Jewell
Senior Vice President, General Counsel and Corporate Secretary
Eleanor Lukens
President, Americas
Kevin Johnson
Executive Vice President, Chief Financial Officer
Olivier Biebuyck
President, Fabrication Technology
Board of directors at ESAB.
Research analysts who have asked questions during ESAB earnings calls.
Mircea Dobre
Robert W. Baird & Co.
7 questions for ESAB
Bryan Blair
Oppenheimer
6 questions for ESAB
Tami Zakaria
JPMorgan Chase & Co.
6 questions for ESAB
David Raso
Evercore ISI
5 questions for ESAB
Neal Burk
UBS Group AG
5 questions for ESAB
Adam Farley
Stifel Financial Corp.
4 questions for ESAB
Christopher Dankert
Loop Capital Markets
4 questions for ESAB
Nathan Jones
Stifel, Nicolaus & Company, Incorporated
2 questions for ESAB
Nathan Jones
Stifel
1 question for ESAB
Saree Boroditsky
Jefferies
1 question for ESAB
Sherif El-Sabbahy
Bank of America
1 question for ESAB
Recent press releases and 8-K filings for ESAB.
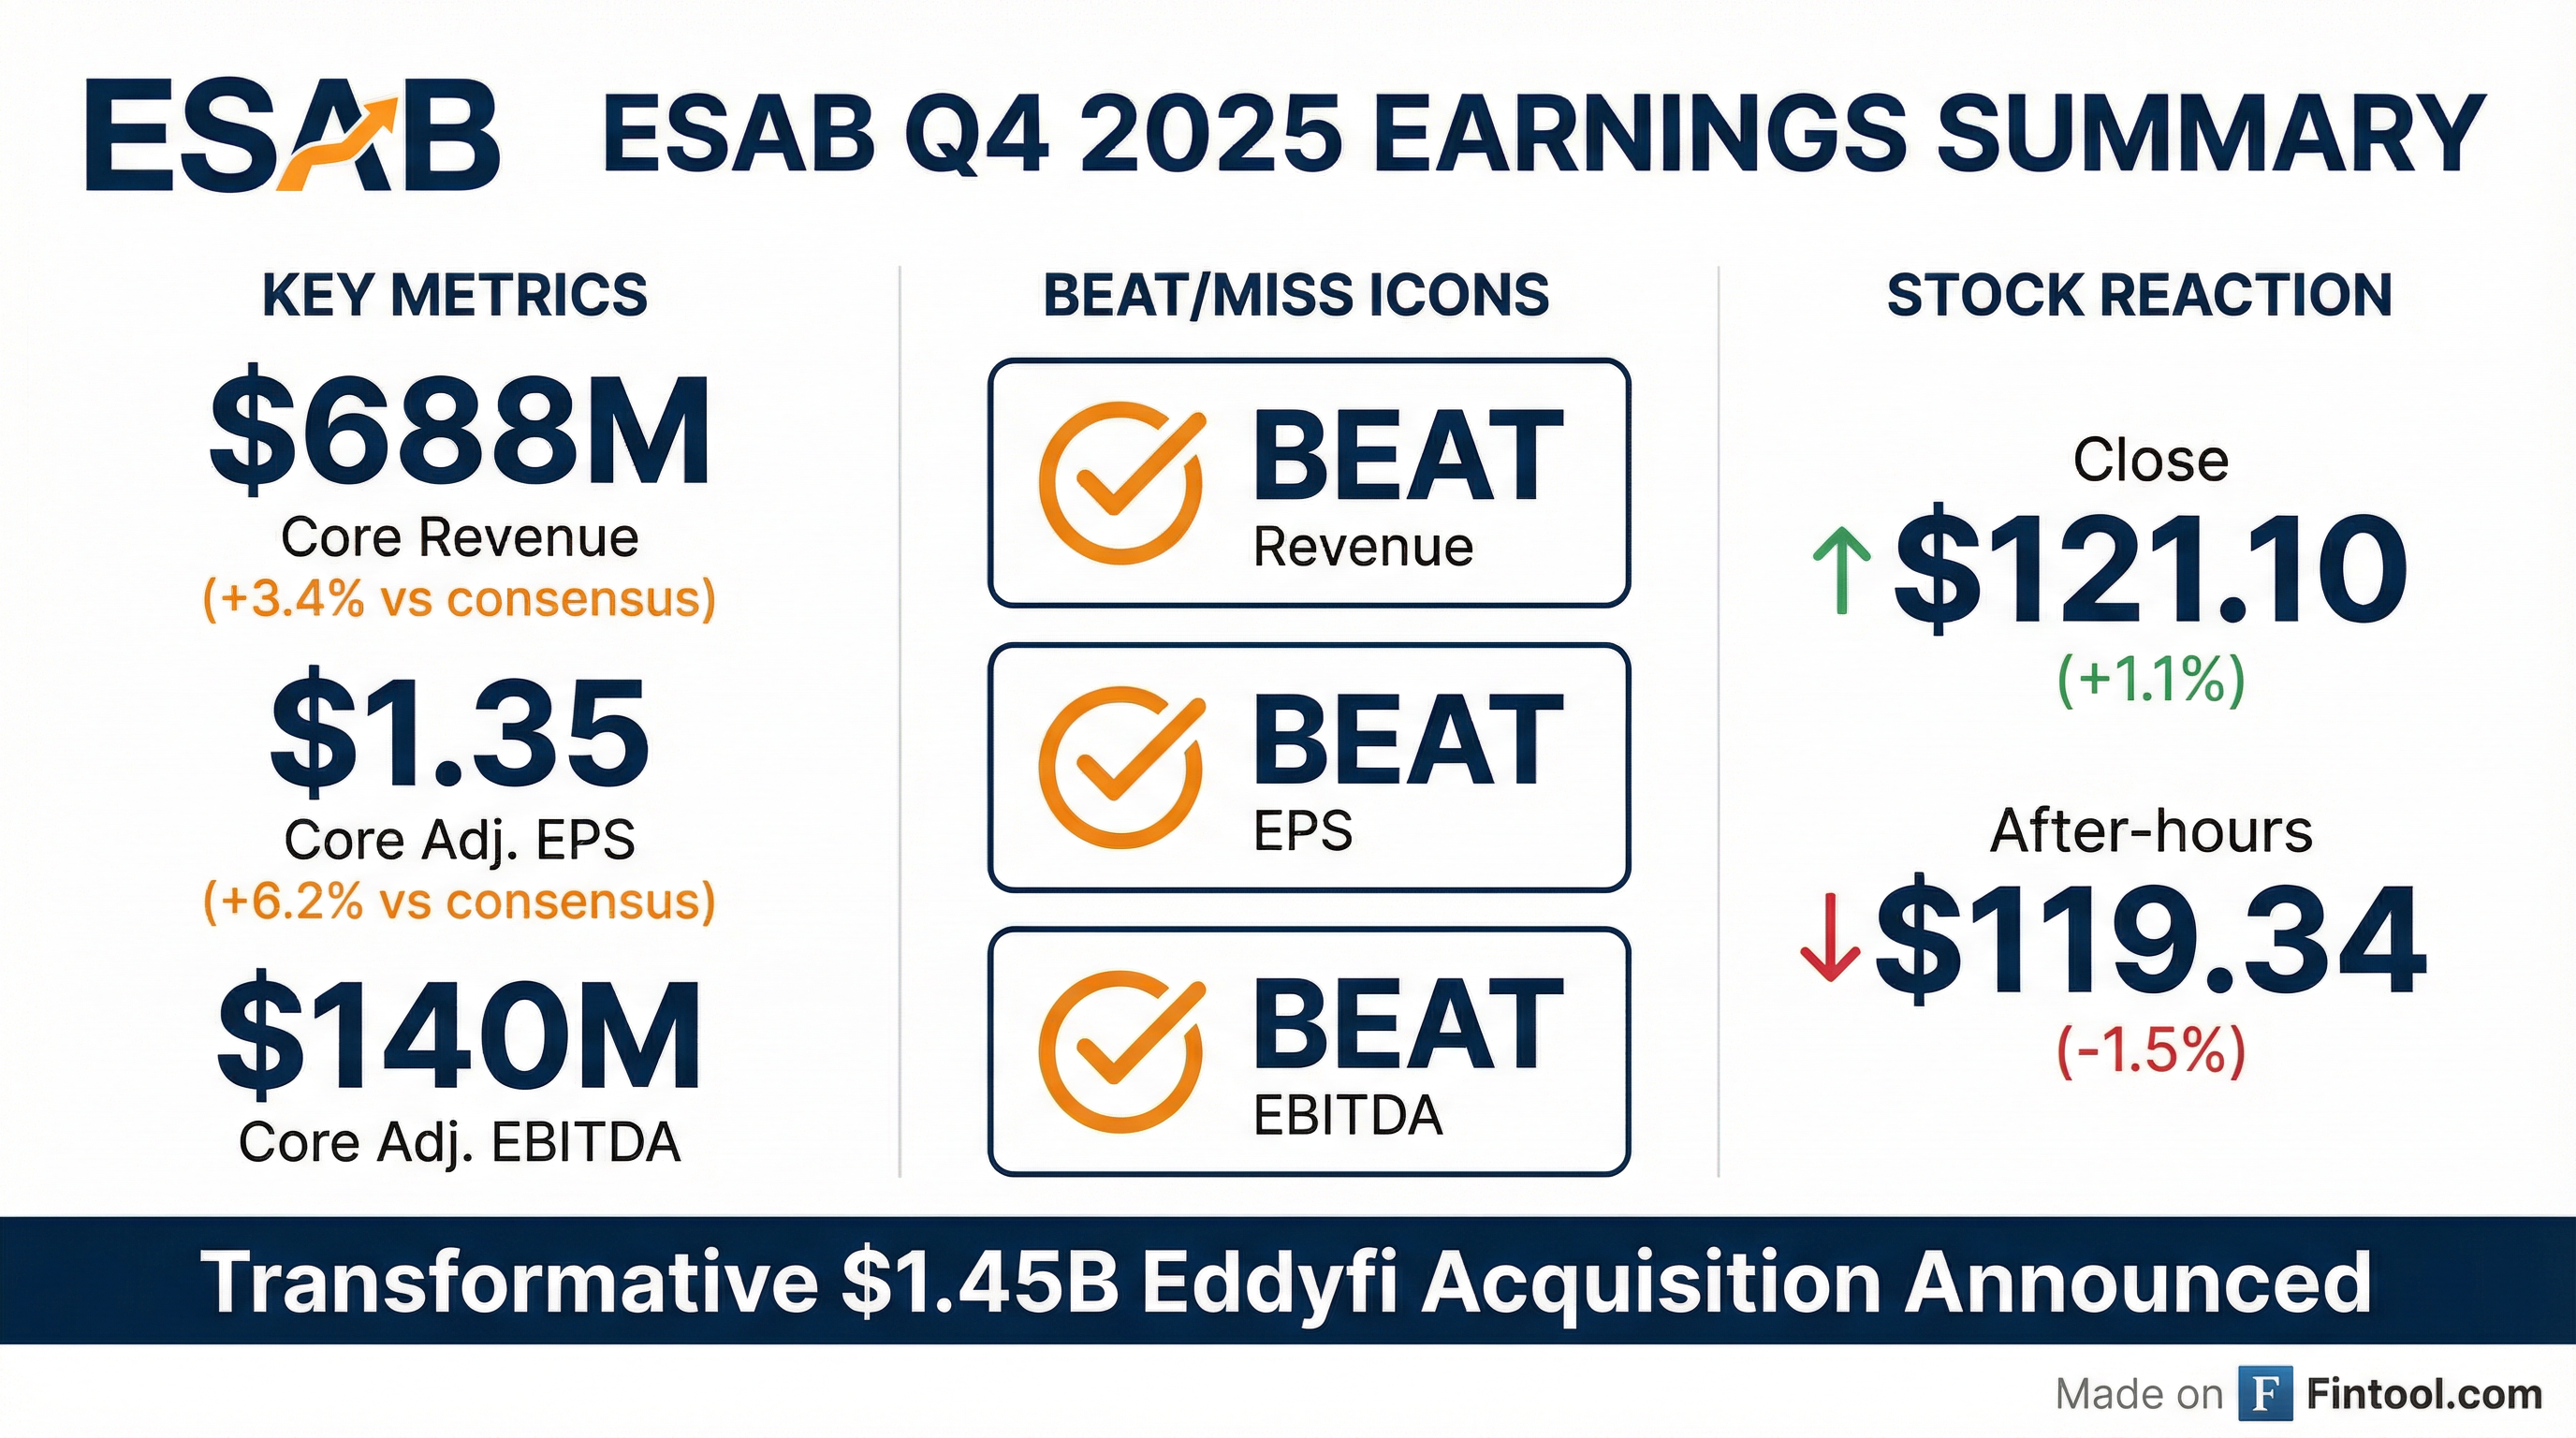
- ESAB announced the acquisition of Eddyfi Holdings, a global leader in inspection & monitoring technologies, for a total enterprise value of $1.45 billion, with the transaction expected to close in mid-2026.
- The Eddyfi acquisition is projected to add ~$270 million to 2026E revenue and contribute to ~30%+ 2026E adjusted EBITDA margin for Eddyfi, with ~$20 million in cost synergies.
- For Q4 2025, ESAB reported sales of $687 - $689 million and adjusted EBITDA of $139 - $141 million, with an adjusted EBITDA margin of 20.2 - 20.5%.
- Full Year 2025 results included sales of ~$2.70 billion, adjusted EBITDA of $539 - $541 million, and adjusted EPS of $5.25 - $5.27.
- ESAB provided 2026 guidance (excluding Eddyfi) with sales expected between $2.85 - $2.95 billion, organic growth of 2.0% - 4.0%, adjusted EBITDA of $575 - $595 million, and adjusted EPS of $5.70 - $5.90.
- ESAB Corporation announced the acquisition of Eddyfi Technologies for $1.45 billion, cash-free and debt-free, valuing Eddyfi at 14.5x 2026 earnings including $20 million in run rate synergies.
- Eddyfi is projected to contribute approximately $270 million in 2026 revenue with an EBITDA margin over 30%. The acquisition is expected to be EPS accretive in 2027, with some dilution in 2026, but will be margin accretive.
- The acquisition expands ESAB's total addressable market by approximately $5 billion, bringing its total TAM to roughly $45 billion, and is expected to drive faster growth, higher margins, and lower cyclicality for ESAB.
- Funding for the acquisition will come from cash in hand, debt, and $318 million in privately placed securities, consisting of $175 million in mandatory convertible preferred and $143 million in common equity. Net leverage is expected to be in the low 3x at closing and below 3x by year-end.
- ESAB's 2026 outlook, excluding Eddyfi, anticipates 2%-4% organic growth and adjusted EBITDA between $575 million-$595 million, with flat organic growth projected for Q1 2026.
- ESAB Corporation has signed a definitive agreement to acquire Eddyfi Technologies for $1.45 billion, cash-free and debt-free.
- The acquisition is expected to add approximately $270 million in 2026 revenue with an EBITDA margin over 30% for Eddyfi.
- Funding for the acquisition will include cash in hand, debt, and $318 million in privately placed securities, comprising $175 million of mandatory convertible preferred and $143 million of common equity.
- The deal is projected to expand ESAB's total addressable market by approximately $5 billion and is expected to be EPS accretive in 2027, with $20 million in run rate synergies identified.
- On a pro forma basis, ESAB expects 2025 revenue of approximately $3 billion and EBITDA margins of around 21%, with net leverage in the low 3x at closing and dropping below 3x by year-end.
- ESAB Corporation announced the acquisition of Eddyfi Holdings, a global leader in inspection and monitoring technologies, with an expected closing in mid-2026.
- The transaction has a Total Enterprise Value (TEV) of $1.45 billion and will be funded with cash on hand, debt, and $318 million of MCPS and common equity.
- Eddyfi is projected to contribute ~$270 million in 2026E Sales and a ~30%+ 2026E aEBITDA margin.
- The acquisition is anticipated to be accretive to ESAB's core growth (+50 bps impact in 2027E+) and aEBITDA margins (+200 bps impact in 2027E+), while expanding ESAB's Total Addressable Market (TAM) by $5 billion and generating ~$20 million in cost synergies.
- ESAB Corporation has signed a definitive agreement to acquire Eddyfi Technologies for $1.45 billion, cash-free and debt-free. Eddyfi is projected to generate $270 million in 2026 revenue with an EBITDA margin over 30%.
- The acquisition will be funded by a combination of cash, debt, and $318 million in privately placed securities, which includes $175 million of mandatory convertible preferred and $143 million of common equity.
- This acquisition is expected to expand ESAB's total addressable market by approximately $5 billion, bringing its total TAM to roughly $45 billion, and is anticipated to generate $20 million in run rate synergies.
- The deal is expected to be EPS dilutive in 2026 but EPS accretive in 2027. Net leverage is projected to be in the low 3x at closing and drop below 3x by year-end.
- ESAB Corporation has signed a definitive agreement to acquire Eddyfi Technologies for $1.45 billion, with the transaction expected to close in mid-2026. Eddyfi is projected to generate approximately $270 million in revenue and $80 million in adjusted EBITDA in 2026, or $100 million with expected annualized run-rate synergies.
- The acquisition is anticipated to expand ESAB's total addressable market by approximately $5 billion, creating a full workflow solution and strengthening its exposure to high-growth end markets. ESAB expects to unlock $20 million in synergies from the integration.
- Funding for the acquisition will include cash on hand, debt, and $318 million of fully committed equity. ESAB also offered and agreed to sell $175.0 million in mandatory convertible preferred stock and $142.985 million in common stock through private placements.
- For the fourth quarter of 2025, ESAB expects to report revenue in the range of $720 million to $722 million and Core diluted aEPS in the range of $1.34 to $1.36.
- For the full year 2025, ESAB anticipates revenue in the range of $2,842 million to $2,844 million and Core diluted aEPS in the range of $5.25 to $5.27.
- ESAB Corporation has signed a definitive agreement to acquire Eddyfi Technologies, a global leader in advanced inspection and monitoring technologies, for $1.45 billion. The transaction is expected to close in mid-2026.
- The acquisition will be funded through a combination of cash on hand, debt, and $318 million of fully committed equity.
- Eddyfi is projected to generate approximately $270 million of revenue and $80 million of adjusted EBITDA in 2026, with an additional $20 million in expected annualized run-rate synergies.
- This strategic acquisition is anticipated to expand ESAB's total addressable market by approximately $5 billion, accelerate its portfolio shift towards higher growth and margins, and result in a net leverage ratio of less than 3.0x by year end following the transaction.
- ESAB reported strong Q3 2025 results, with sales increasing 8.1% year-over-year to $727.8 million and adjusted earnings per share at $1.32, surpassing analyst estimates.
- The EWM acquisition contributed significantly to sales growth, adding 2 points to sales and $1 million to adjusted EBITDA, completing the heavy equipment and automation portfolio.
- Despite a 7% rise in core adjusted EBITDA to $133 million, operating margin declined to 14.6% from 15.7%, and free cash flow margin decreased from 13.4% to 9.6%.
- The company raised its full-year guidance for adjusted EPS and EBITDA, reflecting confidence in continued growth and margin expansion.
- ESAB reported Q3 2025 sales of $687 million and Core Organic Growth of +2%, with Adjusted EBITDA reaching $133 million and a 19.4% aEBITDA Margin.
- The company raised its full-year 2025 guidance, with projected sales now between $2.71-$2.73 billion and Adjusted EBITDA between $535-$540 million.
- The EWM acquisition was completed, contributing 2 points of growth and $1 million in aEBITDA in Q3 2025, and resulting in a net leverage of 2.1x.
- ESAB generated $86.4 million in Adjusted Free Cash Flow for Q3 2025, achieving a cash conversion of 107%.
- ESAB reported Q3 2025 sales of $687 million, an 8% increase year-over-year, with organic sales growing 2% and Adjusted EBITDA increasing 7% to $133 million.
- The company completed the acquisition of EWM earlier than anticipated, which contributed approximately 2 points of growth and $1 million in adjusted EBITDA to Q3 results. EWM is expected to contribute approximately $3 million to full-year Adjusted EBITDA.
- ESAB raised its full-year 2025 guidance, now expecting total sales of $2.71 to $2.73 billion, Adjusted EBITDA of $535 to $540 million, and Adjusted EPS of $5.20 to $5.30.
- The company is focused on shifting its mix towards equipment and gas control, aiming for 22% plus EBITDA margins by 2028 or sooner, and anticipates strong margin improvement in the Americas in 2026 due to ongoing restructuring and supply chain adjustments.
Fintool News
In-depth analysis and coverage of ESAB.

Quarterly earnings call transcripts for ESAB.
Ask Fintool AI Agent
Get instant answers from SEC filings, earnings calls & more