Earnings summaries and quarterly performance for Fortinet.
Executive leadership at Fortinet.
Board of directors at Fortinet.
Research analysts who have asked questions during Fortinet earnings calls.
Brian Essex
JPMorgan Chase & Co.
8 questions for FTNT
Gabriela Borges
Goldman Sachs
8 questions for FTNT
Saket Kalia
Barclays Capital
8 questions for FTNT
Shaul Eyal
TD Cowen
8 questions for FTNT
Junaid Siddiqui
Truist Securities
7 questions for FTNT
Fatima Boolani
Citi
6 questions for FTNT
Patrick Colville
Scotiabank
6 questions for FTNT
Rob Owens
Piper Sandler Companies
5 questions for FTNT
Shrenik Kothari
Robert W. Baird & Co.
5 questions for FTNT
Tal Liani
Bank of America
5 questions for FTNT
Adam Borg
Stifel Financial Corp.
4 questions for FTNT
Brad Zelnick
Credit Suisse
3 questions for FTNT
Eric Heath
KeyBanc Capital Markets
3 questions for FTNT
Gray Powell
BTIG
3 questions for FTNT
Ittai Kidron
Oppenheimer & Company
3 questions for FTNT
Robbie Owens
Piper Sandler
3 questions for FTNT
Joseph Gallo
Jefferies & Company Inc.
2 questions for FTNT
Keith Bachman
BMO Capital Markets
2 questions for FTNT
Meta Marshall
Morgan Stanley
2 questions for FTNT
Andrew Nowinski
Wells Fargo
1 question for FTNT
Catharine Trebnick
Rosenblatt Securities
1 question for FTNT
Hamza Fodderwala
Morgan Stanley
1 question for FTNT
Joe Andrew
Scotiabank
1 question for FTNT
Keith Weiss
Morgan Stanley
1 question for FTNT
Max S.
Stifel Financial Corp.
1 question for FTNT
Tomer Zilberman
Bank of America
1 question for FTNT
Recent press releases and 8-K filings for FTNT.
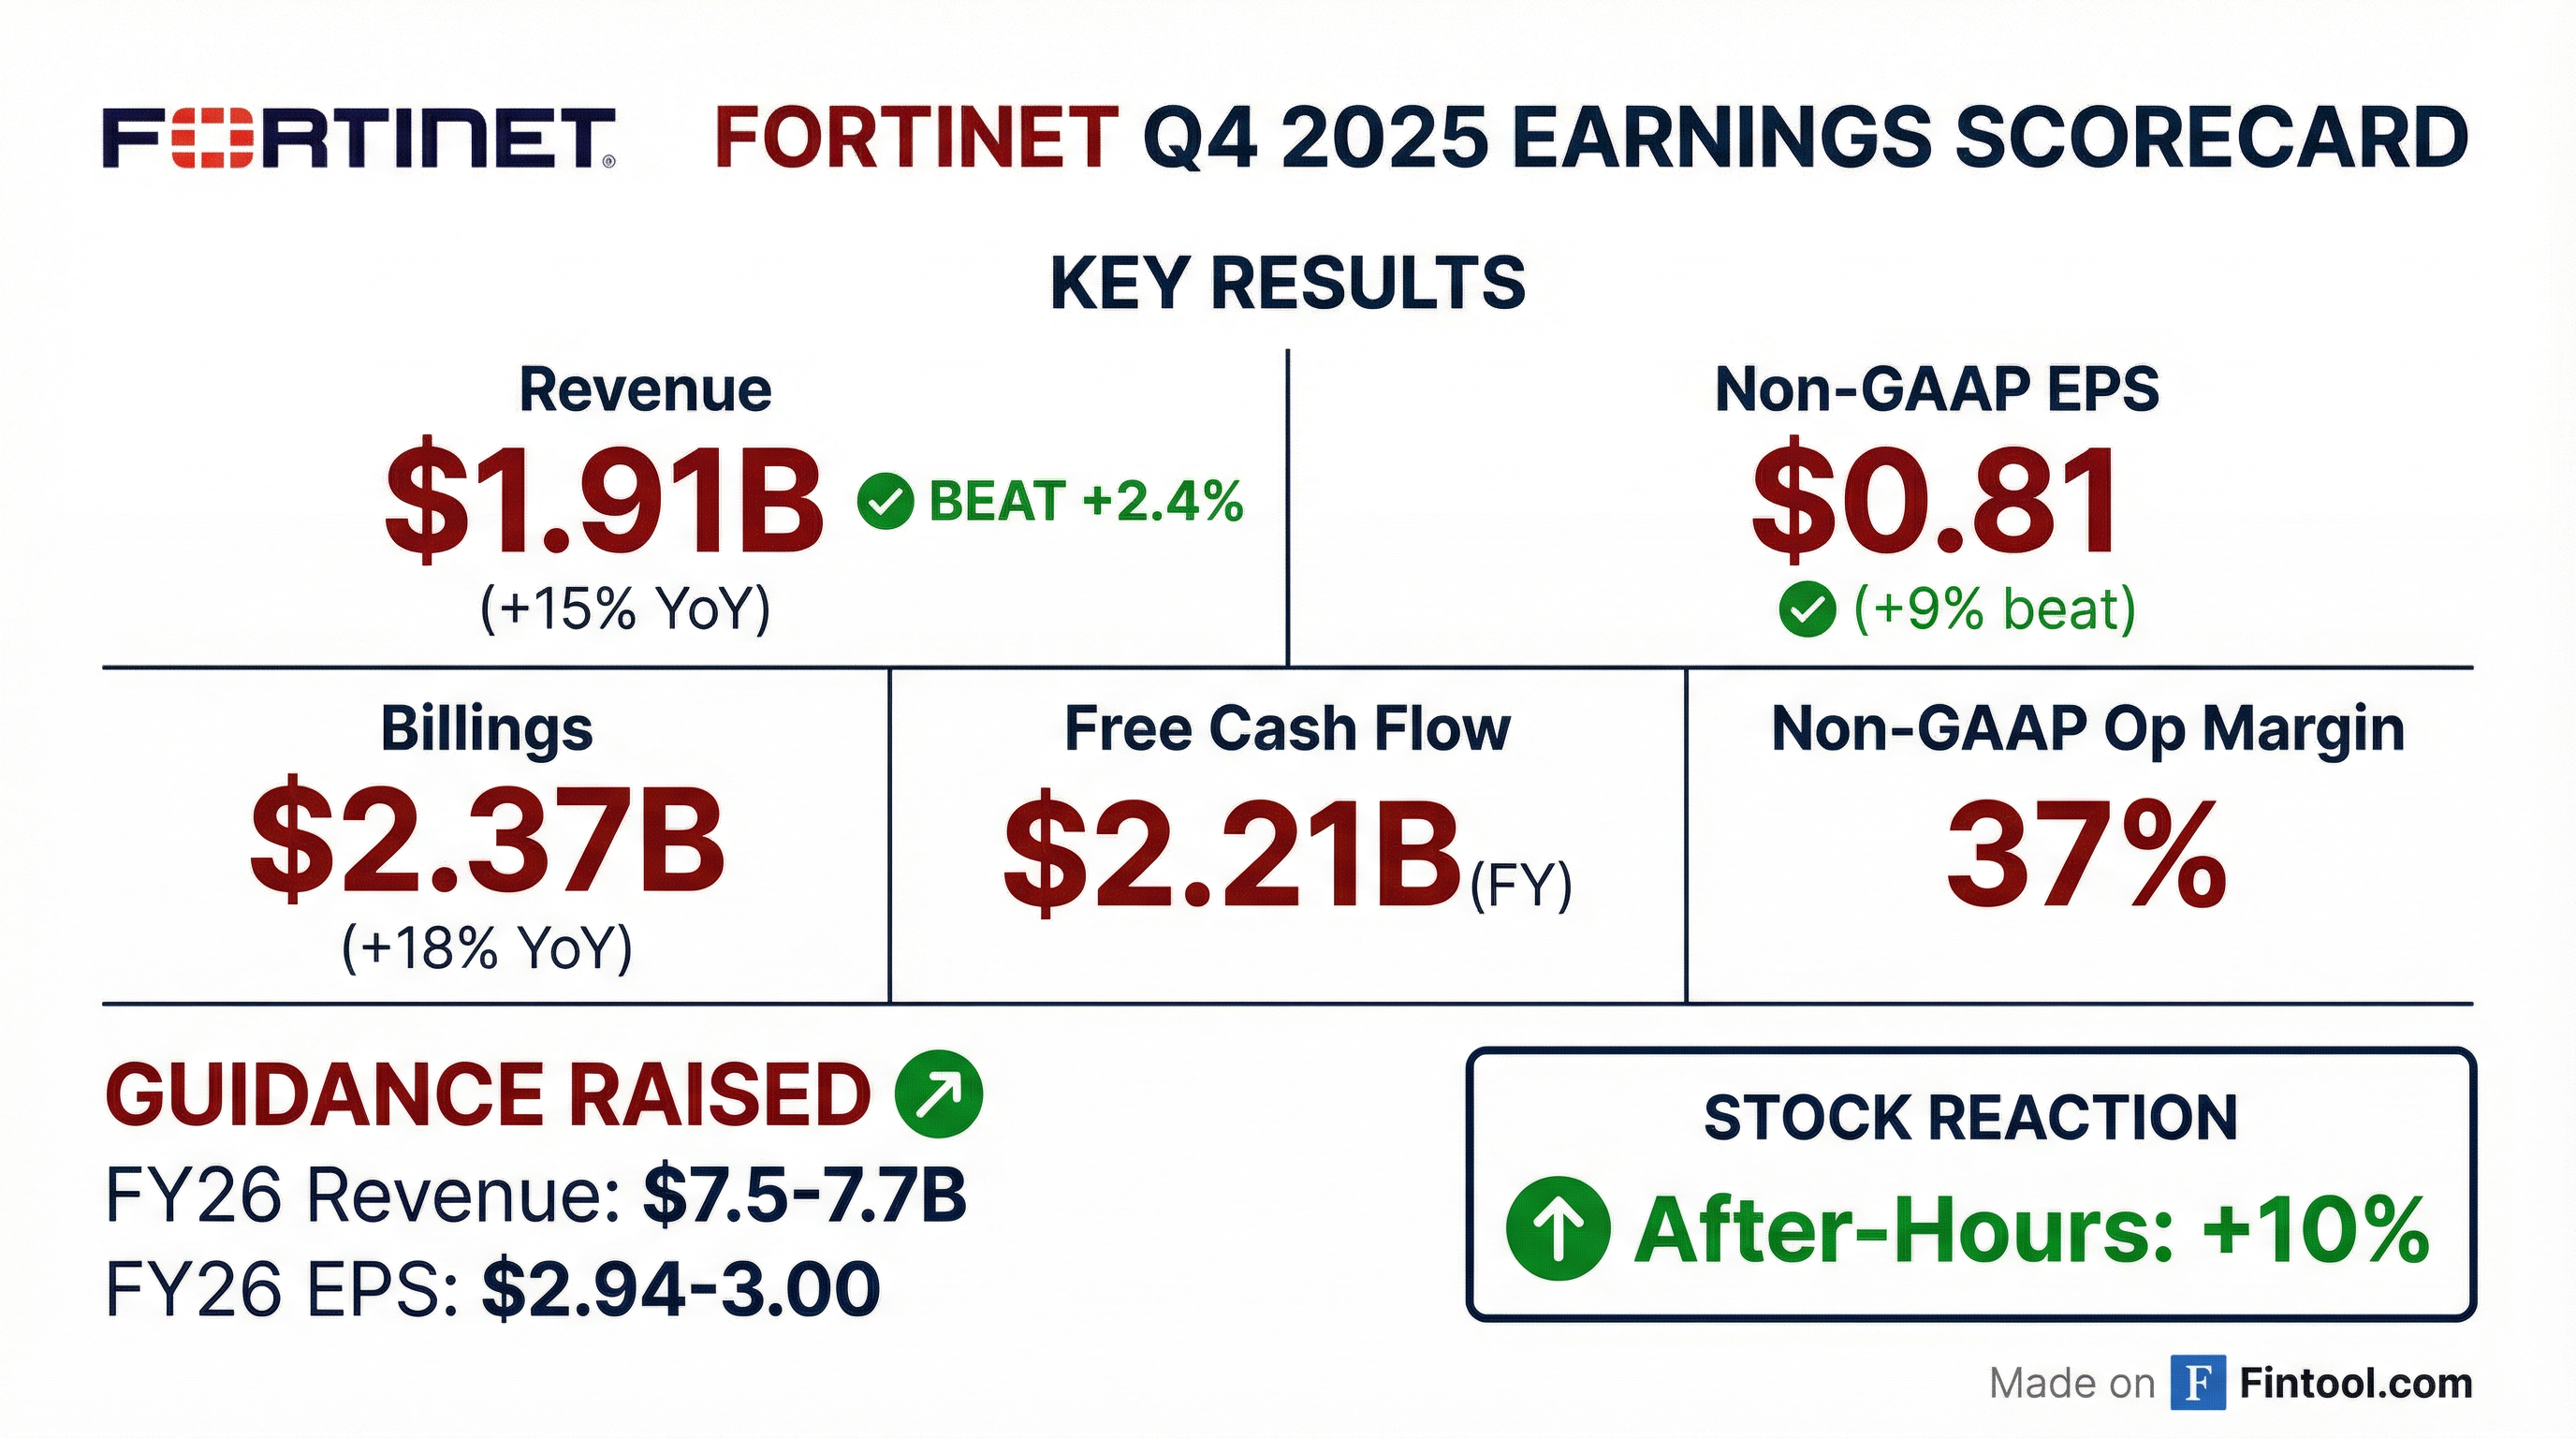
- Q4 billings rose 18% to $2.37 B, revenue up 15% to $1.91 B, product revenue grew >20% to $691 M, and Unified SASE billings increased 40%.
- Operating margin of 37.3%; free cash flow of $577 M; repurchased 0.73 M shares for $57 M and 4.6 M shares for $356 M YTD; $1 B added to buyback authorization, leaving $1.4 B.
- FY 2025 billings up 16% to $7.55 B, revenue up 14% to $6.8 B, operating margin 35.5%, EPS $2.76, and free cash flow $2.21 B.
- Q1 2026 guidance: billings $1.77–1.87 B (14%), revenue $1.7–1.76 B (12%), non-GAAP gross margin 80–81%, operating margin 30–32%.
- Q4 billings rose 18% to $2.37 B, revenue grew 15% to $1.91 B, product revenue up 20%, and operating margin reached 37.3%
- Unified SASE billings grew 40% and OT security billings increased 25%; ARR: Unified SASE up 11% to $1.28 B, SecOps up 21% to $491 M
- Free cash flow was $577 M (adj. FCF $589 M), and Fortinet repurchased ~5.33 M shares for $413 M; board approved an additional $1 B buyback (remaining authorization $1.4 B)
- Q1 2026 guidance: billings $1.77–1.87 B (14% growth), revenue $1.70–1.76 B (12%); FY 2026: billings $8.4–8.6 B (13%), revenue $7.5–7.7 B (12%)
- Fortinet’s Q4 billings rose 18% YoY to $2.37 B, revenue grew 15% to $1.91 B, with product revenue up 20% to $691 M and service revenue up 12% to $1.21 B; operating margin reached 37.3%.
- Broad-based momentum drove Unified SASE billings up 40%, Secure Networking up 13%, OT security billings > 25%, and SecOps billings up 6% in Q4.
- FY 2025 billings climbed 16% to $7.55 B and revenue rose 14% to $6.8 B; operating income was $2.41 B (+16%) on a 35.5% margin, EPS was $2.76, and free cash flow hit a record $2.21 B. The company repurchased ~$413 M of stock in Q4 and increased its buyback authorization by $1 B to $1.4 B.
- Q1 2026 guidance calls for billings of $1.77–1.87 B (+14%) and revenue of $1.70–1.76 B (+12%); full-year 2026 outlook is billings of $8.4–8.6 B (+13%) and revenue of $7.5–7.7 B (+12%), aiming for a seventh consecutive Rule of 45 CAGR.
- Q4 revenue up 15% y-o-y to $1.91 B, product revenue up 20% to $691 M, billings up 18% to $2.37 B; GAAP operating margin 33%, non-GAAP operating margin 37%
- FY 2025 revenue up 14% y-o-y to $6.80 B, product revenue up 16% to $2.22 B, billings up 16% to $7.55 B; GAAP operating margin 31%, non-GAAP operating margin 35%, free cash flow $2.21 B
- Unified SASE billings surged 40% in Q4; Unified SASE & SecOps billings grew 24% for the full year
- Exceeded the “Rule of 45” for the sixth consecutive year, combining revenue growth and non-GAAP operating margin
- Fortinet delivered Q4 revenue of $1.91 billion, up 15% year-over-year, with product revenue of $691 million (+20%) and billings of $2.37 billion (+18%).
- For full year 2025, revenue reached $6.80 billion (+14%), product revenue was $2.22 billion (+16%) and billings totaled $7.55 billion (+16%).
- Q4 GAAP operating margin was 33% and non-GAAP operating margin was 37%; full year GAAP and non-GAAP operating margins were 31% and 35%, respectively.
- Free cash flow for the year was $2.21 billion, marking strong cash generation after capital expenditures.
- Johnson Fistel, PLLP has launched an investigation into potential claims on behalf of Fortinet shareholders who have held shares since prior to November 8, 2024, seeking corporate governance reforms including improved internal controls and transparency.
- The inquiry follows a securities class action alleging Fortinet misrepresented the size, timing, and sustainability of a purported record FortiGate firewall refresh cycle, and overstated associated demand and revenue growth.
- It is claimed that Fortinet’s statements on its sales pipeline, billings, and revenue outlook lacked a reasonable basis, and that its stock price declined when actual demand trends emerged.
- Versant (Nasdaq: VSNT) has completed its acquisition of Free TV Networks (FTN), enhancing its free-to-watch distribution footprint and expanding its portfolio beyond traditional pay-TV.
- FTN will operate as a dedicated business within Versant, adding national premium over-the-air “diginets” and FAST channels—such as 365BLK, OUTLAW, DEFY, BUSTED and PAM GRIER’S SOUL FLIX—to Versant’s existing brand lineup.
- The deal taps into growing free TV audiences: digital broadcast networks grew share by 12% in the 2024/25 season, and nearly 38 million U.S. households now use an antenna, with projections above 50 million by 2030.
- Jonathan Katz, FTN’s founder, joins Versant’s leadership reporting to Chief Revenue and Business Officer David Pietrycha and will continue to lead FTN’s operations.
- Fortinet’s full security suite will be integrated into D&H’s Advanced Solutions+ ecosystem, broadening end-to-end cybersecurity offerings for VARs, CSPs, MSPs, MSSPs and enterprises in the U.S.
- D&H launches the FWD (Forward) Enablement Program, offering structured training, hands-on technical workshops, and dedicated Fortinet expertise to accelerate partner growth.
- Partners gain go-to-market resources—including the D&H SuccessPath to MSP Toolkit—and guidance on cross-portfolio integration to deploy comprehensive security solutions.
- Fortinet solutions are available through D&H Distributing’s network, backed by specialized solution architects for pre-sales consultation and ongoing technical support.
- Fortinet and Arista Networks introduced the Secure AI Data Center solution, a validated, scalable, zero-trust architecture for AI data centers.
- The multivendor design offers zero-touch provisioning enabling deployments up to 80% faster, hyperscale-grade performance for AI training and inference, and an open, modular architecture to eliminate vendor lock-in.
- By offloading HTTPS/TLS to Fortinet’s ASIC, the solution delivers up to 33× performance with sub-single-microsecond latency, freeing server CPUs for AI workloads.
- Monolithic Power Systems has deployed the joint solution to secure and scale its global AI infrastructure, showcasing integration of Fortinet’s security fabric with Arista’s ultra-low-latency networking.
- Fortinet has embedded FortiGate VM on NVIDIA’s BlueField-3 DPU, offloading firewalling, segmentation and zero-trust controls from the host CPU to the DPU to boost throughput and reduce latency in AI and private-cloud environments.
- The integration leverages FortiOS 7.6.3 and allows security functions to run directly on the data-center infrastructure, delivering zero-impact inspection and simplified policy enforcement across multitenant architectures.
- Targeted at cloud service providers, telco edge and enterprise private clouds, the solution supports hardware-accelerated inspection, secure isolation and service chaining at scale.
Quarterly earnings call transcripts for Fortinet.
Ask Fintool AI Agent
Get instant answers from SEC filings, earnings calls & more