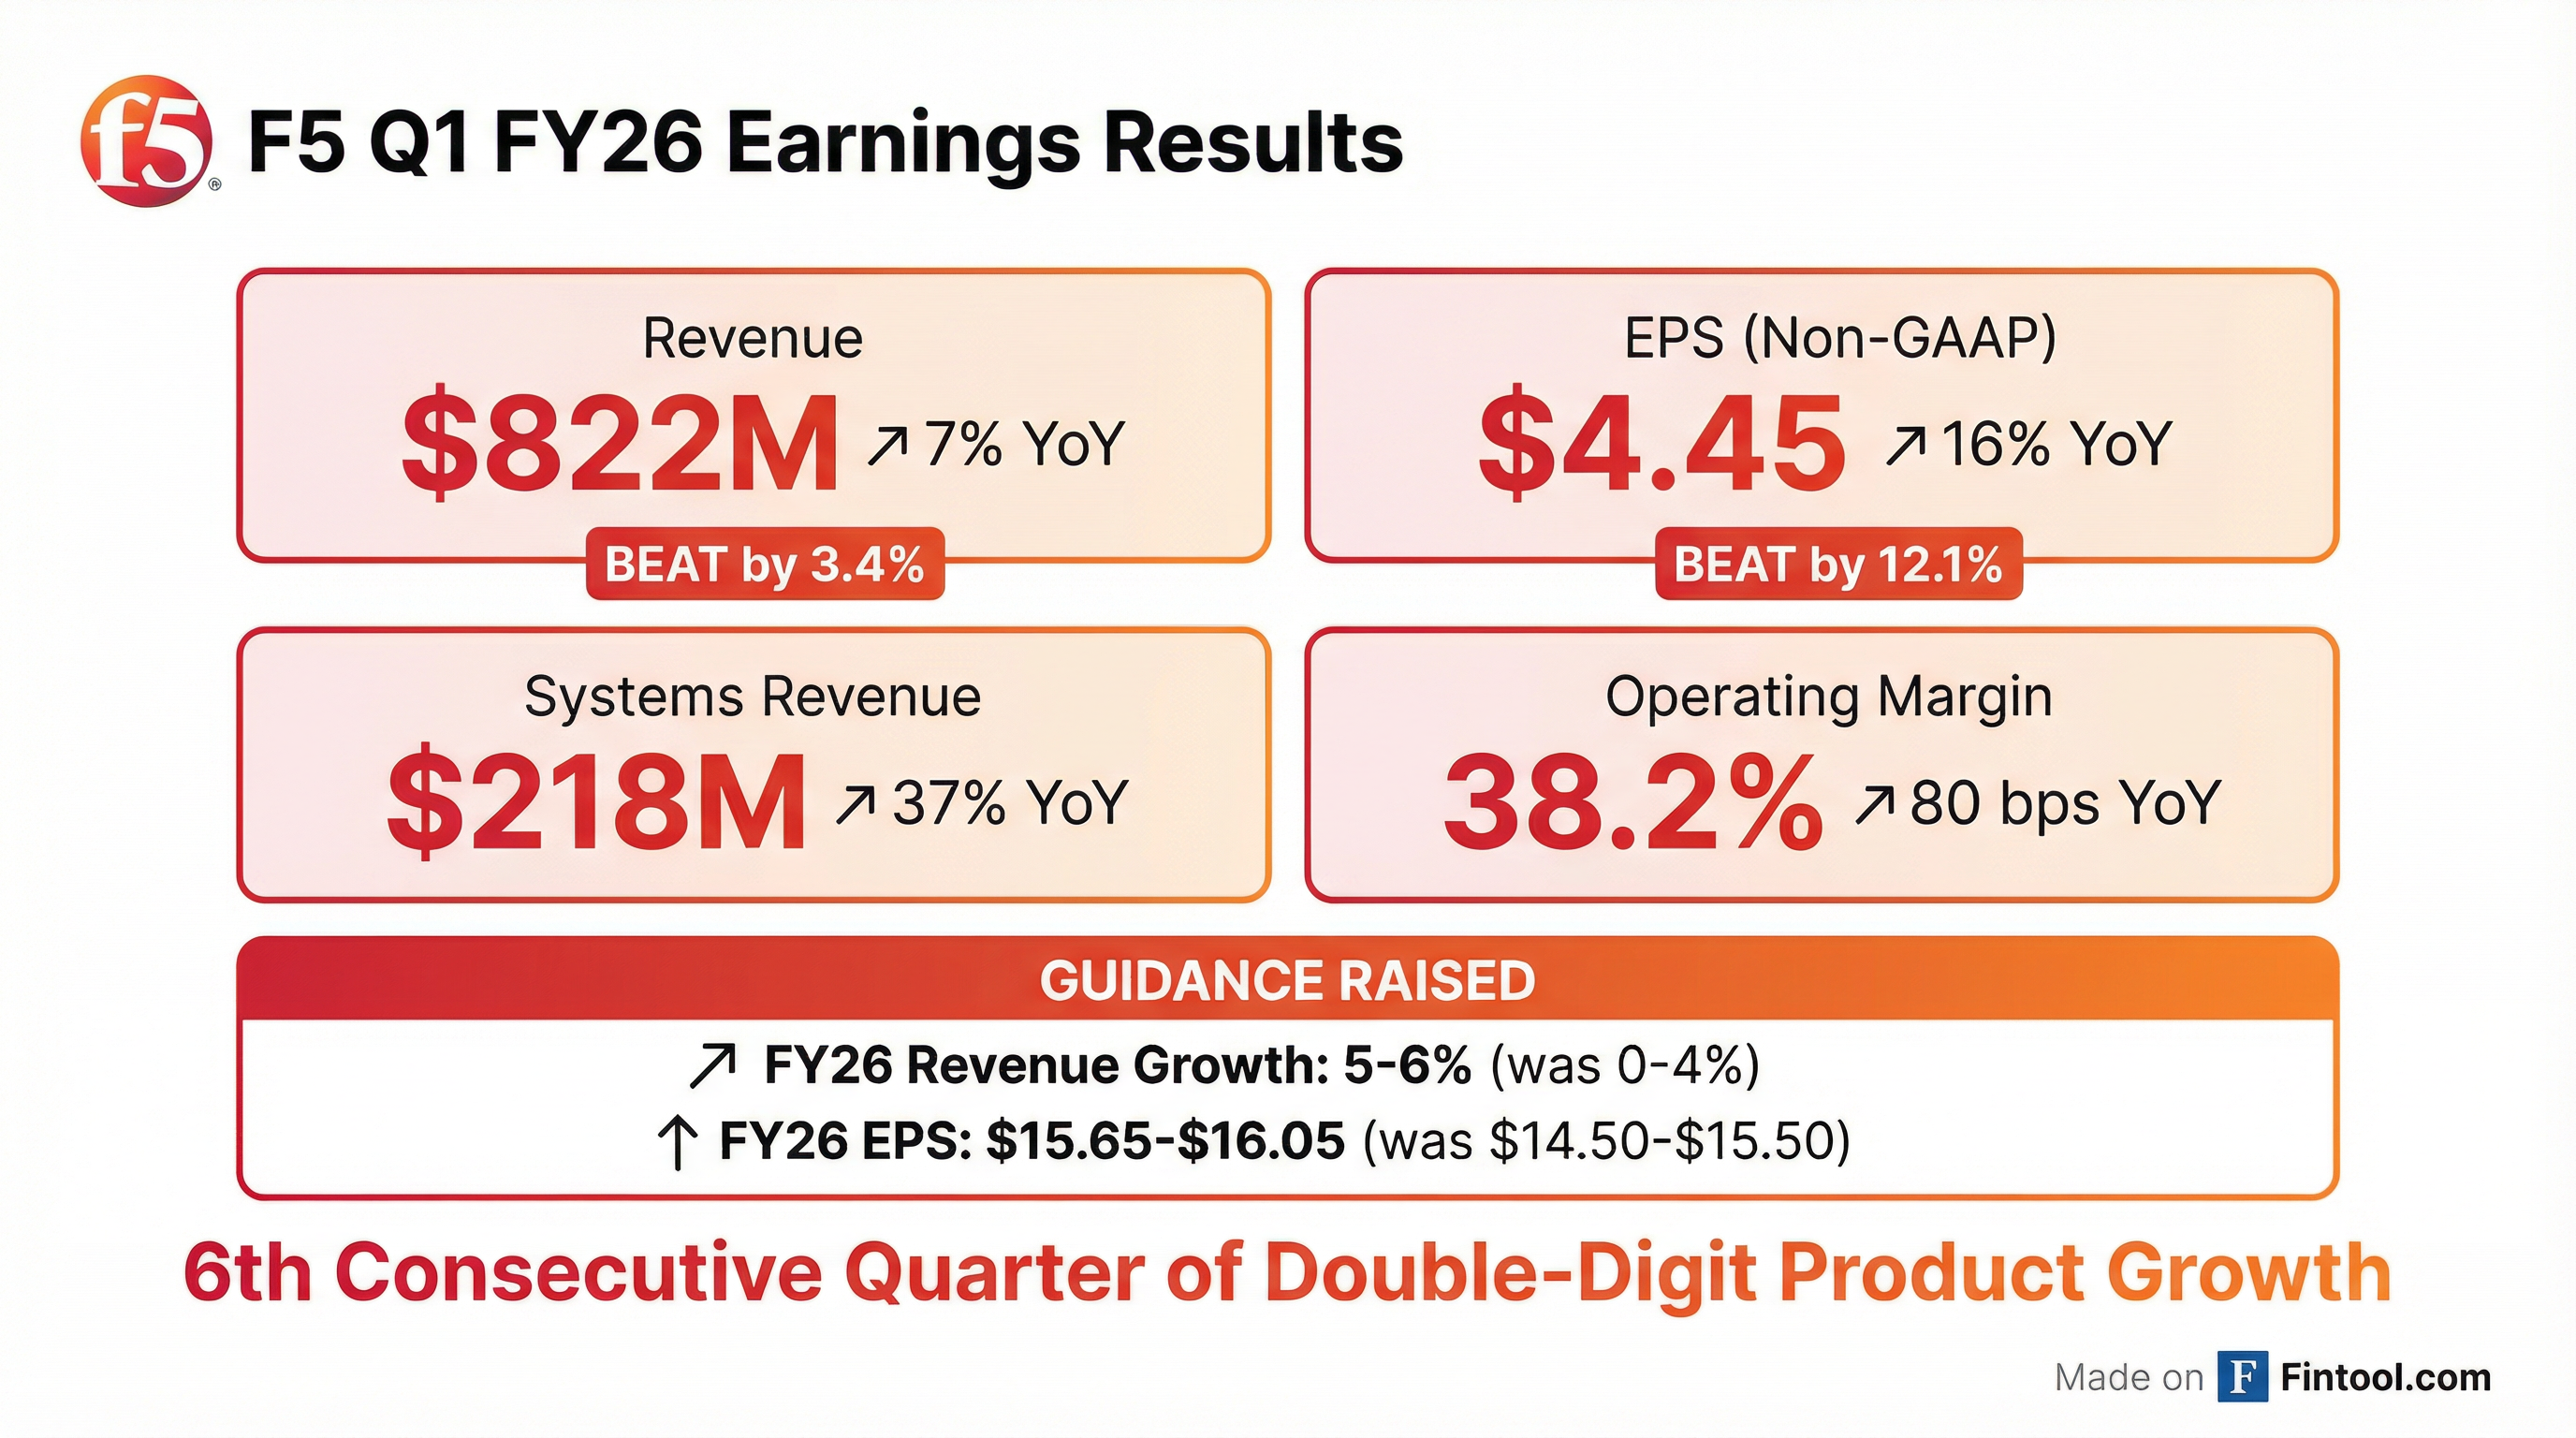
Earnings summaries and quarterly performance for F5.
Executive leadership at F5.
François Locoh-Donou
President and Chief Executive Officer
Chad Whalen
Chief Revenue Officer
Frank Pelzer
Executive Vice President and Chief Financial Officer
Kara Sprague
Executive Vice President and Chief Product Officer
Michael F. Montoya
Chief Technology Operations Officer
Tom Fountain
Chief Operating Officer
Board of directors at F5.
Alan J. Higginson
Chair of the Board
Elizabeth L. Buse
Director
Julie M. Gonzalez
Director
Marianne N. Budnik
Director
Maya McReynolds
Director
Michael L. Dreyer
Director
Michel Combes
Director
Nikhil Mehta
Director
Tami Erwin
Director
Research analysts who have asked questions during F5 earnings calls.
Michael Ng
Goldman Sachs
8 questions for FFIV
Samik Chatterjee
JPMorgan Chase & Co.
8 questions for FFIV
Meta Marshall
Morgan Stanley
7 questions for FFIV
Ryan Koontz
Needham & Company, LLC
7 questions for FFIV
Amit Daryanani
Evercore
6 questions for FFIV
James Fish
Piper Sandler Companies
6 questions for FFIV
Simon Leopold
Raymond James
6 questions for FFIV
George Notter
Jefferies
5 questions for FFIV
Tim Long
Barclays
5 questions for FFIV
Tal Liani
Bank of America
4 questions for FFIV
Tomer Zilberman
Bank of America
3 questions for FFIV
Matt Dezort
William Blair & Company
2 questions for FFIV
Matt Hedberg
RBC
2 questions for FFIV
Matthew Hedberg
RBC Capital Markets
2 questions for FFIV
Timothy Long
Barclays
2 questions for FFIV
Brent Bracelin
Piper Sandler Companies
1 question for FFIV
Maryanne Sarfati
Morgan Stanley
1 question for FFIV
Matt Desert
Needham & Company, LLC
1 question for FFIV
Michael Richards
RBC Capital Markets
1 question for FFIV
Mike Ng
Goldman Sachs
1 question for FFIV
Priyanka Thapa
J.P. Morgan
1 question for FFIV
Sebastien Cyrus Naji
William Blair & Company, L.L.C.
1 question for FFIV
Sebastien Naji
William Blair
1 question for FFIV
W. Chiu
Raymond James
1 question for FFIV
Recent press releases and 8-K filings for FFIV.
- 1606 Corp has signed a non-binding term sheet to acquire a 55 MW behind-the-meter power plant and 50,000 sq. ft. data center-ready warehouse on 132 acres in Texas for $11.67 million (comprising $7.5 million cash and $4.17 million debt assumption).
- The transaction is expected to close by March 11, 2026, subject to definitive agreements and customary closing conditions.
- The strategic acquisition targets captive power infrastructure for AI and high-density data center demand, enhancing 1606’s scalable energy portfolio and long-term cash flow potential.
- Sim Agro Inc. is slated to oversee operations of the Texas facility post-close, bringing international high-efficiency generation expertise.
- Hagens Berman warns that the lead plaintiff deadline is February 17, 2026 for the pending securities class action against F5 and certain executives.
- The lawsuit alleges F5 concealed a long-term, undetected breach of its BIG-IP product development systems by a nation-state actor in August 2025, who exfiltrated sensitive source code.
- Disclosure of the breach in October 2025 and a subsequent cut to 2026 revenue guidance wiped out over $2 billion in market value amid sharp share price declines.
- The class period covers October 28, 2024 – October 27, 2025.
- On Oct. 15, 2025, F5 disclosed that a nation-state actor had maintained persistent access since August 2025 to its BIG-IP systems and exfiltrated source code, driving shares down 14% over two trading days.
- On Oct. 27, 2025, F5 reported disappointing Q4 FY25 results and cut guidance for FY26—citing breach-related sales delays and increased remediation costs—which led to a $22.83 (7%) stock drop the following day.
- Hagens Berman alleges F5 misled investors about the security of its core BIG-IP products and delayed disclosure of the breach, seeking lead plaintiffs by Feb. 17, 2026 for the class period Oct. 28, 2024–Oct. 27, 2025.
- The breach revelations and guidance cut purportedly erased over $2 billion in market value and prompted multiple analyst downgrades.
- Hagens Berman is investigating securities fraud claims against F5 arising from an undisclosed breach of its BIG-IP products, which allegedly erased over $2 billion in market value ( ).
- On Oct 15, 2025, F5 revealed a nation-state actor had long-term access since August 2025, causing a ~14% share drop over two days; on Oct 27, 2025, it reported Q4 FY25 results and cut FY26 guidance, driving an additional 7% decline ( ).
- The class period runs Oct 28, 2024 – Oct 27, 2025, and the deadline to become lead plaintiff is Feb 17, 2026, with Reed Kathrein available for eligible investors ( ).
- Hagens Berman is investigating F5 for allegedly concealing a long-term breach of its BIG-IP product, during which a nation-state actor maintained persistent access since August 2025 and exfiltrated source code.
- F5’s October 15, 2025 disclosure of the breach drove a ~14% share drop over two trading days, followed by a 7% decline after its Q4 FY25 results on October 27, 2025, as it cut 2026 revenue guidance to reflect remediation costs.
- The proposed class covers purchases from October 28, 2024 to October 27, 2025, with a February 17, 2026 lead plaintiff deadline; alleged market value losses exceed $2 billion.
- Hagens Berman has issued notice to investors in F5, Inc. (NASDAQ: FFIV) regarding the February 17, 2026 lead plaintiff deadline in a pending securities class action alleging executives misled the market about BIG-IP security vulnerabilities.
- The lawsuit claims a nation-state actor maintained persistent access to F5 systems, exfiltrating source code from the BIG-IP product development environment—disclosures in October 2025 triggered share price declines and a fiscal 2026 guidance cut.
- Investors who purchased FFIV shares between October 28, 2024 and October 27, 2025 and suffered losses are urged to contact Hagens Berman before the deadline.
- A class action lawsuit was filed on behalf of shareholders who bought F5 securities between October 28, 2024 and October 27, 2025, alleging the company concealed a significant breach in its BIG-IP development environment discovered in August 2025.
- The complaint claims a nation-state actor maintained “long-term, persistent” access, potentially compromising source code and vulnerability data.
- Following public disclosure, F5 reportedly saw reduced sales and renewals, elongated sales cycles, and increased remediation costs, prompting a revision of its fiscal 2026 revenue guidance to 0–4% growth, down from mid-single digits.
- Applications to serve as lead plaintiff must be filed by February 17, 2026.
- Faruqi & Faruqi is investigating claims that F5 executives made false or misleading statements by failing to disclose a significant security breach affecting its BIG-IP product.
- The proposed class covers investors who purchased F5 securities between October 28, 2024 and October 27, 2025.
- On October 27, 2025, F5 reported Q4 FY2025 results and lowered fiscal 2026 guidance due to the breach, and its share price fell 10.9% to $258.76 by October 29, 2025.
- The deadline to seek lead plaintiff status in the federal securities class action is February 17, 2026.
- The Portnoy Law Firm advises investors who bought F5 securities from Oct 28, 2024 to Oct 27, 2025 to join a class action, with a lead plaintiff motion deadline of Feb 17, 2026.
- On Oct 15, 2025, F5 disclosed that a nation-state threat actor gained unauthorized access in early August, exfiltrating portions of its BIG-IP source code and undisclosed vulnerability data.
- Following the disclosure, F5’s share price dropped $35.40 (approx. 10.7%) from $330.75 to $295.35 on Oct 16, 2025.
- Hagens Berman notified F5 investors of the February 17, 2026 lead plaintiff deadline in a pending securities class action against F5 and certain executives.
- The lawsuit, spanning October 28, 2024 – October 27, 2025, alleges F5 concealed an August 2025 breach of its BIG-IP systems by a nation-state actor that exfiltrated source code.
- F5 shares plunged nearly 14% over two days after the breach disclosure and fell another 7% following a 2026 revenue guidance cut, wiping out over $2 billion in market value.
- Affected investors are urged to contact Hagens Berman partner Reed Kathrein by the deadline to participate in the action.
Fintool News
In-depth analysis and coverage of F5.

Quarterly earnings call transcripts for F5.
Ask Fintool AI Agent
Get instant answers from SEC filings, earnings calls & more