Earnings summaries and quarterly performance for HENRY SCHEIN.
Executive leadership at HENRY SCHEIN.
Board of directors at HENRY SCHEIN.
Anne Margulies
Director
Bradley Sheares
Director
Carole Faig
Director
Dan Daniel
Director
Deborah Derby
Director
Joseph Herring
Director
Kurt Kuehn
Director
Max Lin
Director
Mohamad Ali
Director
Philip Laskawy
Lead Independent Director
Reed Tuckson
Director
Robert Hombach
Director
Scott Serota
Director
Research analysts who have asked questions during HENRY SCHEIN earnings calls.
Elizabeth Anderson
Evercore ISI
8 questions for HSIC
Jason Bednar
Piper Sandler Companies
8 questions for HSIC
Brandon Vazquez
William Blair & Company, L.L.C.
6 questions for HSIC
John Stansel
JPMorgan Chase & Co.
6 questions for HSIC
Kevin Caliendo
UBS
6 questions for HSIC
Allen Lutz
Bank of America
5 questions for HSIC
Jeff Johnson
Robert W. Baird & Co.
4 questions for HSIC
Jeffrey Johnson
Robert W. Baird & Co. Inc.
4 questions for HSIC
Jonathan Block
Stifel Financial Corp.
3 questions for HSIC
Alan Lutz
Bank of America Corporation
2 questions for HSIC
Joe Federico
Stifel Financial Corp.
2 questions for HSIC
Jon Stansel
J.P. Morgan
2 questions for HSIC
Michael Cherny
Leerink Partners
2 questions for HSIC
Michael Petusky
Barrington Research
2 questions for HSIC
Michael Turney
Leerink Partners
2 questions for HSIC
Brandon Vasquez
William Blair & Company
1 question for HSIC
John Block
Stifel
1 question for HSIC
Vikramjeet Chopra
Wells Fargo & Company
1 question for HSIC
Recent press releases and 8-K filings for HSIC.
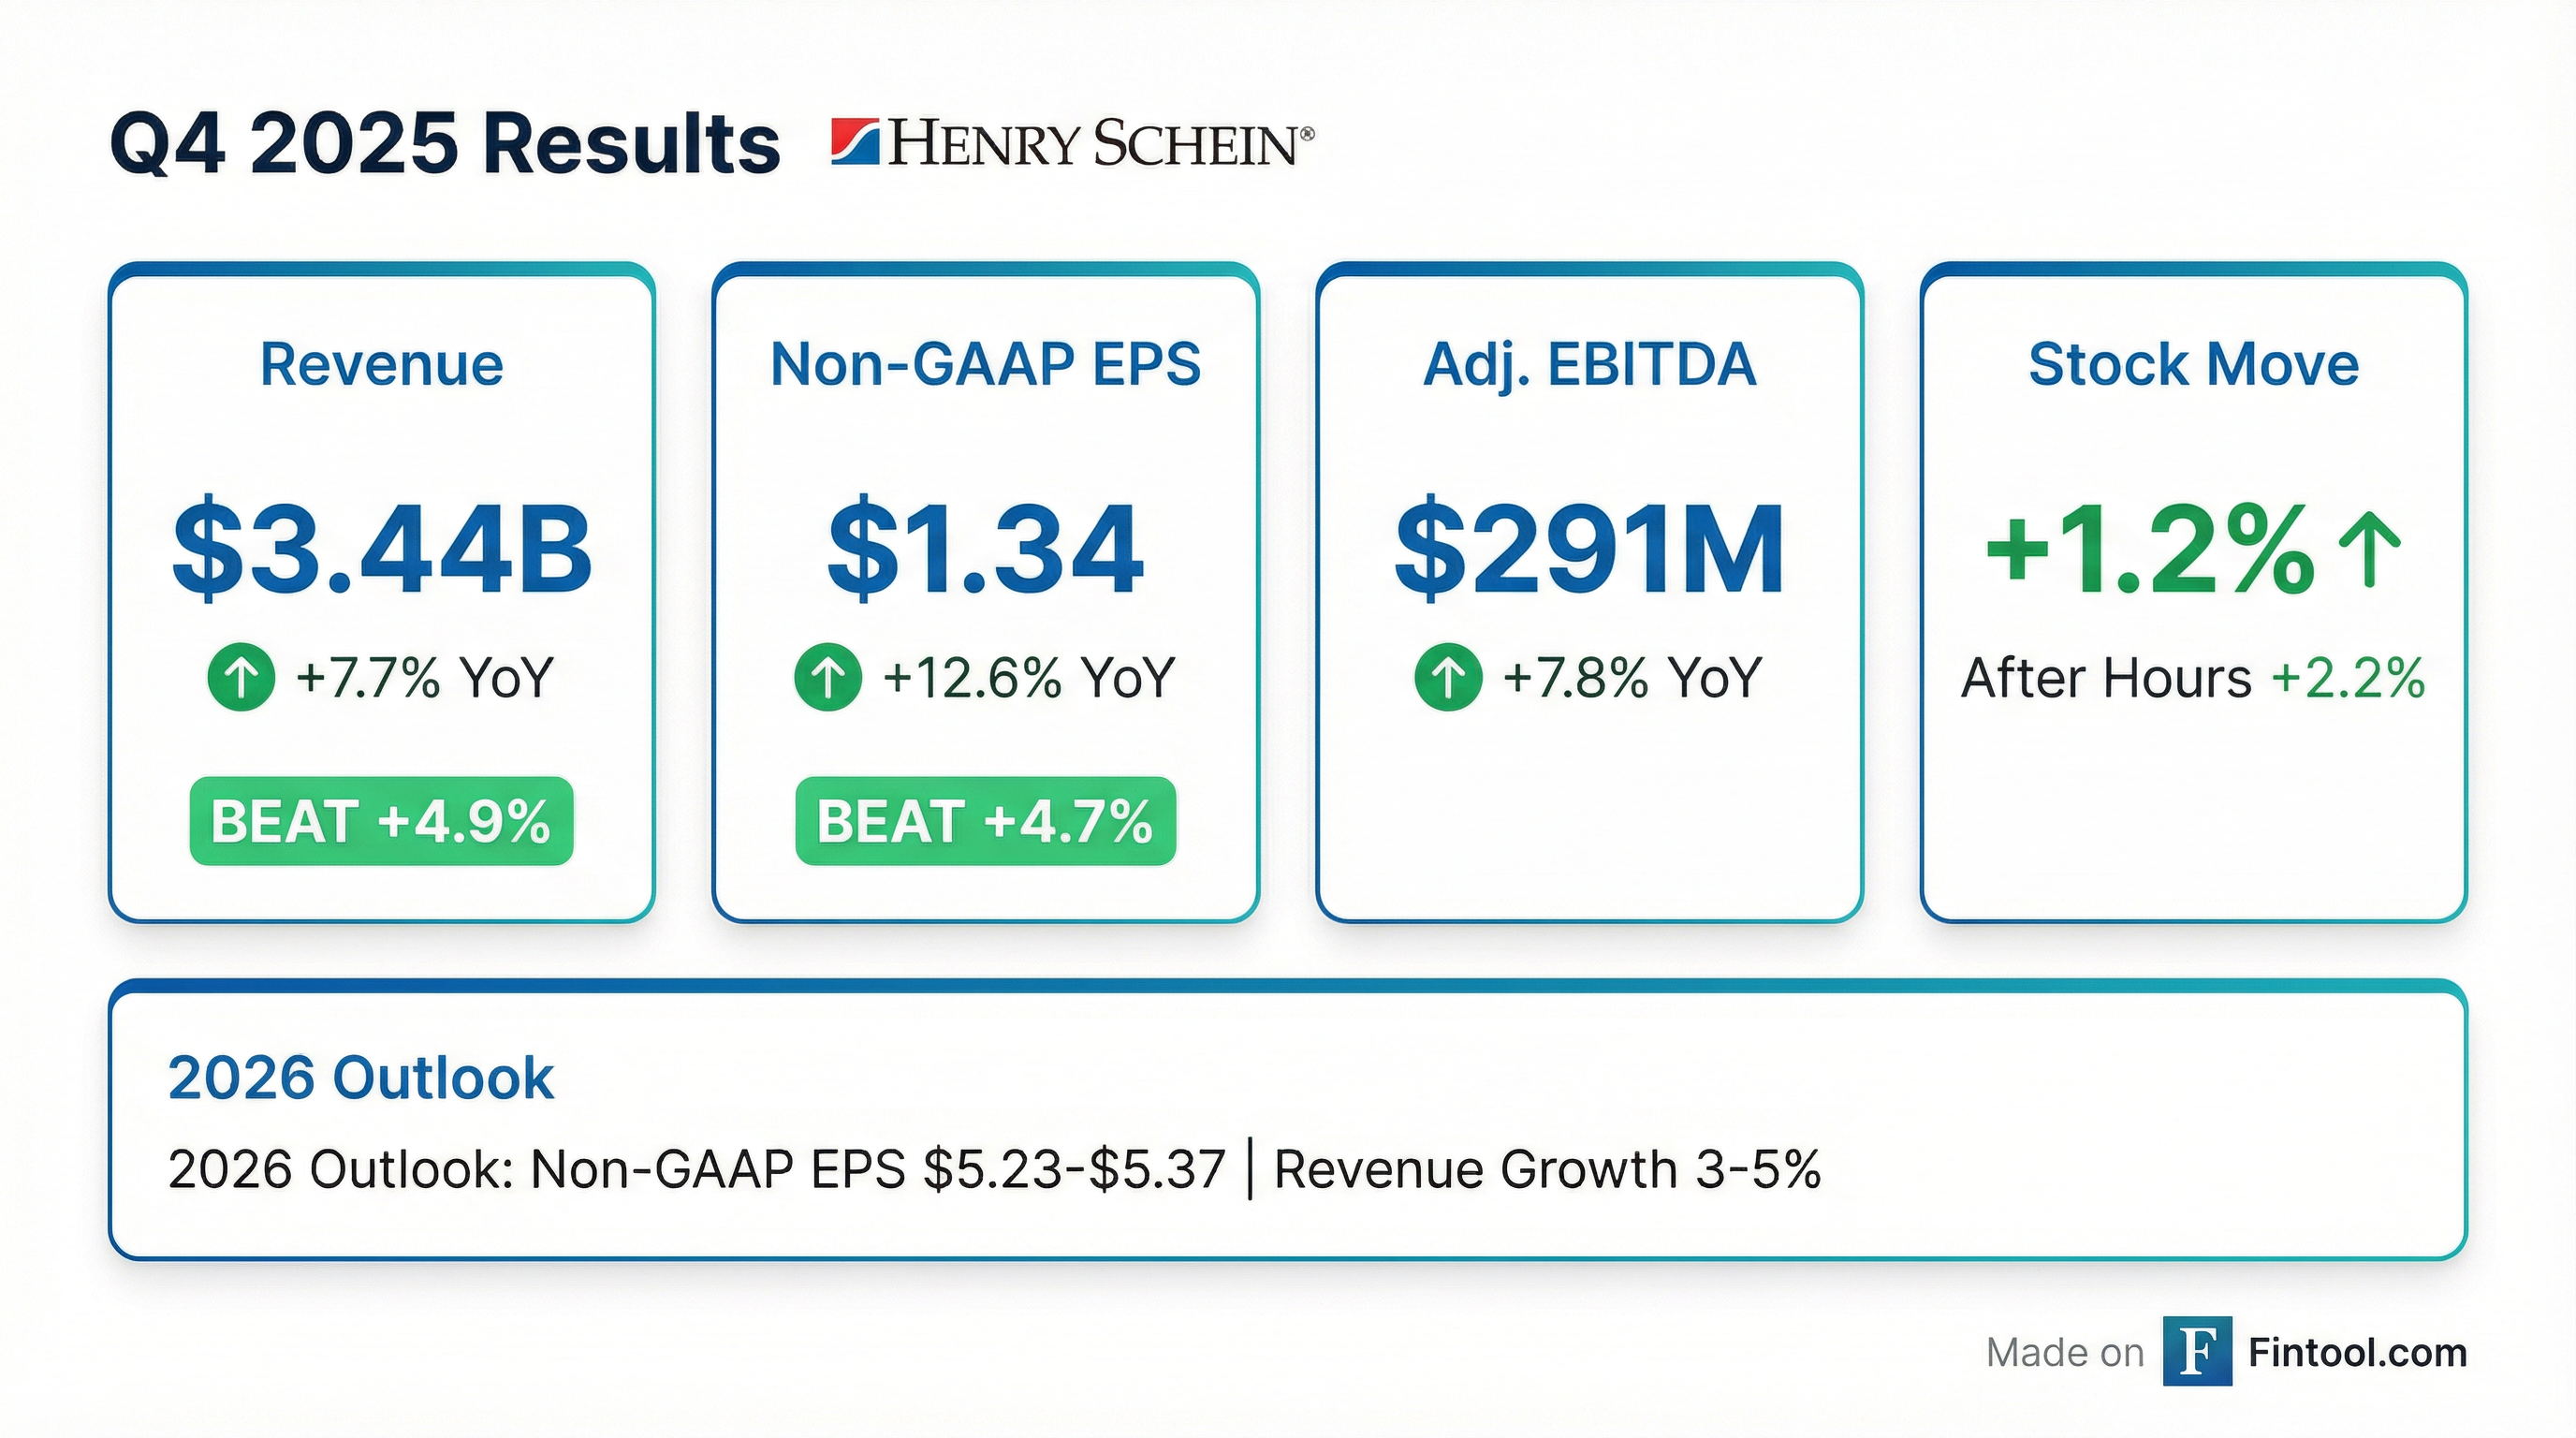
- Henry Schein delivered $3.4 billion in Q4 sales, up 7.7% year-over-year (constant currency +5.8%), led by distribution, equipment, specialty products, and technology businesses.
- Q4 non-GAAP EPS was $1.34 (+12.6%), with GAAP EPS of $0.85.
- Frederick Lowery will assume the role of CEO next week, with Stanley Bergman transitioning to Chairman.
- 2026 guidance targets 3–5% sales growth and non-GAAP EPS of $5.23–$5.37 (+5–8%), with stronger earnings weighted to H2 2026.
- Q4 2025 total sales of $3.437 billion, up 7.7% year-over-year, marking the highest sales growth in 15 quarters, driven by global equipment, specialty products and technology businesses.
- Q4 non-GAAP diluted EPS of $1.34, up 12.6% y/y (GAAP EPS $0.85, +14.9% y/y).
- Strong segment performance: Distribution & Value-Added Services +5.2% CC, Specialty Products +11.1% CC and Technology +7.6% CC sales growth.
- 2026 guidance for non-GAAP diluted EPS of $5.23–$5.37 and total sales growth of 3–5%.
- Returned capital with $200 million of share repurchases in Q4; generated $381 million of operating cash flow; debt at 2.6x Adjusted EBITDA.
- Henry Schein appointed Fred Lowry as CEO effective next week, with Stan remaining as Board Chair.
- Q4 sales of $3.4 billion (+7.7% YoY) and non-GAAP EPS of $1.34 (vs. $1.19), with adjusted EBITDA of $291 million (+8.4%).
- Repurchased 2.8 million shares for $200 million, leaving $780 million available for future buybacks.
- 2026 guidance calls for 3–5% sales growth, non-GAAP EPS of $5.23–$5.37, and mid-single-digit adjusted EBITDA growth.
- Frederick Lowery to join as CEO next week, with Stanley Bergman moving to Chairman
- Q4 revenue of $3.4 billion, up 7.7% YoY (5.8% CC); non-GAAP EPS $1.34, vs $1.19 a year ago
- 2026 guidance: sales growth 3–5%; non-GAAP diluted EPS $5.23–$5.37 (+5–8% YoY); mid-single digit adjusted EBITDA growth
- Repurchased 2.8 million shares for $200 million in Q4; $780 million remaining under authorization
- Q4 net sales of $3.4 billion, up 7.7%, GAAP diluted EPS $0.85 (vs. $0.74), and non-GAAP diluted EPS $1.34 (vs. $1.19)
- Full-year net sales of $13.2 billion, up 4.0%, GAAP diluted EPS $3.27 (vs. $3.05), and non-GAAP diluted EPS $4.97 (vs. $4.74)
- Share repurchases of 12.1 million shares totaling $850 million in 2025, including 2.8 million shares for $200 million in Q4; $780 million remains authorized
- 2026 guidance: non-GAAP diluted EPS of $5.23–$5.37, total sales growth of 3–5%, and mid-single-digit Adjusted EBITDA growth
- Fred Lowery appointed incoming CEO, joining Henry Schein in early 2026
- Q4 2025 net sales of $3.437 billion (+7.7%) and non-GAAP EPS of $1.34 vs $1.19 in Q4 2024.
- Full-year 2025 net sales of $13.184 billion (+4.0%) and non-GAAP EPS of $4.97 vs $4.74 in 2024.
- 2026 guidance for non-GAAP EPS of $5.23–$5.37 and sales growth of 3–5%.
- Fred Lowery to join as CEO next week, succeeding Stanley Bergman.
- Share repurchases of $200 million in Q4 and $850 million for FY 2025, with $780 million remaining authorized.
- Henry Schein has signed an exclusive distribution agreement with CytoChip to offer its FDA 510(k)-cleared CitoCBC® hematology analyzer, the first cartridge-based CBC system to receive a CLIA Waiver in the U.S.
- The CitoCBC system delivers lab-quality complete blood count results in approximately eight minutes with minimal staff training, enabling point-of-care testing in urgent care centers and physician offices
- Henry Schein’s U.S. exclusivity covers ambulatory care settings and critical access hospitals (≤25 patient beds), but excludes long-term care and acute care facilities
- This partnership aims to expand access to immediate diagnostic data, supporting informed decisions and improving patient care outside traditional lab environments
- Henry Schein will appoint Fred Lowery—a two-decade veteran of Thermo Fisher with deep distribution, manufacturing, and integration experience—as CEO effective March 2, 2026, succeeding Stan Bergman upon his retirement; Lowery’s values and domain expertise align closely with the company’s BOLD +1 strategy.
- The company has fully recovered from its cyber incident, returning to revenue and operating income growth in 2024, with market share gains across dental and medical distribution; since 2020, operating income grew at a 3.6% CAGR and EPS at 6.2% CAGR, aided by share repurchases, and further growth is expected in 2025.
- Management launched a $200 million+ net operating profit improvement program focused on gross profit optimization and G&A efficiency, with an anticipated net benefit in 2026 and accelerated savings into 2027, driven by enhanced pricing, portfolio management, and shared-services consolidation.
- In dental, the consumables market is stable to slightly positive; Henry Schein is gaining share through its omnichannel model, expanded corporate brands, and targeted growth in DSOs and mid-market practices, while pursuing digital equipment integration and AI-enabled workflow improvements.
- The technology segment is early in its SaaS transition, with ~10% of customers on cloud subscription, and is partnering with AWS to develop voice-based AI solutions, underscoring a significant runway for practice management and digital integration offerings.
- Fred Lowery will become Henry Schein’s new CEO on March 2, succeeding Stanley Bergman, selected for his two decades of distribution and value-creation experience at Thermo Fisher.
- The company has regained market share and returned to growth in 2024 after the 2023 cyber incident, with momentum expected to continue into 2025.
- Announced a $200 million value-creation initiative targeting gross profit and G&A efficiencies through 2027, with net benefits in 2026 expected to exceed required investments.
- Progressing its BOLD + 1 strategy, aiming for 60% of operating income from high-growth, high-margin, and owned-brand products by 2027.
- Capital deployment balances M&A in high-margin segments (e.g., home medical, implants) with aggressive share repurchases, supported by strong cash generation.
- Appointed Fred Lowery as CEO effective March 2, 2026 following a rigorous internal and external search; retiring CEO Stan Bergman emphasized Lowery’s alignment with the company’s BOLD+1 strategy and values.
- Returned to normalized growth in 2024 after the cyber incident and expects continued revenue and operating income expansion in 2025; achieved an operating income CAGR of 3.6% and an EPS CAGR of 6.2% from 2017 to 2024.
- Launched a $200 million+ value creation program targeting gross profit improvements and G&A efficiencies, with net benefits beginning in 2026 and accelerating into 2027.
- Dental and medical end markets are stable to modestly positive; Henry Schein is gaining share through its omnichannel distribution, proprietary brands, and integrated digital solutions.
- Continues to deploy capital in accretive share repurchases while pursuing targeted M&A in high-growth, high-margin areas such as home medical and implant businesses.
Quarterly earnings call transcripts for HENRY SCHEIN.
Ask Fintool AI Agent
Get instant answers from SEC filings, earnings calls & more