Earnings summaries and quarterly performance for Stride.
Executive leadership at Stride.
Board of directors at Stride.
Research analysts who have asked questions during Stride earnings calls.
Jason Tilchen
Canaccord Genuity Group Inc.
7 questions for LRN
Jeffrey Silber
BMO Capital Markets
7 questions for LRN
Gregory Parrish
Morgan Stanley
6 questions for LRN
Patrick McIlwee
William Blair
5 questions for LRN
Alexander Paris
Barrington Research Associates, Inc.
3 questions for LRN
Alex Paris
Barrington Research Associates
3 questions for LRN
Alex Parrish
Barrington Research
1 question for LRN
Gowshihan Sriharan
Singular Research
1 question for LRN
Matt Fylock
William Blair
1 question for LRN
Matthew Filek
William Blair
1 question for LRN
Thomas Singlehurst
Citigroup
1 question for LRN
Recent press releases and 8-K filings for LRN.
- Stride (LRN) reported strong Q2 2026 financial results, with revenue of $631.3 million, up nearly 8% year-over-year, adjusted operating income of $159 million, up 17%, and adjusted EPS of $2.50, up 13%.
- The company confirmed that platform issues are behind them, with withdrawal rates returning to historical norms in January and demand remaining strong. Total enrollments for Q2 were 248.5 thousand, an increase of 7.8% from last year.
- Full-year Adjusted Operating Income guidance was raised to $485-$505 million from $475-$500 million, while full-year revenue guidance was reaffirmed at $2.480-$2.555 billion.
- Stride's board authorized a share repurchase program of up to $500 million, and the company purchased $88.6 million in shares during Q2 2026.
- Gross margin for the quarter was 41.1%, benefiting by approximately 200 basis points from a gain related to exiting a non-core business.
- Stride (LRN) reported strong Q2 2026 financial results, with revenue of $631.3 million (up nearly 8% year-over-year), Adjusted Operating Income of $159 million (up 17%), and Adjusted EPS of $2.50 (up 13%).
- The company announced that the core platform issues are behind them, with second-semester withdrawal rates returning to historical norms and a 90% drop in login-related customer support calls.
- Total enrollments for Q2 2026 reached 248,500, up 7.8% from the prior year, driven by continued strong demand for educational alternatives.
- Stride reaffirmed its full-year revenue guidance of $2.480 billion-$2.555 billion and raised its Adjusted Operating Income guidance to $485 million-$505 million.
- The board authorized a $500 million share repurchase program, with $88.6 million already purchased in Q2 2026.
- Stride (LRN) reported strong Q2 2026 financial results, with revenue of $631.3 million (up nearly 8%) and adjusted operating income of $159 million (up 17%). Adjusted EPS reached $2.50, an increase of 13% year-over-year.
- The company announced that core platform issues are resolved, leading to a significant drop in customer support calls and a return to historical withdrawal rates for the second semester. Demand, measured by application volumes, remains strong.
- Stride reaffirmed its full-year revenue guidance of $2.480-$2.555 billion and raised its Adjusted Operating Income guidance to $485-$505 million.
- The board authorized a $500 million share repurchase, with $88.6 million executed in Q2. The company is prioritizing stability over growth for the current year.
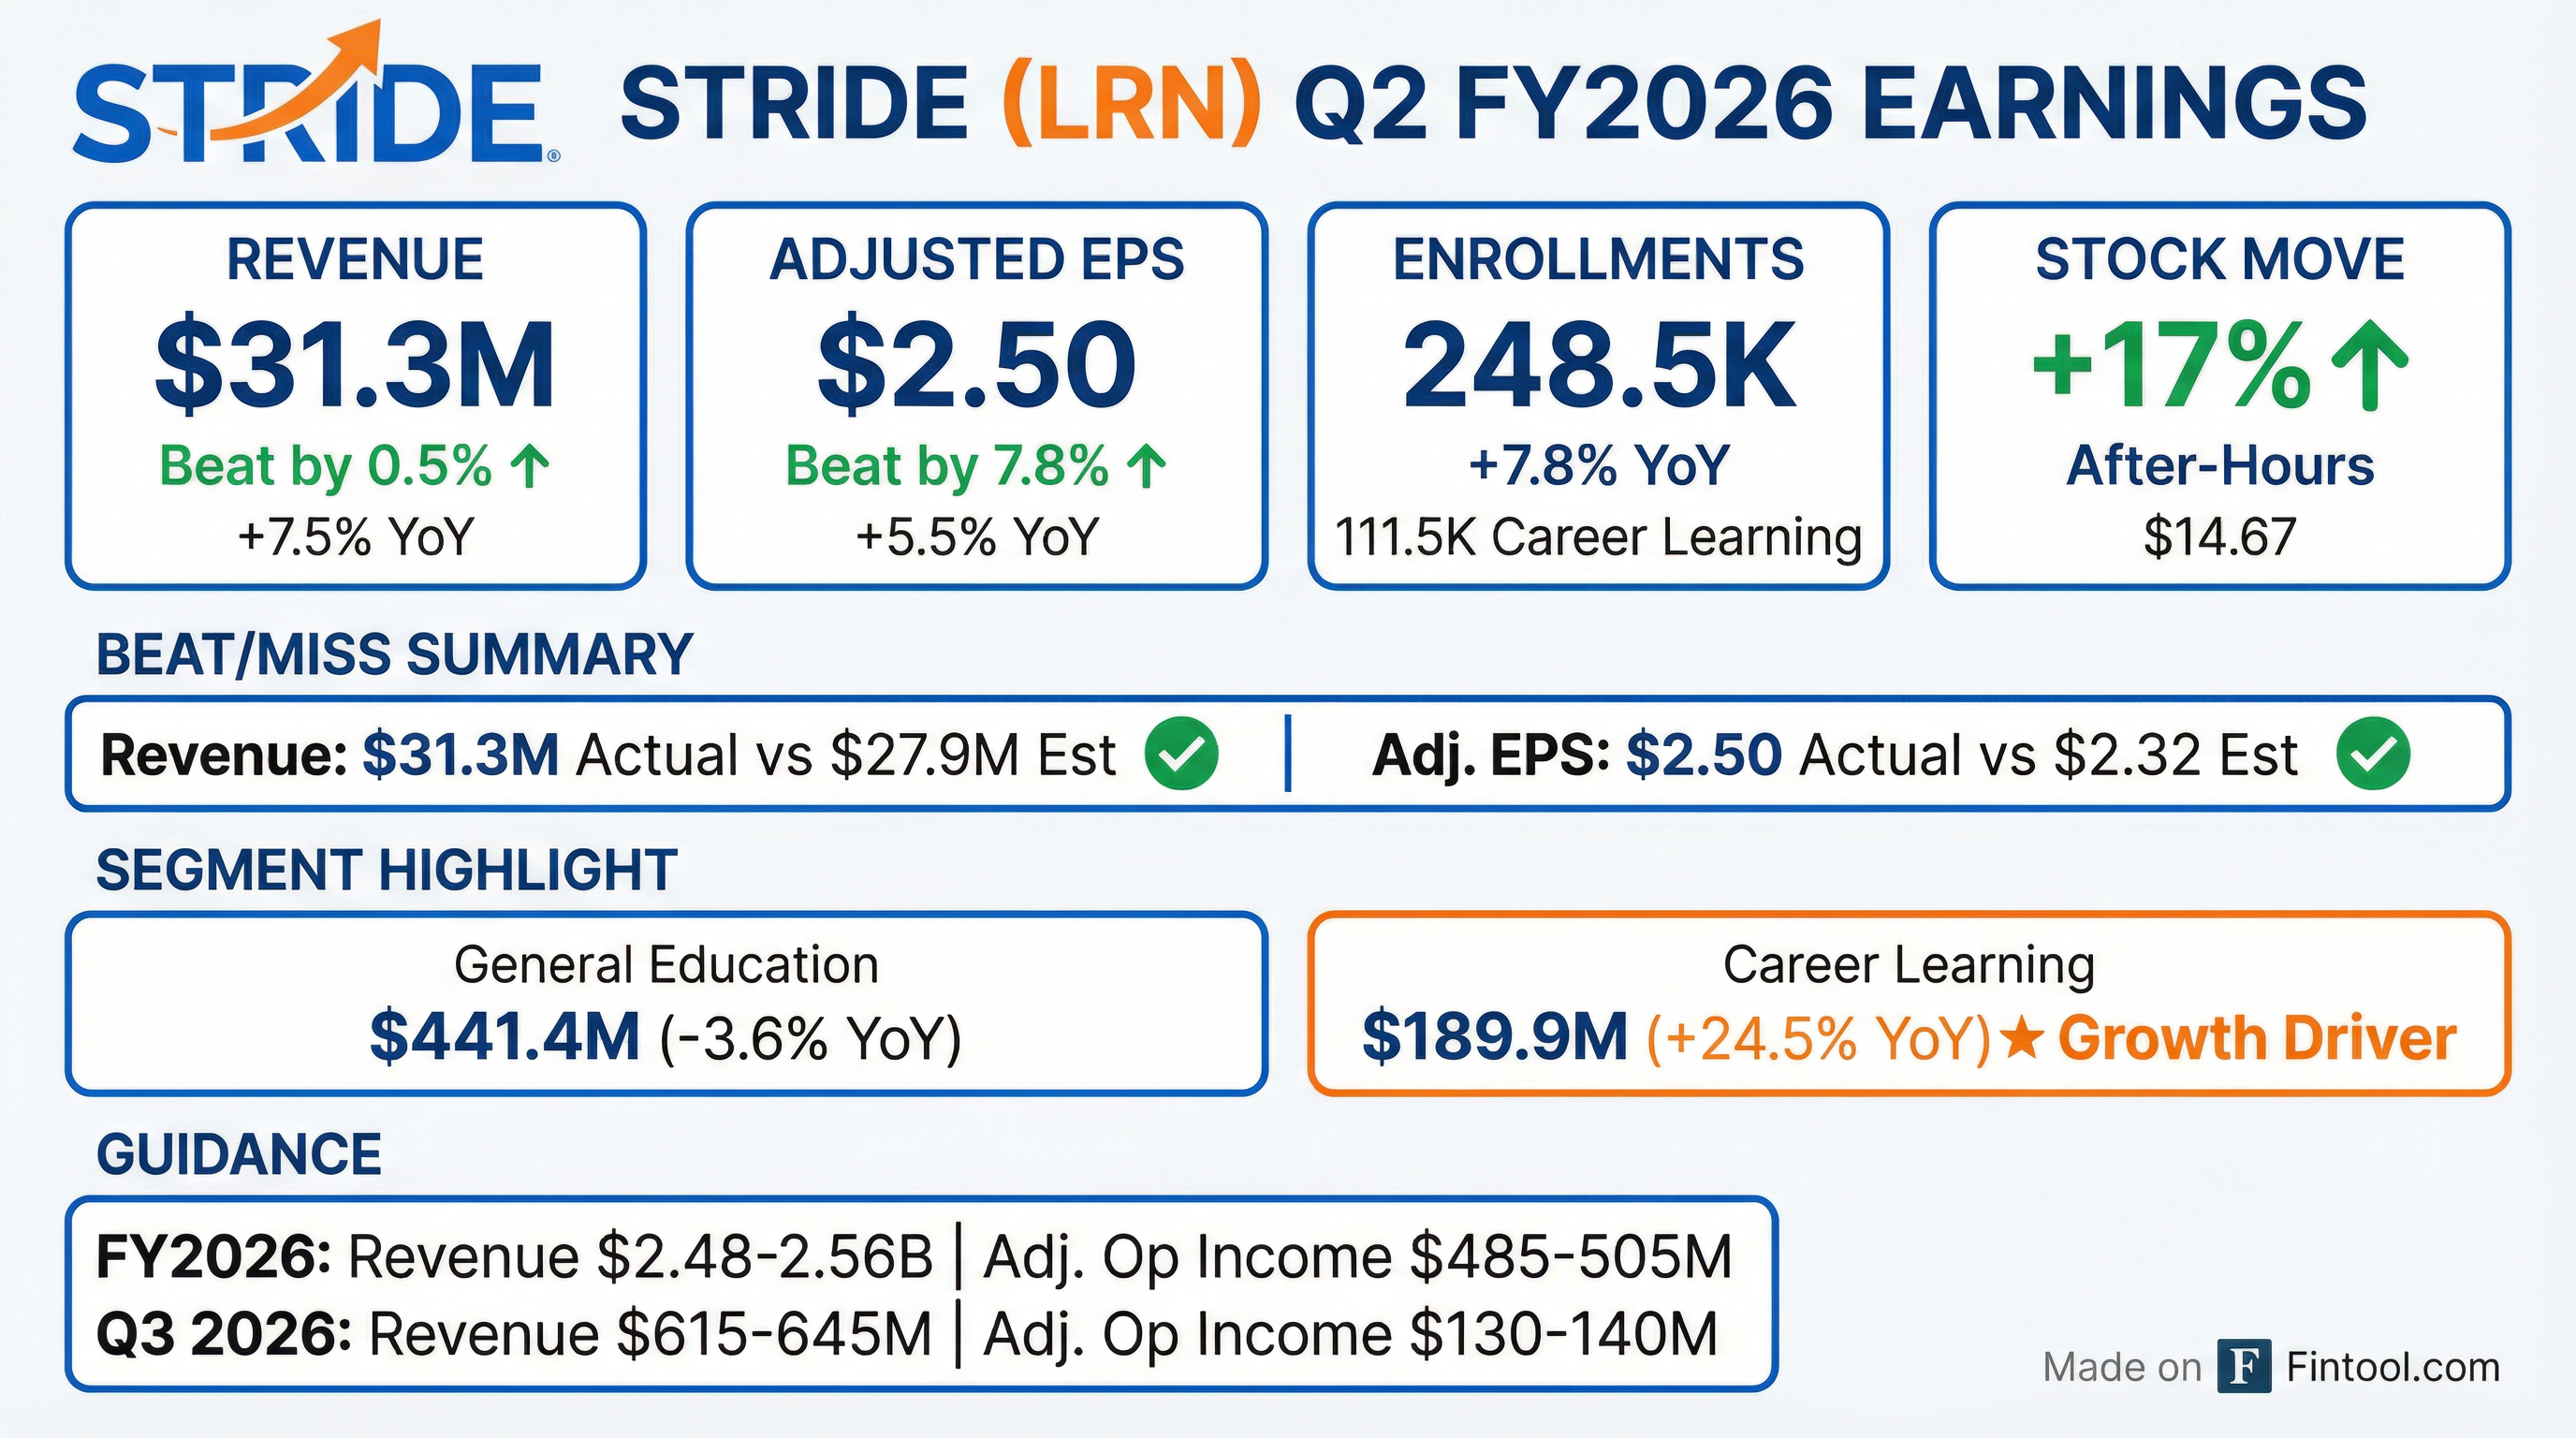
- LRN reported Q2 FY2026 Adjusted Operating Income of $159.0 million, a 17% year-over-year increase, along with Adjusted EBITDA of $188.1 million, also up 17% year-over-year, and Adjusted EPS of $2.50, a 5.5% year-over-year increase.
- Total enrollments for Q2 FY2026 reached 248.5K, marking a 7.8% increase from the prior year, contributing to a total revenue of $631.3 million, up 7.5% year-over-year.
- The company reaffirmed its FY2026 revenue guidance in the range of $2.480 billion to $2.555 billion and increased its Adjusted Operating Income guidance to between $485 million and $505 million.
- The Board authorized a $500 million share repurchase program through October 31, 2026, with approximately $89 million completed as of December 31, 2025.
- Stride, Inc. reported Q2 Fiscal Year 2026 revenue of $631.3 million, an increase from $587.2 million in the prior year period, with diluted net income per share of $2.12 and adjusted earnings per share of $2.50.
- For the six months ended December 31, 2025, revenue reached $1,252.1 million, with diluted net income per share of $3.49 and adjusted earnings per share of $3.95.
- Total enrollments in Q2 Fiscal Year 2026 increased by 7.8% to 248.5K, driven by a 17.6% rise in Career Learning enrollments to 111.5K.
- The company forecasts full fiscal year 2026 revenue in the range of $2.480 billion to $2.555 billion and adjusted operating income between $485 million and $505 million.
- For the third quarter of fiscal year 2026, revenue is projected to be between $615 million and $645 million, with adjusted operating income in the range of $130 million to $140 million.
- Stride, Inc. reported second quarter fiscal year 2026 revenue of $631.3 million, with diluted net income per share of $2.12 and adjusted earnings per share of $2.50 for the period ended December 31, 2025.
- For the six months ended December 31, 2025, revenue reached $1,252.1 million, and adjusted earnings per share was $3.95.
- Total enrollments for Q2 FY2026 grew 7.8% to 248.5K compared to the prior year, primarily driven by a 17.6% increase in Career Learning enrollments to 111.5K.
- The company forecasts full fiscal year 2026 revenue between $2.480 billion and $2.555 billion and adjusted operating income of $485 million to $505 million.
- For the third quarter of fiscal year 2026, Stride, Inc. anticipates revenue between $615 million and $645 million and adjusted operating income in the range of $130 million to $140 million.
- The Law Offices of Frank R. Cruz is investigating Stride, Inc. (LRN) for potential breach of fiduciary duties to shareholders.
- The investigation stems from a September 14, 2025, report alleging fraud, deceptive trade practices, systemic violations of law, and intentional misconduct, including inflating enrollment numbers with "ghost students" and ignoring compliance requirements.
- Following this news, Stride's stock price fell $18.60, or 11.7%, to close at $139.76 per share on September 15, 2025.
- On October 28, 2025, Stride released its Q1 fiscal 2026 financial results, revealing purposely limited enrollment growth, "system implantation issues," higher withdrawal rates, and lower conversion rates, resulting in approximately 10,000 to 15,000 fewer enrollments.
- Stride's stock price further declined by $83.48, or 54.4%, to close at $70.05 per share on October 29, 2025, after the Q1 FY26 results.
- A securities class action lawsuit is pending against Stride, Inc. (LRN), with the deadline for investors to move for appointment as lead plaintiff set for January 12, 2026.
- The lawsuit alleges two distinct fraudulent schemes: inflated enrollment figures using "Ghost Students" and a catastrophic technology platform failure.
- These alleged disclosures resulted in the stock crashing 54% in a single day and a forecast of dramatically slowed sales growth of only 5%.
- The complaint seeks to recover losses for investors who purchased LRN securities during the Class Period of October 22, 2024 – October 28, 2025.
- Hagens Berman is reminding investors of a January 12, 2026 deadline to move for lead plaintiff in a securities class action lawsuit against Stride, Inc. (LRN).
- The lawsuit alleges two fraudulent schemes: inflated enrollment figures using "Ghost Students" and a catastrophic technology platform failure.
- These alleged disclosures led to an 11% stock drop from the enrollment fraud and a 54% single-day stock crash due to the technology failure.
- The alleged technology failure blocked access for 10,000 to 15,000 students and resulted in a forecast of 5% sales growth, significantly down from 19% historical growth.
- Hagens Berman is reminding investors in Stride, Inc. (LRN) of a January 12, 2026 deadline to move for appointment as lead plaintiff in a securities class action lawsuit.
- The lawsuit alleges Stride engaged in two fraudulent schemes: inflating enrollment figures with "Ghost Students" and concealing a catastrophic technology platform failure.
- These alleged disclosures led to an 11% stock drop from the "Ghost Student" scheme and a 54% single-day stock crash due to the technology failure, which also forced a revised sales growth forecast of 5% (down from 19%).
- The Class Period for investors who purchased LRN securities and suffered losses is October 22, 2024 – October 28, 2025.
Quarterly earnings call transcripts for Stride.
Ask Fintool AI Agent
Get instant answers from SEC filings, earnings calls & more