Earnings summaries and quarterly performance for INSIGHT ENTERPRISES.
Executive leadership at INSIGHT ENTERPRISES.
Joyce Mullen
President and Chief Executive Officer
Adrian Gregory
President, EMEA
Dee Burger
President, North America
James Morgado
Chief Financial Officer
Rachael Crump
Chief Accounting Officer
Samuel Cowley
Senior Vice President, General Counsel and Secretary
Board of directors at INSIGHT ENTERPRISES.
Research analysts who have asked questions during INSIGHT ENTERPRISES earnings calls.
Adam Tindle
Raymond James
6 questions for NSIT
Joseph Cardoso
JPMorgan Chase & Co.
6 questions for NSIT
Vincent Colicchio
Barrington Research Associates
4 questions for NSIT
Anthony Lebiedzinski
Sidoti & Company, LLC
2 questions for NSIT
Luke Morrison
Canaccord Genuity Group Inc.
2 questions for NSIT
Harry Read
Redburn Atlantic
1 question for NSIT
Matthew Sheerin
Stifel
1 question for NSIT
Recent press releases and 8-K filings for NSIT.
- Insight Enterprises is pivoting to an AI-first solutions integrator, helping clients navigate technology and AI, with over $8 billion in net revenues and 14,500 global employees.
- The company expects its cloud business to grow in the low double digits and core services in the high single digits in 2026. Gross margins have improved from approximately 15% in 2022 to the low 20s now.
- In 2025, partner program changes resulted in a $70 million impact to gross profit and $1.50 impact to EPS; the business pivot is complete, but some economic tail impact is expected in the second half of 2026, with a fresh start in 2027.
- CEO Joyce announced her intent to retire, and the board aims to identify a candidate by the end of Q1.
- The company generates strong cash flows (targeting over 90% of net income) and has a healthy balance sheet with debt leverage just over 2; M&A is critical long-term but a pause is expected for most of 2026.
- Insight Enterprises has pivoted to an AI-first solutions integrator, building out services capabilities through six acquisitions over the past three years, with net revenues just over $8 billion and 14,500 people globally.
- The company has achieved significant gross margin expansion, moving from approximately 15% in 2022 to the low 20s now, with core services margins improving from the low 20s to the low 30s in the same period.
- For 2026, cloud business is expected to grow in the low double digits and core services in the high single digits. The company anticipates some economic tail impact from 2025 partner program changes in the second half of 2026, with 2027 expected to be a complete fresh start financially.
- The board is actively searching for a new CEO to replace the retiring Joyce, aiming to identify a candidate by the end of Q1 2026.
- The company is in a pause for M&A for at least the better part of 2026, maintaining a healthy balance sheet with debt leverage slightly north of two and strong free cash flow generation.
- Insight Enterprises, an AI-first solutions integrator, reported net revenues of just over $8 billion and 14,500 global employees.
- The company has improved gross margins from approximately 15% in 2022 to the low 20s now, with core services margins increasing from the low 20s to the low 30s in the same period.
- For the current year, the cloud business is projected to grow in the low double digits and core services in the high single digits. Last year, partner program changes resulted in a $70 million impact to gross profit and $1.50 of EPS, though the cloud business still grew 2%.
- CEO Joyce announced her intent to retire, and the board aims to identify a successor by the end of Q1.
- The company plans a pause in M&A for at least the better part of this year to absorb recent acquisitions and align with the new CEO.
- Net Sales for Q4 2025 were $2.0 billion, representing a 1% decrease year-over-year, and for the full year 2025, they totaled $8.2 billion, a 5% decrease year-over-year.
- Gross Profit for Q4 2025 increased by 9% year-over-year to $478 million, while for the full year 2025, it was $1.8 billion, remaining flat year-over-year.
- Diluted Earnings Per Share for Q4 2025 increased by 69% year-over-year to $1.67, and Adjusted Diluted Earnings Per Share grew by 11% year-over-year to $2.96. For the full year 2025, Diluted EPS decreased by 26% to $4.86, while Adjusted Diluted EPS increased by 2% to $9.87.
- Net Cash from Operations for the full year 2025 was $304 million.
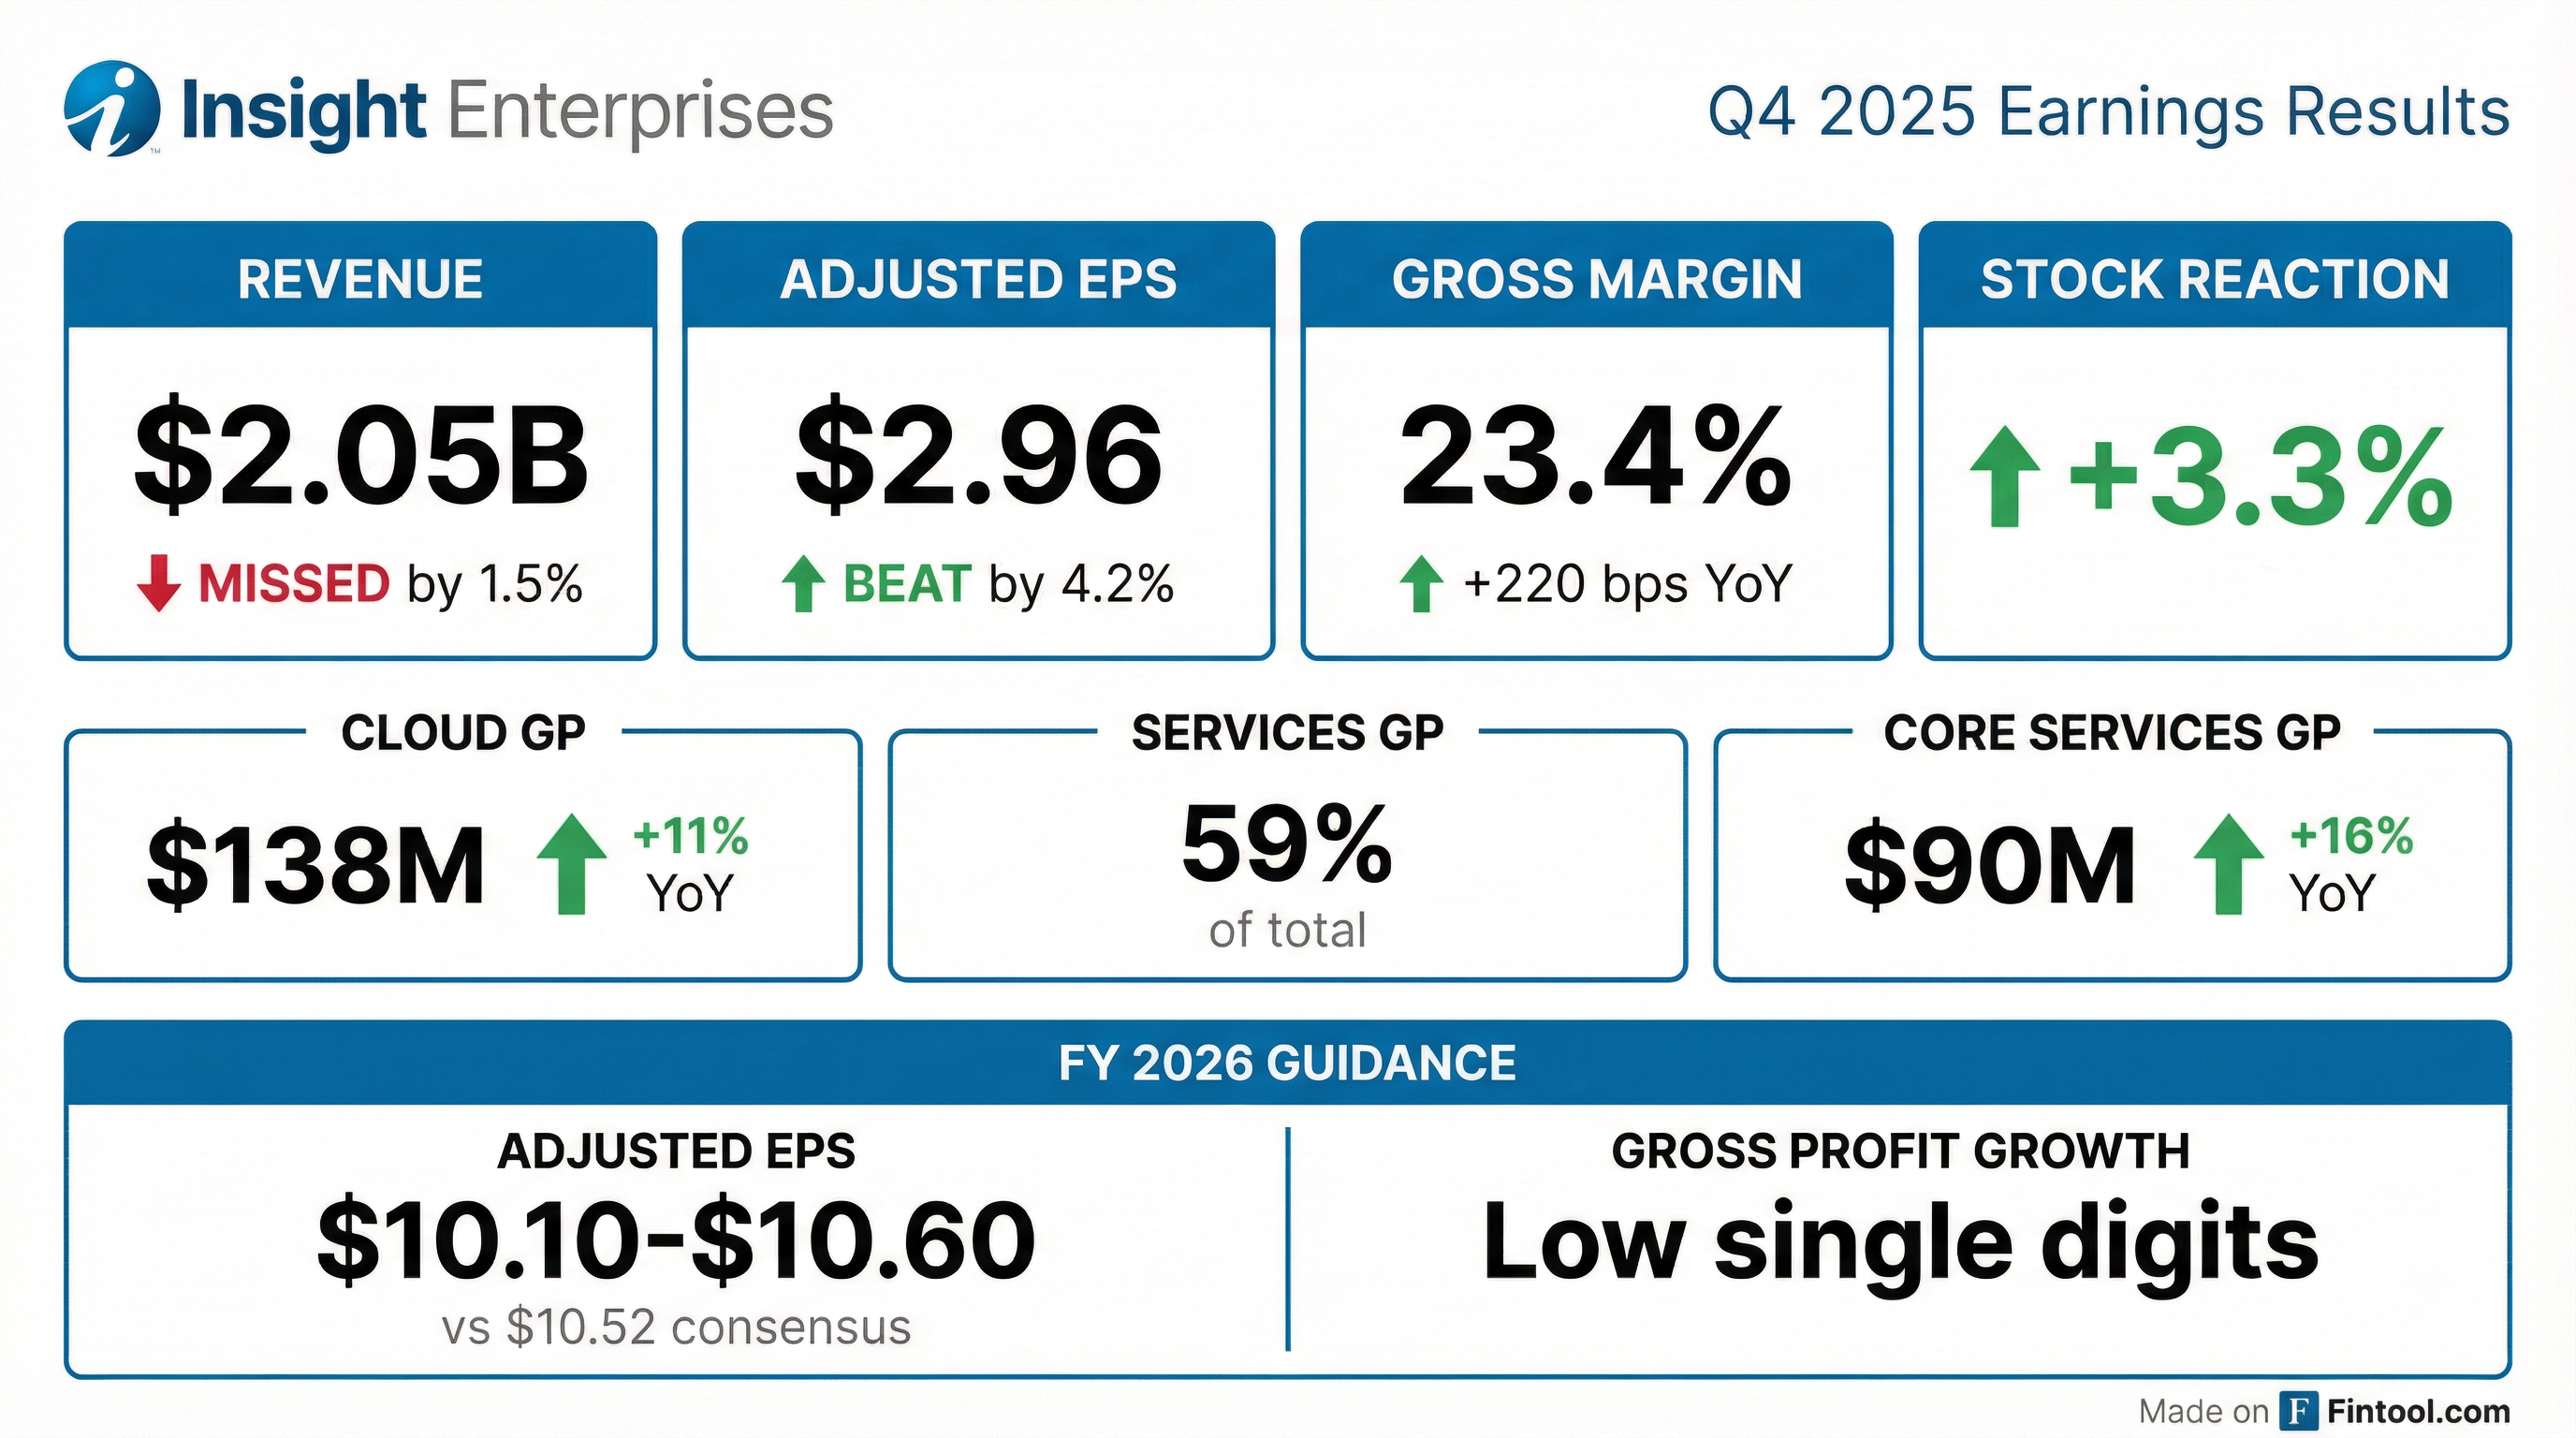
- Insight Enterprises reported Q4 2025 results with a 1% decrease in overall revenue, while total gross profit grew 9% and adjusted diluted EPS increased 11% to $2.96. For the full year 2025, net revenue was $8.2 billion, down 5%, with gross profit flat and adjusted diluted EPS of $9.87.
- The company achieved record gross margin of 23.4% in Q4 2025 and 21.4% for the full year, driven by 11% growth in cloud gross profit and 16% growth in core services gross profit in Q4.
- For fiscal year 2026, Insight Enterprises provided guidance for low single-digit gross profit growth and adjusted diluted EPS (excluding stock-based compensation) between $11 and $11.50, reflecting approximately 5% growth at the midpoint. This outlook is based on cautious optimism and anticipated subdued industry spending.
- Strategically, Insight is positioning itself as an AI-first solutions integrator, expanding capabilities in cloud, data, AI, and cybersecurity through acquisitions and the launch of its AI platform, Prism. The company also increased its share repurchase authorization to $299 million and plans to repurchase $75 million in shares in Q1 2026. A successor for the CEO is expected in the next few months.
- NSIT reported a 1% decrease in overall revenue for Q4 2025, but achieved 9% growth in total gross profit and an 11% increase in adjusted diluted earnings per share to $2.96. For the full year 2025, net revenue was $8.2 billion (down 5%), with gross profit remaining flat and adjusted diluted EPS growing 2% to $9.87.
- Cloud gross profit increased 11% to $138 million in Q4 2025, and core services gross profit grew 16% to $90 million. For the full year 2025, cloud gross profit was $495 million (up 2%) and core services gross profit was $320 million.
- For the full year 2026, NSIT expects low single-digit gross profit growth and adjusted diluted EPS (excluding stock-based compensation) between $11-$11.50, representing approximately 5% growth at the midpoint compared to 2025. Cloud gross profit is anticipated to grow in the low double digits, and core services gross profit in the high single digits.
- The company plans to repurchase $75 million in shares beginning in Q1 2026, following an increase in its share repurchase authorization by $150 million in Q4 2025.
- NSIT is focused on becoming an AI-first solutions integrator, having launched its Prism AI platform and integrated acquisitions like Inspire11 and Sekuro. A search for a successor to the current CEO is underway, with an announcement expected in the next few months.
- Insight Enterprises reported Q4 2025 net revenue of $2 billion, a 1% decrease, with total gross profit growing 9% and adjusted diluted EPS increasing 11% to $2.96. For the full year 2025, net revenue was $8.2 billion, a 5% decrease, and adjusted diluted EPS was $9.87, up 2%.
- Cloud gross profit increased 11% in Q4 2025 to $138 million, and core services gross profit grew 16% to $90 million, contributing to a total gross margin of 23.4%. Full-year cloud gross profit was $495 million, up 2%.
- The company anticipates subdued industry spending and expects low single-digit growth for 2026, with stronger EPS growth projected for the first half due to cloud and hardware performance.
- PC prices are expected to increase by 10% to 20-25% in 2026 due to memory costs, potentially impacting volume. The search for a new CEO is progressing, with a successor expected to be named in the next few months.
- Insight Enterprises reported Q4 2025 net sales decreased 1% year-to-year to $2.0 billion, with gross profit increasing 9% to $478.4 million and diluted earnings per share rising 69% to $1.67.
- For the full year 2025, net sales decreased 5% to $8.2 billion, while gross profit remained flat at $1.8 billion and diluted earnings per share decreased 26% to $4.86.
- The company achieved gross margin expansion of 220 basis points to 23.4% in Q4 2025 and 110 basis points to 21.4% for the full year 2025.
- Cash flows provided by operating activities were $153.8 million for Q4 2025 and $303.8 million for the full year 2025.
- For full year 2026, the company forecasts Adjusted diluted earnings per share between $10.10 and $10.60 (including stock-based compensation) and expects gross profit growth in the low single digits with a gross margin of approximately 21%.
- Insight Enterprises reported that for the fourth quarter of 2025, consolidated net sales decreased 1% year-over-year, while gross profit increased 9% to $478.4 million and Adjusted diluted earnings per share rose 11% to $2.96.
- For the full year 2025, consolidated net sales decreased 5% to $8.2 billion, gross profit was relatively flat at $1.8 billion, and Adjusted diluted earnings per share increased 2% to $9.87.
- The company provided full year 2026 guidance for Adjusted diluted earnings per share (excluding stock-based compensation expense) to be between $11.00 and $11.50, representing 5% growth at the midpoint compared to the 2025 Adjusted diluted EPS of $10.75 (excluding stock-based compensation expense). Gross profit is expected to be in the low single digits and gross margin around 21%.
- Insight Enterprises has expanded its global partnership with Stripe to modernize enterprise financial infrastructure, improve checkout conversion, and leverage AI-driven commerce.
- Insight is an exclusive launch partner for Stripe’s next generation of AI-driven commerce and one of three EMEA launch partners for the Agentic Commerce Protocol (ACP), which allows purchases directly within platforms like ChatGPT.
- The collaboration is supported by Insight's Stripe Center of Excellence, featuring over 100 Stripe-certified architects and payment engineers, to deliver solutions for modern checkout, complex billing, and agentic commerce experiences for large organizations.
Quarterly earnings call transcripts for INSIGHT ENTERPRISES.
Ask Fintool AI Agent
Get instant answers from SEC filings, earnings calls & more