Earnings summaries and quarterly performance for STERIS.
Executive leadership at STERIS.
Daniel Carestio
President and Chief Executive Officer
Adam Zangerle
Senior Vice President, General Counsel and Company Secretary
Cary Majors
Senior Vice President and President, Healthcare
Karen Burton
Senior Vice President and Chief Financial Officer
Mary Clare Fraser
Senior Vice President and Chief Human Resources Officer
Board of directors at STERIS.
Research analysts who have asked questions during STERIS earnings calls.
Brett Fishbin
KeyBanc Capital Markets
8 questions for STE
Jason Bednar
Piper Sandler Companies
8 questions for STE
Michael Polark
Wolfe Research
7 questions for STE
Patrick Wood
Morgan Stanley
7 questions for STE
Mike Matson
Needham & Company, LLC
5 questions for STE
Michael Matson
Needham & Company
3 questions for STE
Jacob Johnson
Stephens Inc.
2 questions for STE
Mason Etoch
Stephens
2 questions for STE
Dave Turklin
Citizens JMP Securities
1 question for STE
Dave Windley
Jefferies LLC
1 question for STE
David Turkaly
Citizens JMP
1 question for STE
Justin Lang
Morgan Stanley
1 question for STE
Mac Etoch
Stephens Inc.
1 question for STE
Mike Polark
Wolfe Research, LLC
1 question for STE
Steven Etoch
Stephens Inc.
1 question for STE
Recent press releases and 8-K filings for STE.
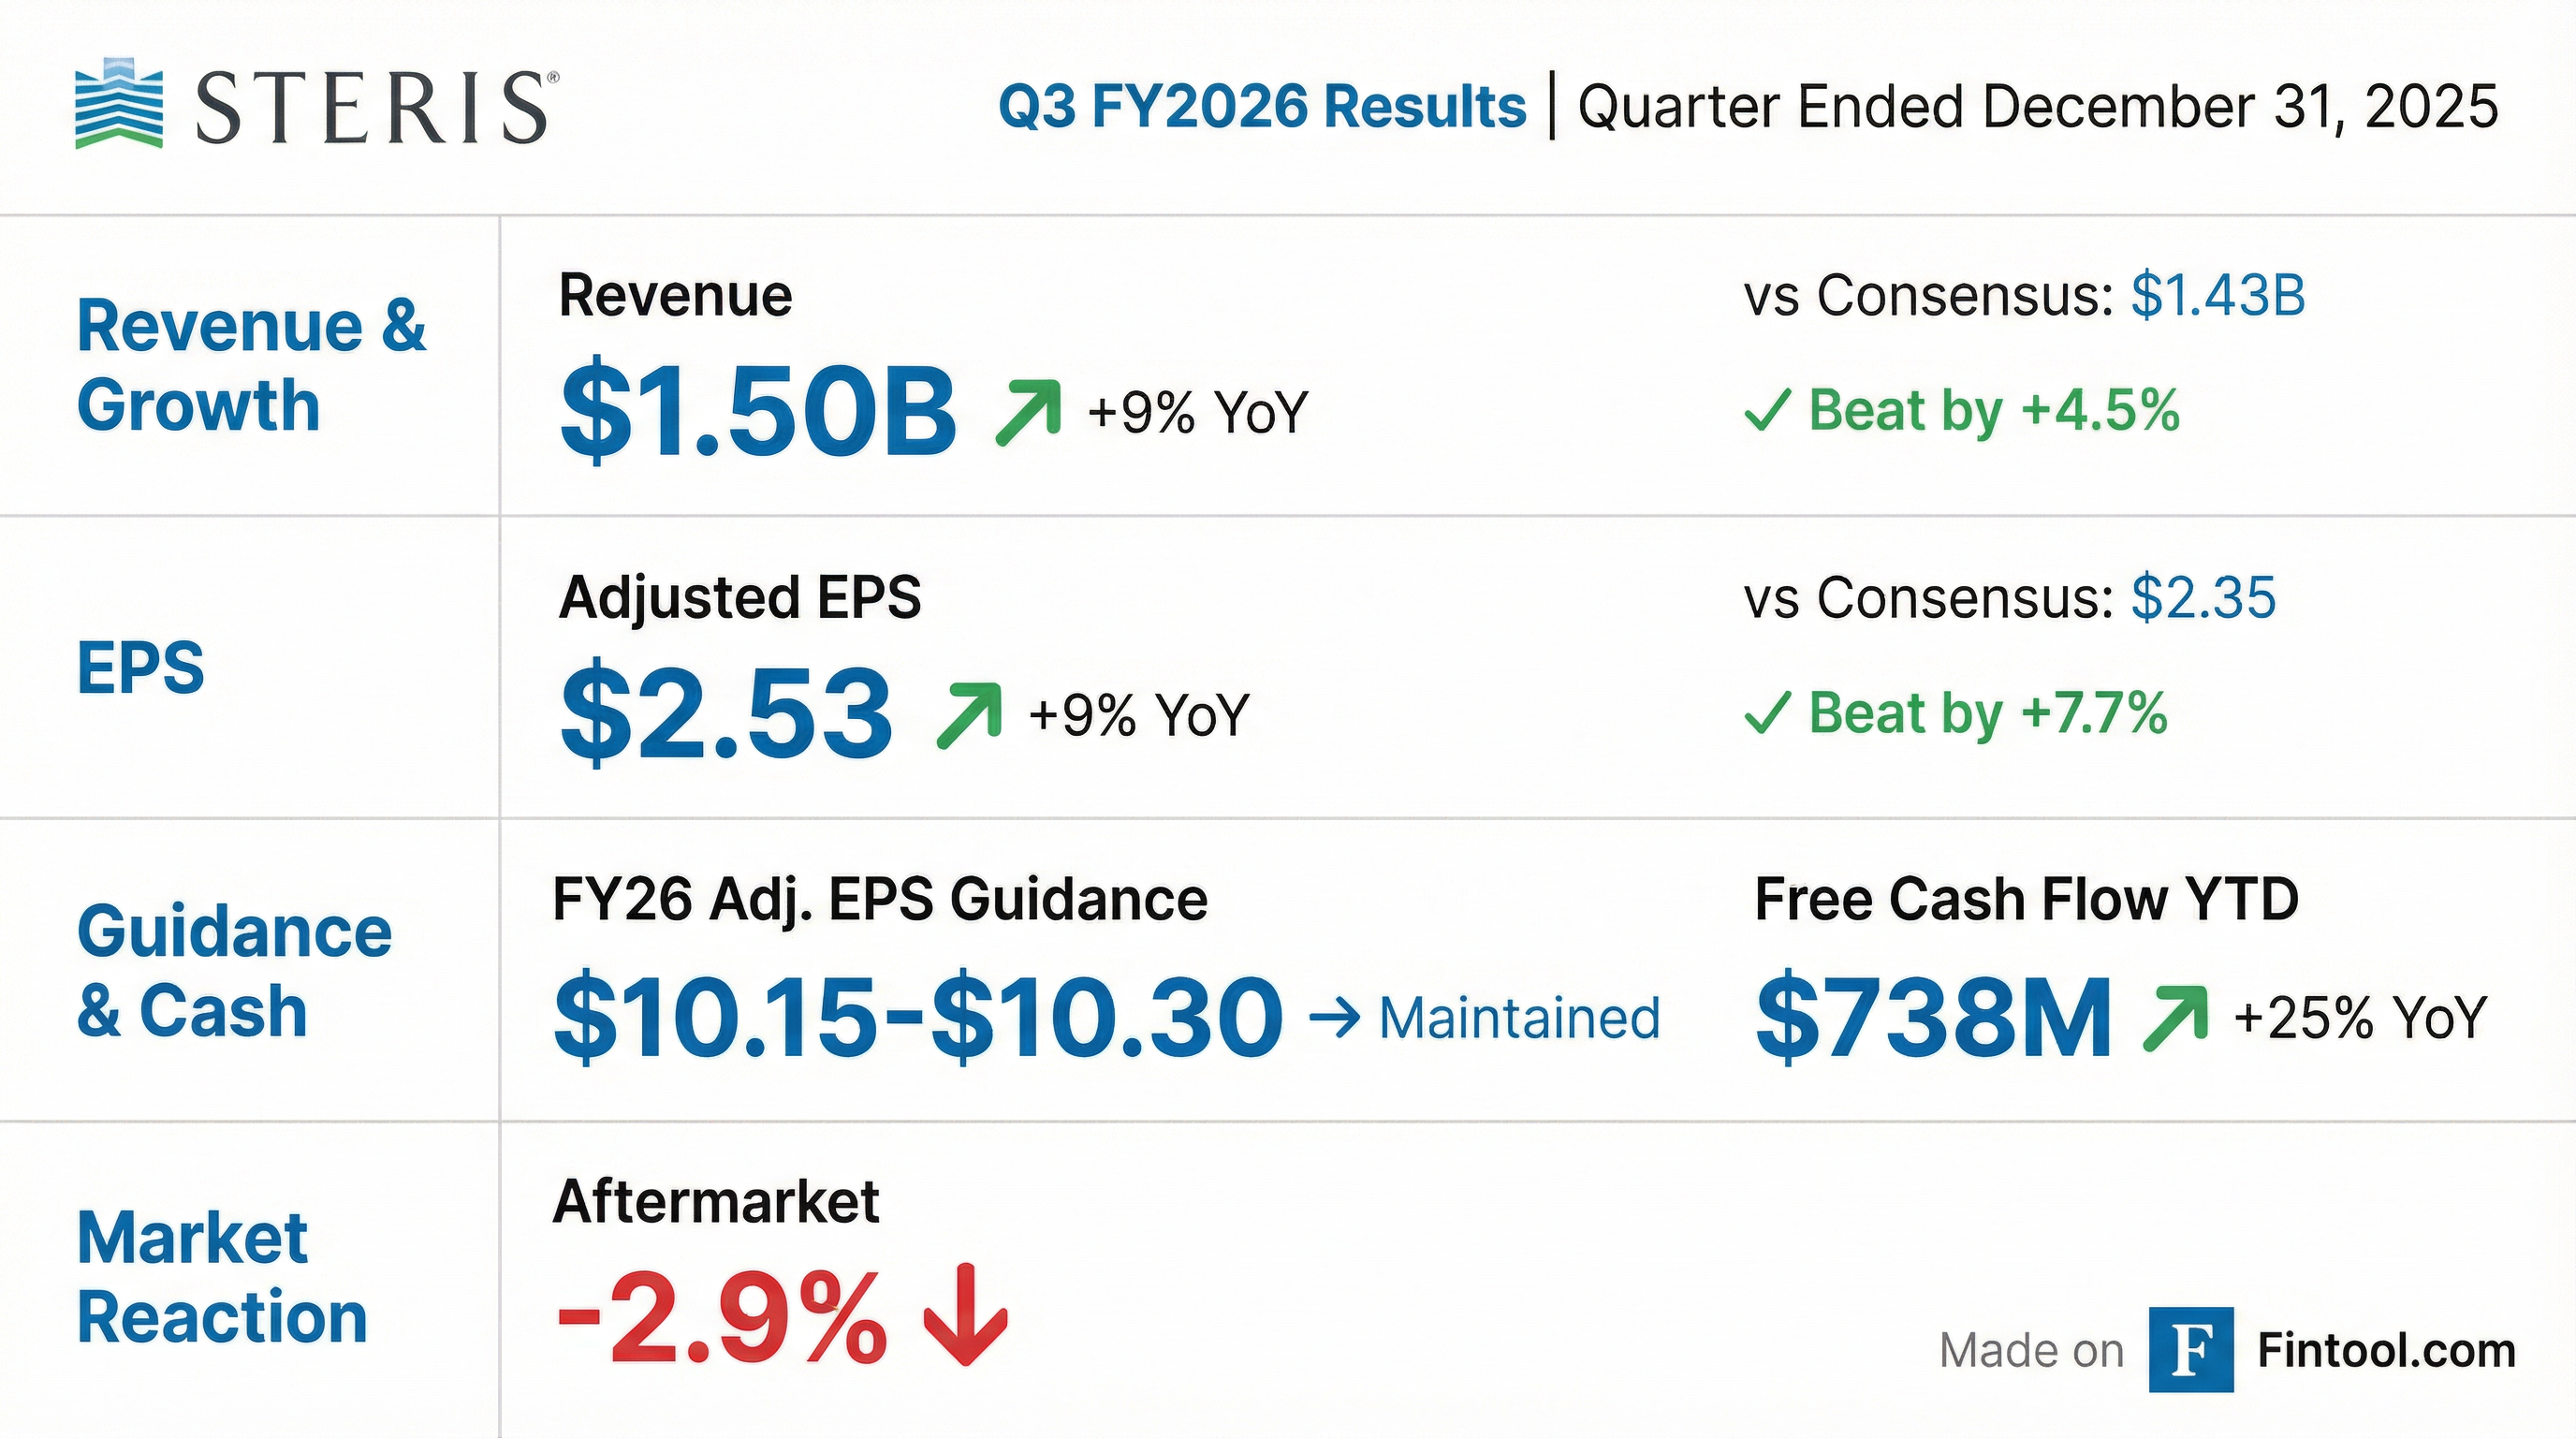
- Total Q3 revenue +9% (organic constant-currency +8%); gross margin 43.9%; EBIT margin 22.9%; adjusted EPS $2.53 (+9%).
- Maintained full-year 2026 guidance: 8–9% revenue growth, $10.15–$10.30 EPS, $850 M free cash flow, CapEx $375 M (tariff impact up $10 M).
- Healthcare segment organic revenue +8% (services +11%, consumables +8%, equipment +7%); backlog >$400 M; YTD orders down 1%; margin 24.3%.
- AST organic revenue +8% (services +9%, equipment +103%; margin 45.1%); Life Sciences organic +5% (consumables +11%, equipment +7%; backlog >$100 M).
- Nine-month free cash flow $736.6 M; CapEx $278.8 M; total debt $1.9 B (gross debt/EBITDA ~1.2×).
- Revenue grew 9% as-reported and 8% constant currency organic; gross margin declined 70 bps to 43.9%, adjusted EPS was $2.53 (+9%).
- Healthcare segment organic revenue increased 8% (Service +11%, Consumables +8%, Capital equipment +7%); Healthcare EBIT margin was 24.3% (-100 bps).
- AST segment organic revenue rose 8% (Services +9%, Capital equipment +103%); AST EBIT margin reached 45.1% (+30 bps).
- Free cash flow for the first nine months was $736.6 M and CapEx $278.8 M; FY26 guidance maintained for revenue growth 8–9%, organic growth 7–8%, EPS $10.15–10.30, FCF $850 M, and CapEx $375 M.
- Total revenue grew 9% year-over-year, with constant currency organic revenue up 8%, adjusted net income of $249.4 million, and EPS of $2.53, a 9% increase; free cash flow for the first nine months was $736.6 million.
- Gross margin declined 70 bps to 43.9% and EBIT margin decreased 40 bps to 22.9%.
- Segment performance included Healthcare organic growth of 8% (Services +11%, Consumables +8%, Capital Equipment +7%; backlog >$400 million), AST organic growth of 8% (Services +9%, Capital Equipment +103%; EBIT margin 45.1%), and Life Sciences organic growth of 5% (Consumables +11%, Capital Equipment +7%; backlog >$100 million).
- FY 2026 guidance was maintained for 8–9% reported revenue growth, 7–8% constant currency organic growth, EPS of $10.15–$10.30, free cash flow of $850 million, and CapEx of $375 million, with an incremental $10 million in tariffs.
- Total revenue from continuing operations grew 9% to $1.5 billion, with 8% constant currency organic growth.
- As-reported EPS rose to $1.96, while adjusted EPS increased to $2.53.
- Healthcare segment revenues were $1.1 billion (+9%); AST revenues $286.6 million (+11%); Life Sciences revenues $145.8 million (+7%).
- Company maintains fiscal 2026 outlook, expecting 8–9% revenue growth and adjusted EPS of $10.15–$10.30.
- Total revenue from continuing operations up 9% to $1.5 billion; constant currency organic revenue growth of 8%.
- As reported EPS from continuing operations rose to $1.96, while adjusted EPS increased to $2.53.
- Healthcare segment revenue grew 9% to $1.1 billion; AST revenue rose 11% to $286.6 million; Life Sciences revenue advanced 7% to $145.8 million.
- Fiscal 2026 outlook maintained, with expected revenue growth of 8–9% and adjusted EPS of $10.15–$10.30.
- Total as-reported revenue grew 10%, with constant currency organic revenue up 9% (210 bps price contribution).
- Gross margin rose 60 bps to 44.3%, and EBIT margin increased 90 bps to 23.1%, driven by price, productivity, and operating‐expense leverage.
- Adjusted EPS from continuing operations was $2.47, up 15%, and net income reached $244.5 million.
- Free cash flow for the first half was $527.7 million; total debt was $1.9 billion with gross-to-EBITDA of ~1.2×.
- FY 2026 guidance raised to 8–9% as-reported revenue growth (7–8% constant currency organic), EPS of $10.15–$10.30, EBIT margin expansion of 10–20 bps, and free cash flow of $850 million.
- Revenue grew 10% year-over-year (constant-currency organic growth 9%), with gross margin up 60 bps to 44.3% and EBIT margin up 90 bps to 23.1% in Q2 FY 2026.
- Healthcare revenue rose on a constant-currency organic basis by 9%, led by service (+13%), consumables (+10%) and capital equipment (+4%; backlog > $400 million); AST services grew 13% (AST EBIT margin 45.3%); Life Sciences revenue grew 12%, driven by capital equipment (+39%; backlog $114 million).
- Free cash flow in H1 FY 2026 was $527.7 million, debt stood at $1.9 billion with gross/EBITDA ~1.2x at quarter-end.
- Full-year guidance raised: as-reported revenue growth 8%–9%, constant-currency organic revenue growth 7%–8%, adjusted EPS $10.15–$10.30, and free cash flow $850 million.
- In Q2, revenue grew 10%, with 9% constant currency organic growth; gross margin improved 60 bps to 44.3%, EBIT margin rose 90 bps to 23.1%, net income was $244.5 M, and adjusted EPS was $2.47 (+15%).
- Healthcare segment organic revenue +9% (service +13%, consumables +10%, capital equipment +4%, backlog >$400 M); AST organic +7% (services +13%, EBIT margin 45.3% +250 bps); Life Sciences organic +12% (capital equipment +39%, margin –70 bps).
- Raised fiscal 2026 outlook: as-reported revenue +8–9%, constant currency organic +7–8%, EPS $10.15–$10.30, EBIT margin +10–20 bps, effective tax ~24%, free cash flow $850 M, and CapEx ~$375 M.
- First-half free cash flow reached $527.7 M, ending debt was $1.9 B (gross debt/EBITDA ~1.2×).
- Reported $1.5 billion in total revenue from continuing operations, a 10% increase year-over-year, with 9% constant currency organic growth.
- As-reported EPS from continuing operations rose to $1.94, while adjusted EPS climbed to $2.47, both up versus Q2 FY 2025.
- All three segments drove growth: Healthcare revenue up 9% to $1,033.8 million; Applied Sterilization Technologies up 10% to $281.5 million; Life Sciences up 13% to $145.0 million.
- Company upgraded its full-year fiscal 2026 outlook for constant currency organic revenue, EPS and free cash flow.
- STERIS posted a 10% year-over-year rise in Q2 revenue to $1.5 billion, with 9% constant currency organic growth.
- As reported EPS from continuing operations climbed to $1.94, while adjusted EPS reached $2.47, versus $1.51 and $2.14 a year ago, respectively.
- Q2 segment performance: Healthcare revenue up 9% to $1,033.8 million; AST revenue up 10% to $281.5 million; Life Sciences revenue up 13% to $145.0 million.
- First-half net cash from operations was $707.8 million; free cash flow totaled $527.7 million, driven by earnings growth and working capital improvements.
- Fiscal 2026 guidance raised: constant currency organic revenue growth now 7–8%, adjusted EPS outlook $10.15–$10.30, and free cash flow target $850 million.
Quarterly earnings call transcripts for STERIS.
Ask Fintool AI Agent
Get instant answers from SEC filings, earnings calls & more