Earnings summaries and quarterly performance for AMERICAN EXPRESS.
Executive leadership at AMERICAN EXPRESS.
Board of directors at AMERICAN EXPRESS.
Charles E. Phillips
Director
Christopher D. Young
Director
Daniel L. Vasella
Director
Deborah P. Majoras
Director
John J. Brennan
Lead Independent Director
Karen L. Parkhill
Director
Lisa W. Wardell
Director
Lynn A. Pike
Director
Michael J. Angelakis
Director
Noel Wallace
Director
Randal K. Quarles
Director
Theodore J. Leonsis
Director
Thomas J. Baltimore
Director
Research analysts who have asked questions during AMERICAN EXPRESS earnings calls.
Craig Maurer
FT Partners
7 questions for AXP
Jeffrey Adelson
Morgan Stanley
7 questions for AXP
Mark DeVries
Deutsche Bank
7 questions for AXP
Mihir Bhatia
Bank of America
7 questions for AXP
Ryan Nash
Goldman Sachs & Co.
6 questions for AXP
Sanjay Sakhrani
Keefe, Bruyette & Woods (KBW)
6 questions for AXP
Brian Foran
Truist Financial
5 questions for AXP
Donald Fandetti
Wells Fargo & Company
5 questions for AXP
Erika Najarian
UBS
5 questions for AXP
Moshe Orenbuch
TD Cowen
5 questions for AXP
Cristopher Kennedy
William Blair & Company
4 questions for AXP
Richard Shane
JPMorgan Chase & Co.
4 questions for AXP
Terry Ma
Barclays
4 questions for AXP
Rick Shane
JPMorgan Chase & Co.
3 questions for AXP
Cris Kennedy
William Blair
2 questions for AXP
Don Fandetti
Wells Fargo
2 questions for AXP
John Pancari
Evercore ISI
2 questions for AXP
L. Erika Penala
UBS
2 questions for AXP
Robert Wildhack
Autonomous Research
2 questions for AXP
Saul Martinez
HSBC
2 questions for AXP
Gustavo Gala
Monness, Crespi, Hardt & Co., Inc.
1 question for AXP
Stephen Sakhrani
Keefe, Bruyette & Woods
1 question for AXP
Recent press releases and 8-K filings for AXP.
- American Express’s premiumization focus has driven card fees at a 17% CAGR since 2018 and management expects card fee growth to accelerate from 16% current levels to high-teens by Q4 2026.
- The recent Platinum card refresh outpaces prior launches, lifting average fee per account markedly in Q4 and achieving 99% retention on back-book repricing for consumer cards.
- International continues robust expansion, with Gen Z and millennial segments growing 20% year-over-year in Q4 2025 versus 15% in the U.S., supported by low initial market share (~6%) and merchant coverage extensions.
- A planned $5 billion technology investment in 2026 is driving operational leverage—operating expenses/revenue declined from 26% to 22%—through digital self-service adoption and AI-led servicing efficiencies.
- Global spend grew 7–8% in 2025, with travel & entertainment up—including 9% front-of-cabin and 12% luxury lodging—and holiday shopping spend up 9%; consumer credit remains strong with delinquency at 1.3%.
- Marketing shifted to premium, fee-paying cards in Q4 2025 despite 1.3 million new accounts (vs 1.5 million in Q3), lifting the average fee per account and prioritizing high-value customers.
- The Platinum refresh outperformed Gold/Delta, achieving the lowest cost per account in two years, 99% retention on repriced back book, 30% surge in travel bookings and 20% rise in Resy spend in Q4.
- $5 billion in annual tech investments have driven OpEx/revenue down from 26% to 22%, increased digital self-service (63% of Gen Z interactions online vs 13% for Baby Boomers) and improved servicing efficiency.
- Management plans ongoing share buybacks supported by 36% ROE, mid-teens EPS growth and disciplined capital allocation following the Center expense-management acquisition slated for a mid-2026 launch.
- Average fee per new account rose from $164 in Q1’24 to $282 in Q4’25
- New cards acquired remained at 1.5 million per quarter through Q3’25 before easing to 1.3 million in Q4’25
- In FY 2025, average spend per account on U.S. Consumer Platinum was ~10× that of Blue Cash Everyday
- New accounts acquired exclude supplemental cards issued on those accounts
- Global cardmember spending remained strong, with 7–8% growth overall, front-of-cabin T&E up 9%, luxury lodging up 12%, and U.S. holiday shopping up 9%, while credit metrics stayed very healthy with low write-off and delinquency rates.
- Card fees have grown at a 17% CAGR since 2018–19, and AmEx is guiding to high-teens fee growth by end-2026; Q4 average fee per new account jumped as marketing shifted toward premium Platinum cards.
- The Platinum refresh outperformed prior launches, achieving 99% consumer retention, lowest cost per acquisition in two years, a 30% rise in travel bookings and 20% increase in Resy spending.
- The Pay Over Time feature drove 50% of 2025 balance growth among premium cardmembers, with revolving balances exhibiting strong credit performance.
- Investing $5 billion annually in technology reduced OpEx/revenue from 26% to 22%, enabled 63% of Gen Z interactions to self-serve digitally with high satisfaction, and underpins ongoing share repurchases alongside a 36% ROE.
- Delivered 10% revenue growth to a record $72 billion in FY2025 and EPS of $15.38, up 15% excluding the Accertify gain.
- In Q4 2025, net card fees rose 16% FX-adjusted, net interest income increased 12%, and VCE-to-revenue was 45%; 2026 guidance calls for 9–10% revenue growth, EPS of $17.30–$17.90, and a 16% dividend hike to $0.95/share.
- Invested $6.3 billion in marketing (up ~75% since 2019) and increased technology spend by 11% in 2025; plans for record technology development and sustained high marketing and VCE investment in 2026 to drive premium product momentum.
- Returned $7.6 billion of capital in 2025 with an ROE of 34%, comprising $2.3 billion in dividends and $5.3 billion in share repurchases.
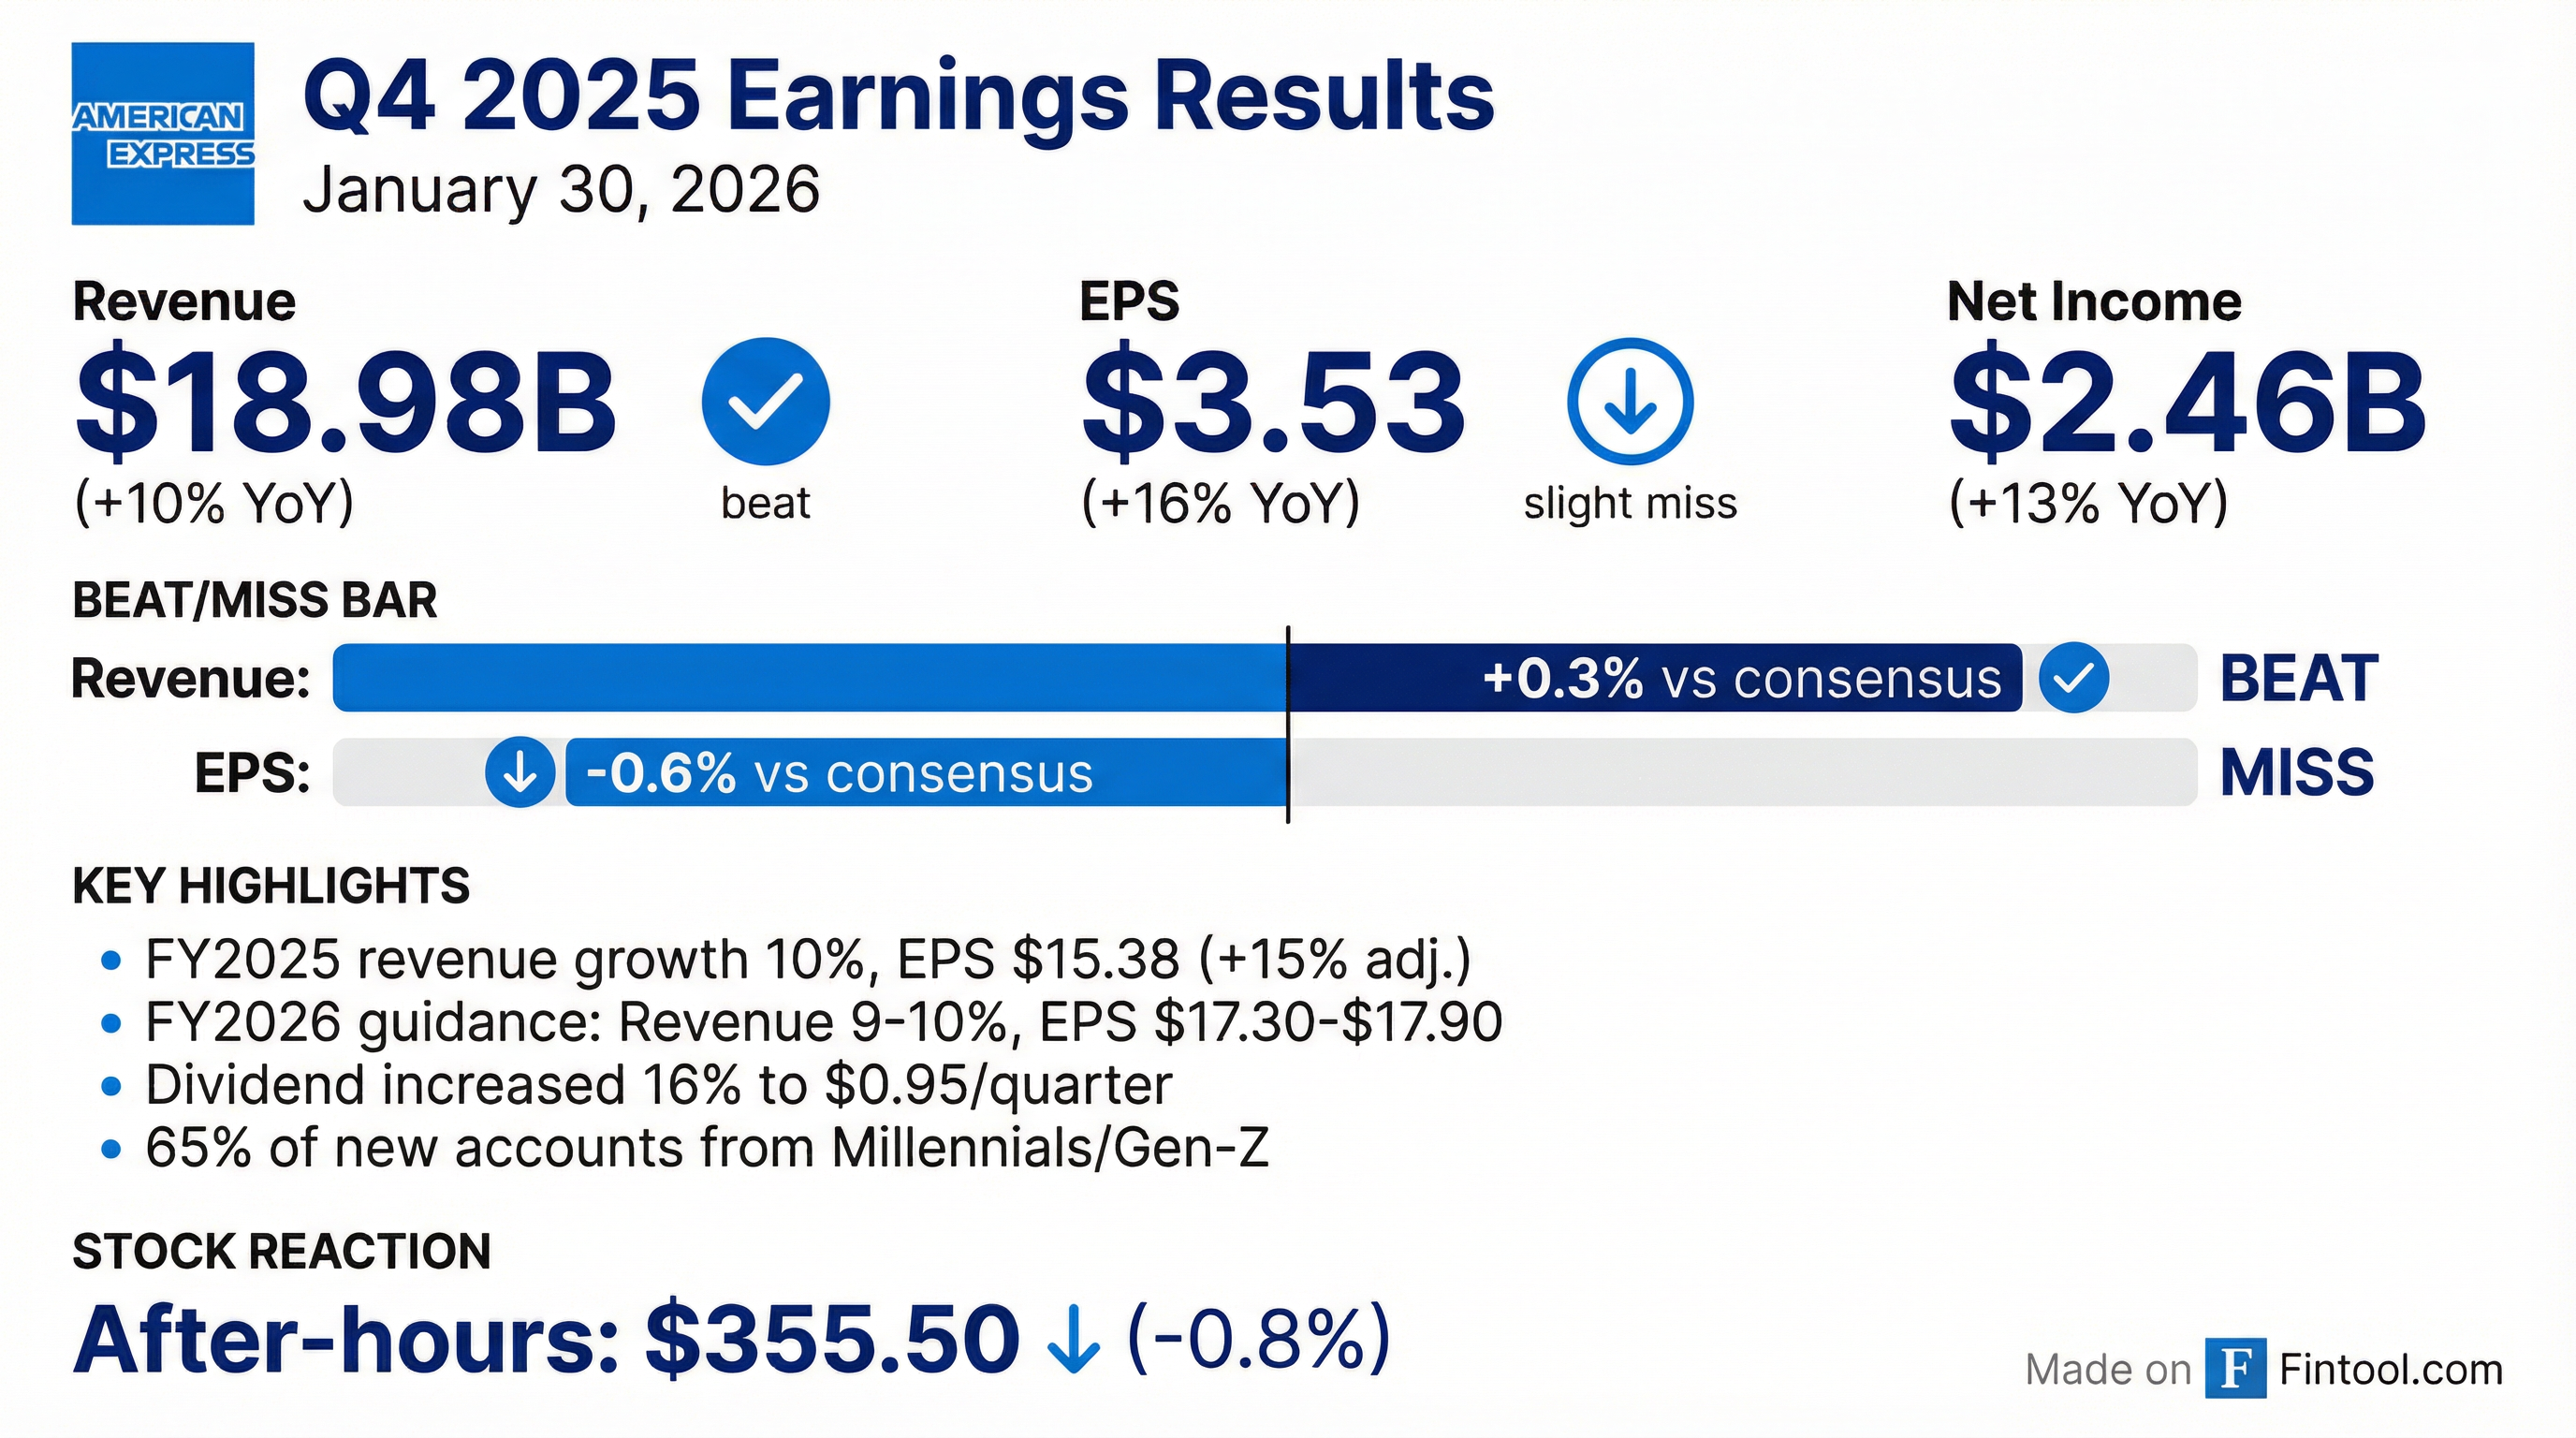
- Q4'25 revenues net of interest expense were $18.98 B, up 10% YoY; FY 2025 revenues totaled $72.23 B, up 10%, with FY 2025 EPS of $15.38, up 15% adjusted(0).
- Q4'25 net income was $2.46 B, up 13% YoY, and diluted EPS was $3.53, up 16%; average diluted shares outstanding were 688 M, down 2%(0).
- FY 2026 guidance expects revenue growth of 9–10% and EPS of $17.30–$17.90(0).
- Quarterly dividend increased 16% to $0.95 per share, and the British Airways cobrand partnership was extended(0).
- Full-year revenues of $72 billion (+10%) and EPS of $15.38 (+15% ex-Accertify) mark record performance in 2025.
- Net card fees rose 18% to $10 billion, with net interest income up 12% and service fees also growing at double-digit rates in Q4.
- 2026 guidance: revenue growth of 9–10%, EPS of $17.30–$17.90, and a 16% dividend increase to $0.95 per share.
- Returned $7.6 billion of capital in 2025 (dividends $2.3 billion; share repurchases $5.3 billion) and achieved 34% ROE.
- Full-year revenues rose 10% to $72 billion and EPS grew 15% to $15.38 (excluding the Accertify gain).
- 2026 guidance calls for 9–10% revenue growth, EPS of $17.30–17.90, and a 16% dividend increase to $0.95 per share.
- Returned $7.6 billion of capital in 2025—$2.3 billion in dividends and $5.3 billion in share repurchases—with ROE of 34%.
- Continued focus on premium customer growth: launched new U.S. Consumer and Small Business Platinum cards, refreshed products in a dozen countries, and invested $6.3 billion in marketing and $5 billion annually in technology.
- Delivered FY 2025 revenues net of interest expense of $72.2 B, up 10% YoY (9% FX-adjusted), with EPS of $15.38, up 10% (15% adjusted).
- In Q4 2025, achieved revenues net of interest expense of $19.0 B (up 10% YoY, 9% FX-adjusted), net income of $2.46 B and diluted EPS of $3.53, up 16%.
- Q4 Card Member spend grew 9% (8% FX-adjusted), with net card fee revenues posting double-digit growth for the 30th straight quarter.
- For FY 2026, expects revenue growth of 9–10%, EPS of $17.30–$17.90, and will boost the quarterly dividend by ~16% to $0.95 per share.
- Reported Q4 profit of $2.43 billion ($3.53/share) on revenue of $18.98 billion; billed business rose ~9% and luxury/retail spending was up double digits, though the stock dipped after the release.
- Expenses increased about 10%, with provisions for credit losses of $1.4 billion and a net write-off rate of ~2.1%.
- Guided 2026 revenue growth of 9–10% and EPS of $17.30–$17.90; quarterly dividend to rise ~16% to $0.95.
- Highlighted strength among Gen Z and millennial cardholders supporting travel, dining and luxury spending, and extended its British Airways cobranded card partnership.
Quarterly earnings call transcripts for AMERICAN EXPRESS.
Ask Fintool AI Agent
Get instant answers from SEC filings, earnings calls & more