Earnings summaries and quarterly performance for Azenta.
Research analysts who have asked questions during Azenta earnings calls.
Andrew Cooper
Raymond James
7 questions for AZTA
David Saxon
Needham & Company
7 questions for AZTA
Paul Knight
KeyBanc Capital Markets
6 questions for AZTA
Vijay Kumar
Evercore ISI
6 questions for AZTA
Brendan Smith
Stifel, Nicolaus & Company, Incorporated
4 questions for AZTA
Mac Etoch
Stephens Inc.
4 questions for AZTA
Matthew Stanton
Jefferies
4 questions for AZTA
Jacob Johnson
Stephens Inc.
2 questions for AZTA
Mackenzie Strehle
Evercore Inc.
2 questions for AZTA
Matt Stanton
Jefferies Financial Group Inc.
2 questions for AZTA
David Saxon
Needham
1 question for AZTA
Hannah Hefley
Stephens
1 question for AZTA
Jacqueline
Oppenheimer & Co. Inc.
1 question for AZTA
Lucas Baranowski
KeyBanc Capital Markets Inc.
1 question for AZTA
Matthew Parisi
KeyBanc Capital Markets Inc.
1 question for AZTA
Recent press releases and 8-K filings for AZTA.
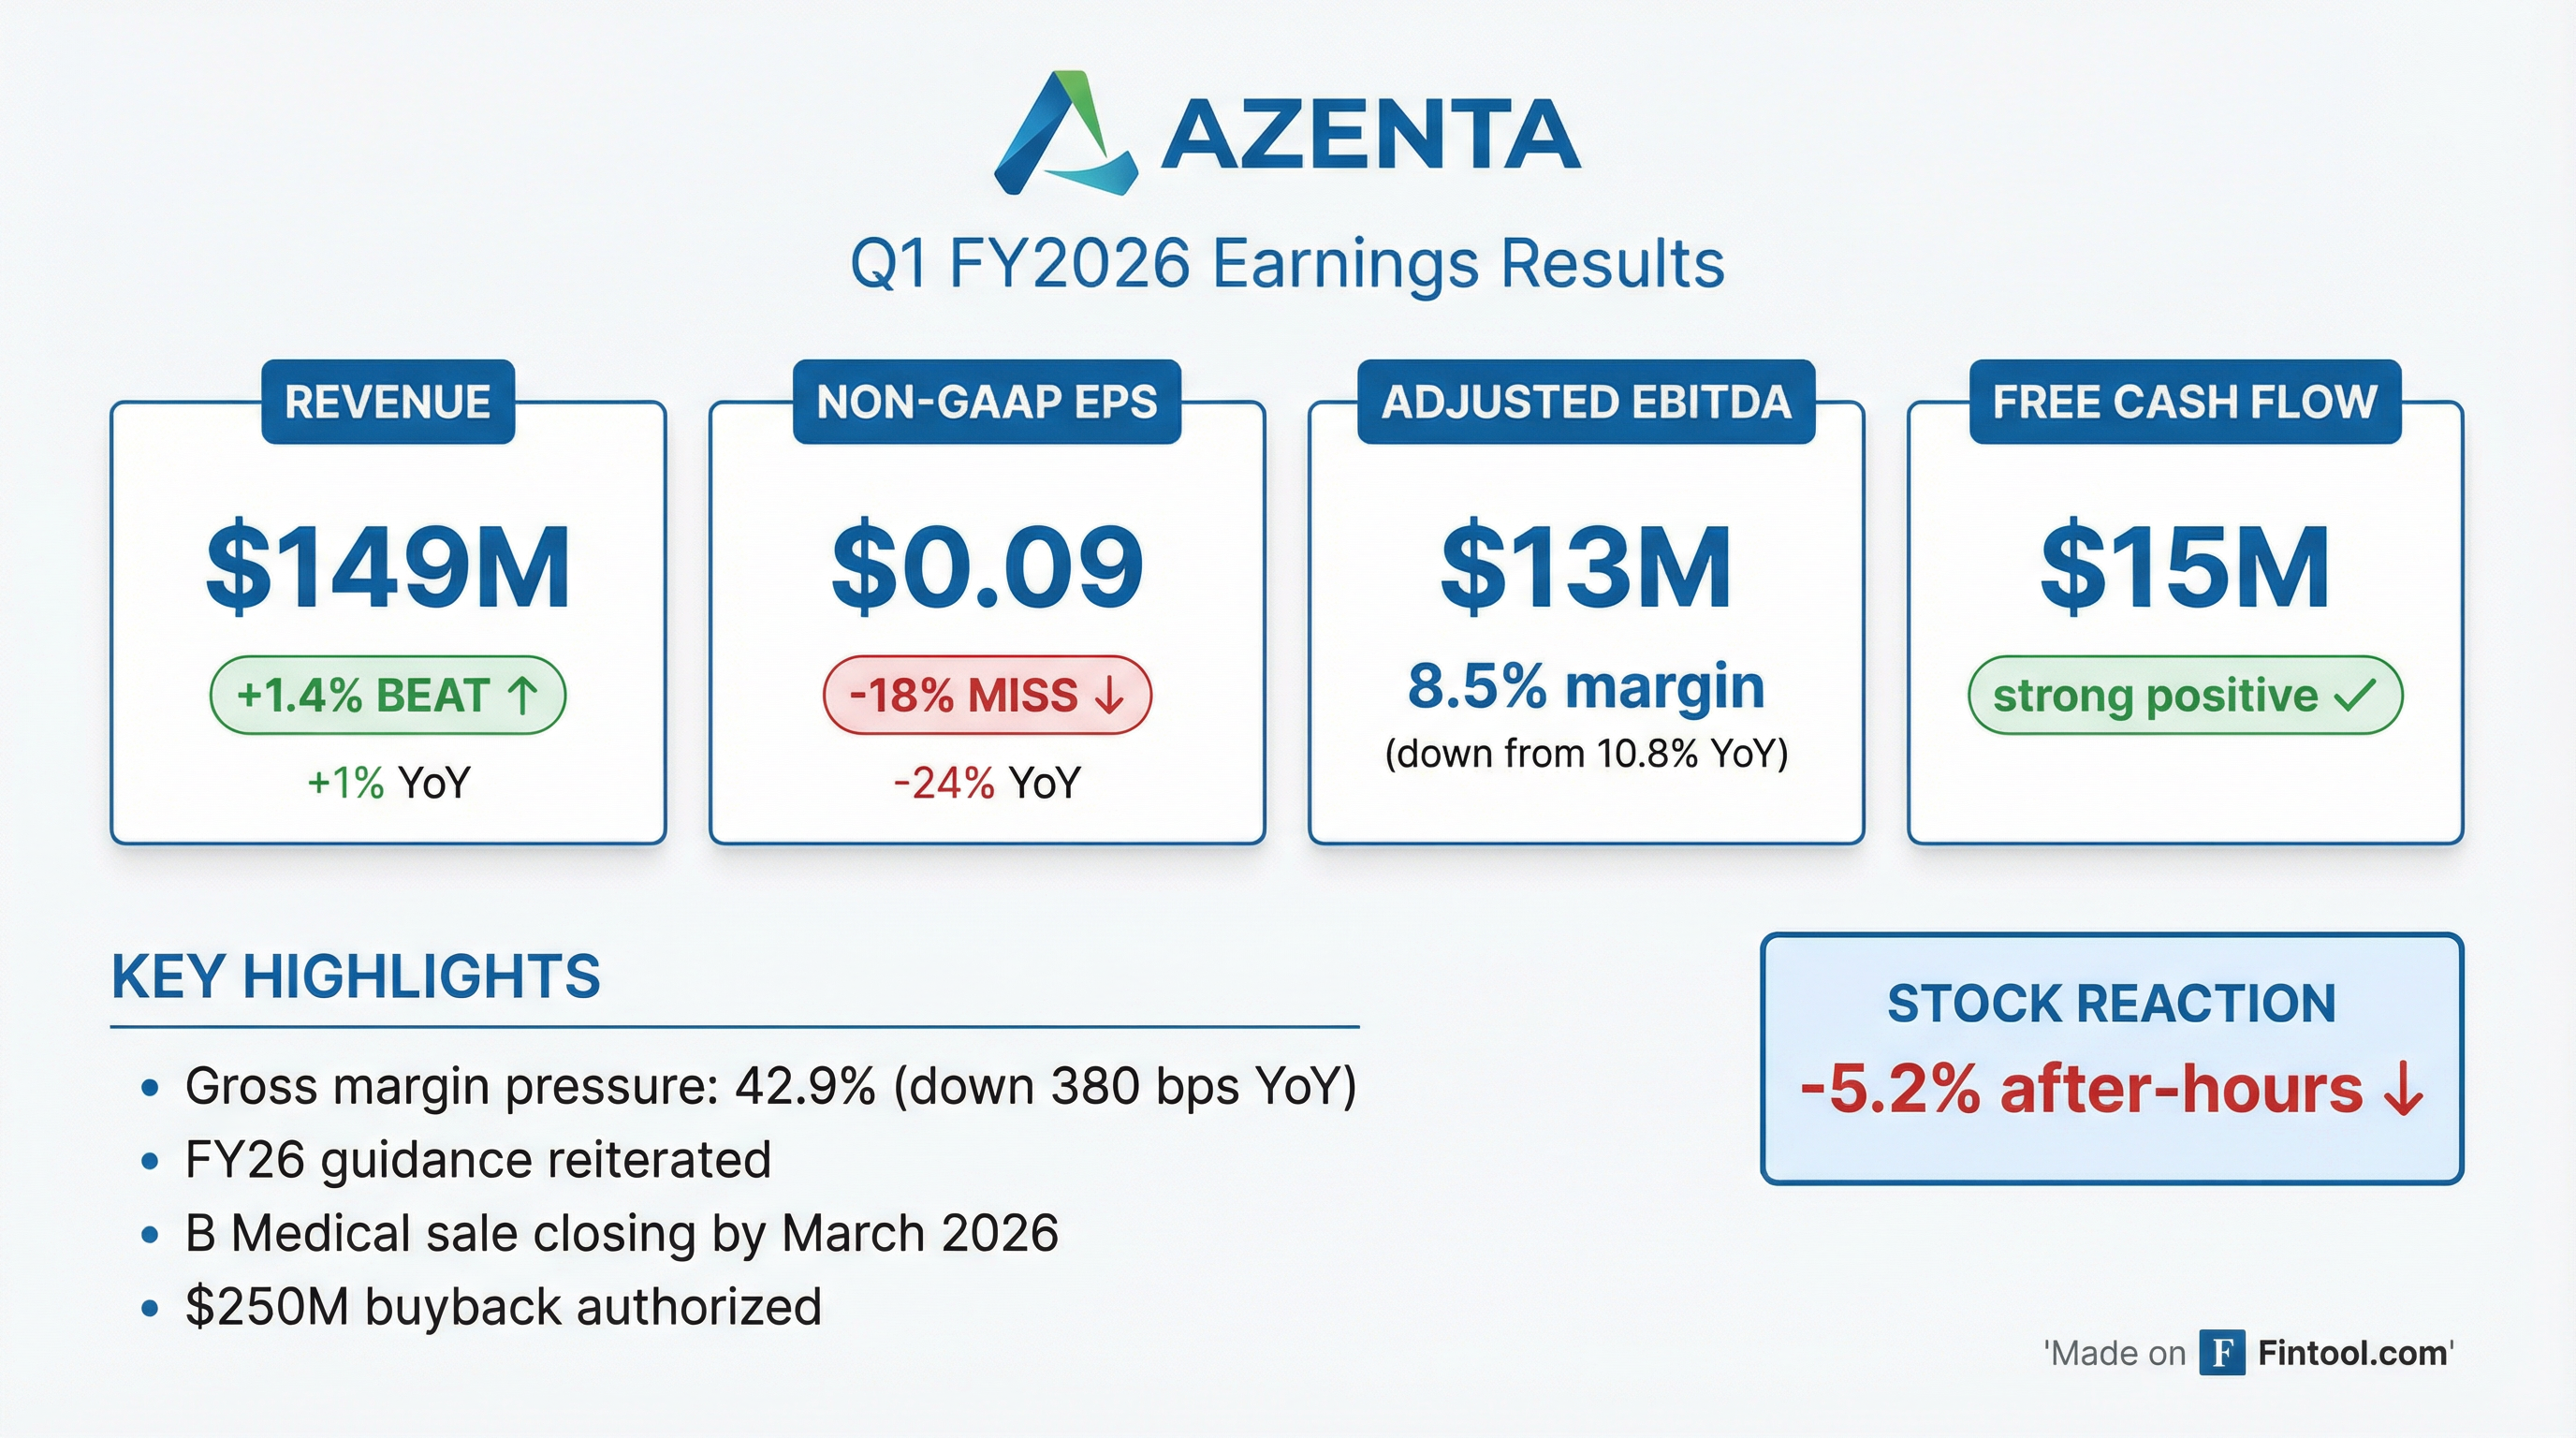
- For Q1 2026, Azenta Life Sciences reported revenue of $149 million, an increase of 1% reported but a decrease of 1% organically, with Multiomics organic growth flat and Sample Management Solutions down 2% organically.
- The company's profitability for Q1 2026 included an Adjusted EBITDA margin of 8.5% and Non-GAAP EPS of $0.09.
- Azenta generated $15 million in free cash flow during Q1 2026 and maintained a strong balance sheet with $581 million in cash, cash equivalents, restricted cash, and marketable securities, and no outstanding debt as of December 31, 2025.
- For fiscal year 2026, Azenta anticipates organic revenue growth of 3% to 5% year-over-year and approximately 300 basis points of Adjusted EBITDA margin expansion.
- Azenta reported Q1 2026 revenue of $149 million, reflecting a 1% reported increase and a 1% organic decline, with non-GAAP EPS of $0.09 and an Adjusted EBITDA margin of 8.5%. The gross margin was 44.1%, impacted by underutilized lab capacity and rework costs on Automated Stores projects, with remediation efforts expected to conclude by the end of Q2 2026.
- The company reaffirmed its fiscal year 2026 guidance, projecting organic revenue growth in the range of 3%-5% and approximately 300 basis points of year-over-year Adjusted EBITDA margin expansion. Management anticipates acceleration in the second half of 2026, despite Q1 organic revenue declining in line with expectations due to continued macro uncertainty and weak capital spending.
- Azenta ended the quarter with a strong financial position, holding $571 million in cash, cash equivalents, and marketable securities, and its board approved a $250 million share repurchase authorization in December 2025.
- Azenta reported Q1 2026 total revenue of $149 million, reflecting a 1% reported increase and a 1% organic decline, with non-GAAP EPS of $0.09 and an Adjusted EBITDA margin of 8.5%.
- The company reaffirmed its fiscal 2026 guidance, projecting 3%-5% organic revenue growth and approximately 300 basis points of Adjusted EBITDA margin expansion.
- Q1 performance was impacted by higher costs in Automated Stores due to quality issues and lab inefficiencies from lower North America volumes, which contributed to a 360 basis point decline in gross margin year-over-year.
- Strategic initiatives include a definitive agreement for the sale of B Medical, expected to close by March 31, 2026, and a $250 million share repurchase authorization approved in December 2025.
- Azenta reported Q1 2026 total revenue of $149 million, up 1% reported and down 1% organically, with non-GAAP EPS of $0.09.
- The Adjusted EBITDA margin for Q1 2026 was 8.5%, a decrease of 230 basis points year-over-year, primarily due to gross margin pressures from underutilized lab capacity and rework costs on Automated Stores projects.
- The company reaffirmed its fiscal 2026 guidance, expecting organic revenue growth of 3%-5% and Adjusted EBITDA margin expansion of approximately 300 basis points, with acceleration anticipated in the second half of the year.
- Azenta expects the sale of B Medical to close by March 31, 2026, and has a $250 million share repurchase authorization approved in December 2025.
- Azenta reported revenue from continuing operations of $149 million for the first quarter ended December 31, 2025, an increase of 1% year-over-year, though organic revenue declined 1%.
- Diluted EPS from continuing operations was ($0.11), while Non-GAAP Diluted EPS from continuing operations was $0.09 for Q1 FY2026. Adjusted EBITDA from continuing operations was $13 million, with an 8.5% margin.
- The company ended the quarter with $571 million in cash, cash equivalents, restricted cash, and marketable securities, and generated $15 million in free cash flow.
- Azenta reiterated its fiscal year 2026 guidance, expecting total organic revenue growth of 3% to 5% and Adjusted EBITDA margin expansion of approximately 300 basis points. Additionally, a new $250 million share repurchase program was approved, and a definitive agreement was signed to sell B Medical Systems for $63 million, with the transaction expected to close on or before March 31, 2026.
- For the first quarter ended December 31, 2025, Azenta reported revenue from continuing operations of $149 million, diluted EPS from continuing operations of ($0.11), and Non-GAAP diluted EPS from continuing operations of $0.09.
- The company entered into a definitive agreement to sell its B Medical Systems business for $63 million, with the transaction expected to close on or before March 31, 2026. The results of B Medical Systems are treated as discontinued operations.
- Azenta's Board of Directors approved a new share repurchase program authorizing up to $250 million of common stock repurchases through December 31, 2028.
- The company reiterated its fiscal year 2026 guidance, expecting total organic revenue growth in the range of 3% to 5% and Adjusted EBITDA margin expansion of approximately 300 basis points relative to fiscal 2025.
- Azenta reported Fiscal 2025 as a turnaround year, ending with a strong cash balance of $546 million.
- The company announced a $250 million share repurchase program and a definitive agreement to divest B Medical, with the transaction expected to close by March 31, 2026.
- At the 2026 Annual Meeting, shareholders approved all four proposals, including the election of 10 directors, the non-binding advisory vote on executive compensation, an amendment to the 2020 Equity Incentive Plan to increase shares by 2,750,000, and the ratification of PwC as independent auditors for fiscal year 2026.
- Azenta reported a turnaround year in fiscal 2025, achieving growth in core businesses and meaningful margin expansion.
- The company ended fiscal year 2025 with a strong cash balance of $546 million and announced a $250 million share repurchase program.
- A definitive agreement was reached to divest B Medical, with the transaction anticipated to close by March 31, 2026.
- Shareholders approved all four proposals, including the election of 10 directors, the non-binding advisory vote on executive compensation, an amendment to increase shares reserved for the 2020 Equity Incentive Plan by 2,750,000, and the ratification of PwC as independent auditors for fiscal year 2026.
- Azenta, Inc. (AZTA) announced on December 29, 2025, that its subsidiary, Azenta Germany GmbH, entered into a definitive agreement to sell its B Medical Systems business to Thelema S.À R.L..
- The purchase price for the sale of B Medical Systems is USD 63,000,000.
- The transaction is with a related party, as Luc Provost, Azenta's Vice President and CEO of B Medical, is Thelema's majority owner.
- The closing of the transaction is expected on or before March 31, 2026, and is contingent upon Thelema securing final residual financing. If the financing condition is not met by this date, Azenta Germany GmbH will retain USD 5,000,000 from the deposit as a break-up fee.
Fintool News
In-depth analysis and coverage of Azenta.


Quarterly earnings call transcripts for Azenta.
Ask Fintool AI Agent
Get instant answers from SEC filings, earnings calls & more