Earnings summaries and quarterly performance for GRAFTECH INTERNATIONAL.
Executive leadership at GRAFTECH INTERNATIONAL.
Board of directors at GRAFTECH INTERNATIONAL.
Research analysts who have asked questions during GRAFTECH INTERNATIONAL earnings calls.
Arun Viswanathan
RBC Capital Markets
8 questions for EAF
Bennett Moore
JPMorgan Chase & Co.
7 questions for EAF
Abraham Landa
Bank of America
5 questions for EAF
Alex Hacking
Citigroup
4 questions for EAF
Kirk Ludtke
Imperial Capital, LLC
3 questions for EAF
Jay Spencer
Stifel, Nicolaus & Company, Incorporated
2 questions for EAF
Kirk Ludeke
Imperial Capital
1 question for EAF
Matthew Vittorioso
Jefferies Financial Group Inc.
1 question for EAF
William Peterson
JPMorgan Chase & Co.
1 question for EAF
Recent press releases and 8-K filings for EAF.
- GrafTech International announced its support for a petition filed with the U.S. Department of Commerce and the U.S. International Trade Commission.
- The petition alleges that China and India are exporting large diameter graphite electrodes (LDGE) at less than fair value and are providing government subsidies for their manufacture and export.
- Expert analysis indicates margin allegations of up to 74% for LDGE exports from India and up to 147% for LDGE exports from China.
- The trade case seeks additional duties to address these alleged unfair trade practices and ensure fair competition in the U.S. graphite electrode industry.
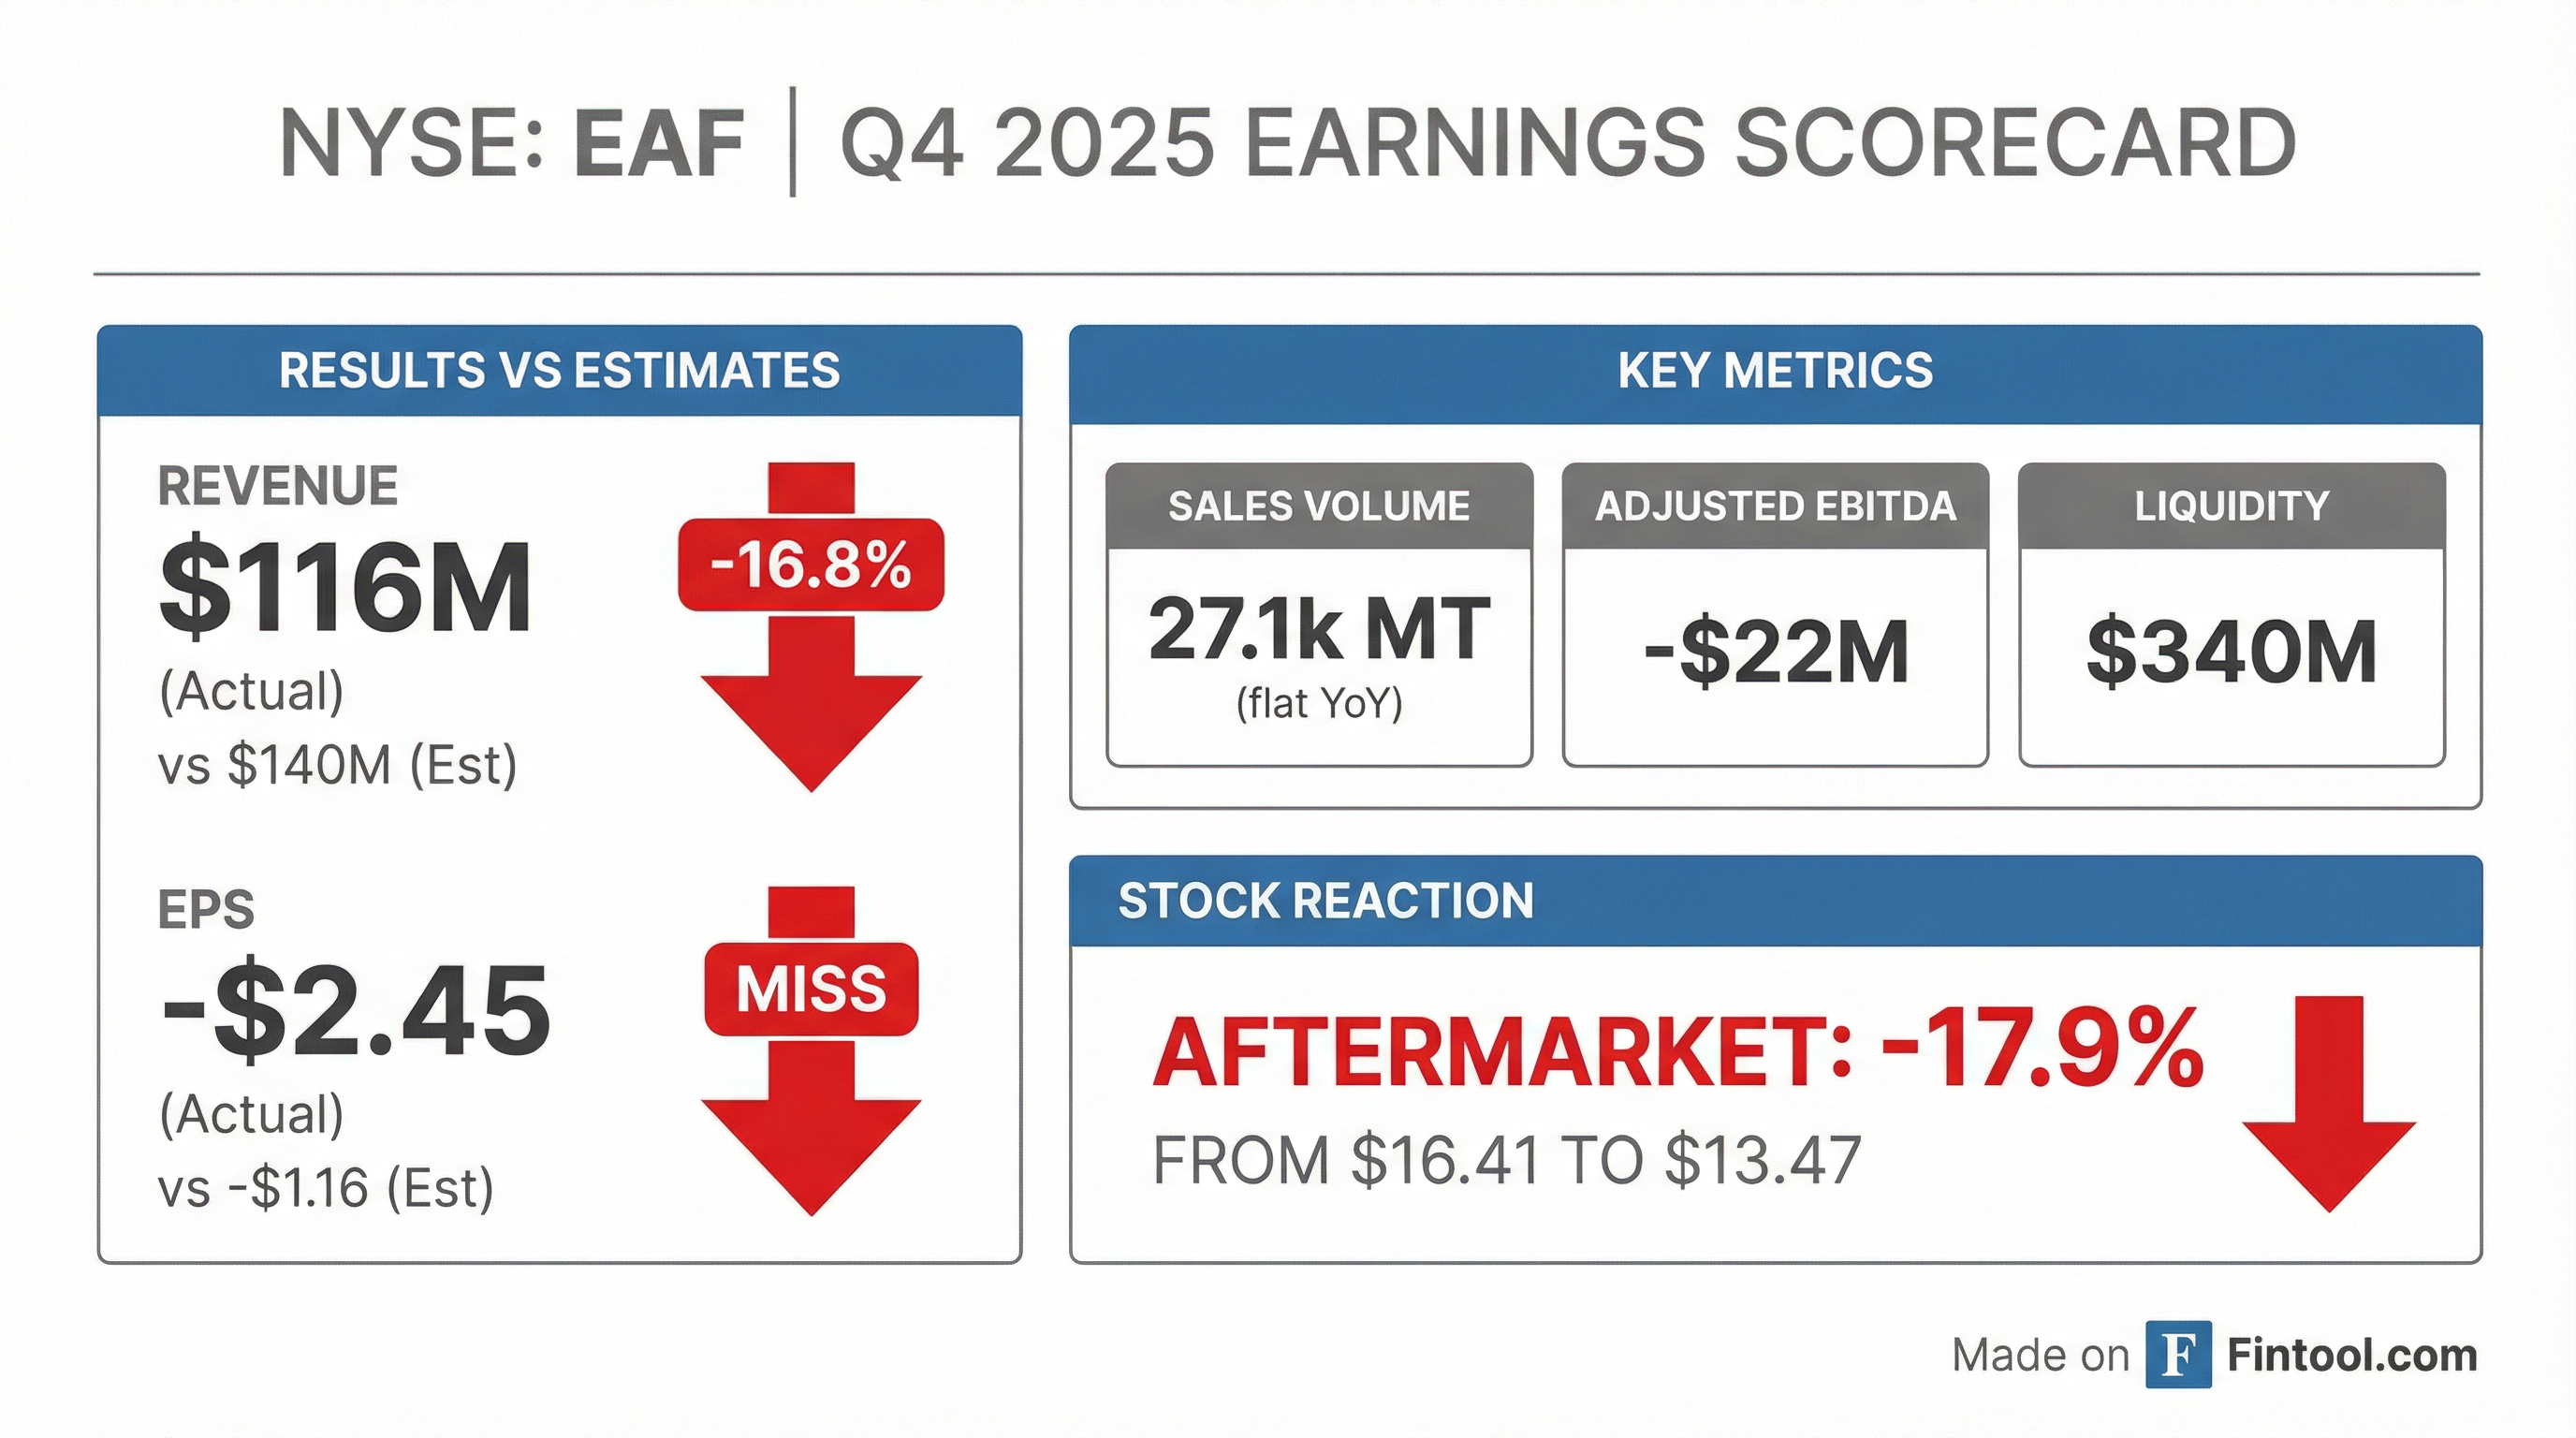
- GrafTech International reported a net loss of $65 million, or $2.50 per share, and negative $22 million in Adjusted EBITDA for Q4 2025. For the full year 2025, the company increased sales volume by 6% and achieved a 31% cumulative reduction in cash costs per metric ton since the end of 2023.
- The company ended 2025 with a strong liquidity position of $340 million, including $138 million in cash. For 2026, GrafTech expects sales volume to grow by 5%-10% year-over-year and anticipates a low single-digit % decline in cash costs per metric ton.
- Despite a challenging market environment characterized by global overcapacity and aggressive competitor pricing, GrafTech strategically shifted its geographic mix, with US sales volume growing 48% in 2025 and representing 31% of total sales volume.
- GrafTech International reported a net loss of $49 million or $1.92 per share and negative $22 million in Adjusted EBITDA for Q4 2025, reflecting a challenging market with declining prices.
- Despite headwinds, the company increased full-year 2025 sales volume by 6%, with U.S. sales volume up 48%, and achieved an 11% reduction in cash cost of goods sold per metric ton.
- The company maintained a strong liquidity position, ending 2025 with $340 million in total liquidity, including $138 million in cash.
- For 2026, GrafTech projects sales volume growth of 5%-10% year-over-year, with 65% of anticipated volume already committed, and expects a low single-digit % decline in cash costs per metric ton.
- Management is actively evaluating strategic options, including optimizing its manufacturing footprint and exploring partnerships in the EV battery and energy storage sectors, to navigate persistent industry overcapacity and aggressive competitor pricing.
- GrafTech reported a net loss of $65 million (or $2.50 per share) and negative $22 million in Adjusted EBITDA for Q4 2025, with full-year 2025 net sales decreasing 6% to a net loss of $220 million.
- For the full-year 2025, the company grew sales volume 6% year-over-year and achieved an 11% year-over-year decline in cash costs per metric ton.
- GrafTech maintained $340 million in liquidity as of December 31, 2025, with substantially no debt maturities until December 2029.
- For 2026, GrafTech projects a slight increase in global (excluding China) demand for graphite electrodes but anticipates continued supply imbalance and aggressive competitor pricing, leading to unsustainably low industry-wide pricing levels.
- GrafTech International reported a net loss of $65 million or $2.50 per share and negative $22 million Adjusted EBITDA for Q4 2025.
- For the full year 2025, sales volume increased by 6%, with US sales volume growing 48%, and cash costs per metric ton reduced by 11%, representing a cumulative 31% reduction since the end of 2023.
- The company ended 2025 with $340 million in total liquidity.
- For 2026, GrafTech expects sales volume to grow by 5%-10% year-over-year, with approximately 65% of the anticipated volume already committed, and projects a low single-digit percent decline in cash costs per metric ton.
- Management anticipates directionally lower realized pricing in 2026 compared to 2025 due to aggressive competitor pricing and global overcapacity in the graphite electrode market.
- GrafTech reported net sales of $116 million for Q4 2025 and $504 million for the full year 2025. The company experienced a net loss of $65 million (or $2.50 per share) in Q4 2025 and a net loss of $220 million (or $8.45 per share) for the full year.
- For the full year 2025, sales volume increased 6% to 109.2 thousand MT, and the company achieved an 11% year-over-year reduction in cash cost of goods sold per metric ton.
- GrafTech ended the fourth quarter of 2025 with total liquidity of $340 million, which included $138 million in cash and cash equivalents.
- For 2026, the company anticipates a 5-10% year-over-year increase in sales volume and expects a low single-digit percentage-point decline in cash cost of goods sold per MT, though competitive pricing pressures are projected to continue.
- GrafTech reported net sales of $116 million and a net loss of $65 million for the fourth quarter of 2025, with full-year 2025 net sales of $504 million and a net loss of $220 million.
- For the full year 2025, sales volume grew 6%, including a 48% increase in the United States, and the company achieved an 11% year-over-year reduction in cash cost of goods sold per metric ton.
- GrafTech ended the fourth quarter of 2025 with $340 million in total liquidity.
- Looking ahead to 2026, the company anticipates a slight increase in global demand for graphite electrodes (excluding China) and expects a low single-digit percentage-point decline in cash cost of goods sold per metric ton.
- GrafTech International reported a 9% year-over-year increase in sales volume, reaching 29,000 metric tons in Q3 2025, driven by a 53% year-over-year growth in U.S. sales volume. The company updated its full-year 2025 sales volume guidance to an 8% to 10% increase.
- For Q3 2025, GrafTech achieved positive adjusted EBITDA of $13 million, which included an $11 million non-cash benefit, compared to a negative $6 million in the prior year. The company reported a net loss of $28 million, or $1.10 per share.
- The company generated $25 million in net cash from operating activities and $18 million in adjusted free cash flow in Q3 2025, strengthening its liquidity position to $384 million as of the end of September.
- GrafTech delivered a 10% year-over-year reduction in cash cost per metric ton for Q3 2025 and anticipates a more than 30% cumulative reduction for the full year 2025 since the end of 2023.
- GrafTech (EAF) reported Q3 2025 sales volume of 29,000 metric tons, marking a 9% year-over-year increase, and achieved $13 million in adjusted EBITDA.
- The company generated $25 million in net cash from operating activities and $18 million in adjusted free cash flow in Q3 2025, increasing its liquidity to $384 million as of September.
- GrafTech updated its full-year 2025 guidance, now expecting total sales volumes to increase 8% to 10% and cash COGS per metric ton to decline approximately 10% year-over-year.
- Strategic efforts included a 53% year-over-year growth in U.S. sales volume for Q3 2025, leveraging favorable pricing dynamics in that region.
- The company noted positive steel market outlooks for 2026, with World Steel projecting demand growth of 1.8% for the U.S., 3.2% for Europe, and 3.5% globally outside of China.
- GrafTech International reported a 9% year-over-year increase in sales volume, reaching 29,000 metric tons in Q3 2025, with U.S. sales volume growing 53% year-over-year.
- The company achieved a 10% year-over-year reduction in cash cost per metric ton, which was $3,795 in Q3 2025.
- Adjusted EBITDA for Q3 2025 was $13 million, with $25 million in net cash from operating activities and $18 million in adjusted free cash flow, strengthening liquidity to $384 million.
- Full-year 2025 sales volume guidance was revised to an increase of 8% to 10%, and the full-year cash COGS per metric ton decline guidance was increased to approximately 10%, translating to $3,860 for the full year.
- The company anticipates positive momentum in the steel industry, with World Steel projecting U.S. steel demand growth of 1.8% and EU growth of 3.2% for 2026, supported by new trade protection measures in Europe and existing tariffs in the U.S..
Quarterly earnings call transcripts for GRAFTECH INTERNATIONAL.
Ask Fintool AI Agent
Get instant answers from SEC filings, earnings calls & more