Earnings summaries and quarterly performance for MDU RESOURCES GROUP.
Executive leadership at MDU RESOURCES GROUP.
Nicole Kivisto
President and Chief Executive Officer
Anne Jones
Chief Human Resources, Administration, and Safety Officer
Anthony Foti
Chief Legal Officer and Corporate Secretary
Dyke Boese
Chief Information Officer
Garret Senger
Chief Utilities Officer
Jason Vollmer
Chief Financial Officer
Rob Johnson
President, WBI Energy, Inc.
Stephanie Sievert
Chief Accounting and Regulatory Affairs Officer
Board of directors at MDU RESOURCES GROUP.
Research analysts who have asked questions during MDU RESOURCES GROUP earnings calls.
Ryan Levine
Citigroup
7 questions for MDU
Brian Russo
Jefferies
5 questions for MDU
Christopher Ellinghaus
Siebert Williams Shank & Co., LLC
2 questions for MDU
Tanner
Future Investing
2 questions for MDU
Brent Thielman
D.A. Davidson
1 question for MDU
Recent press releases and 8-K filings for MDU.
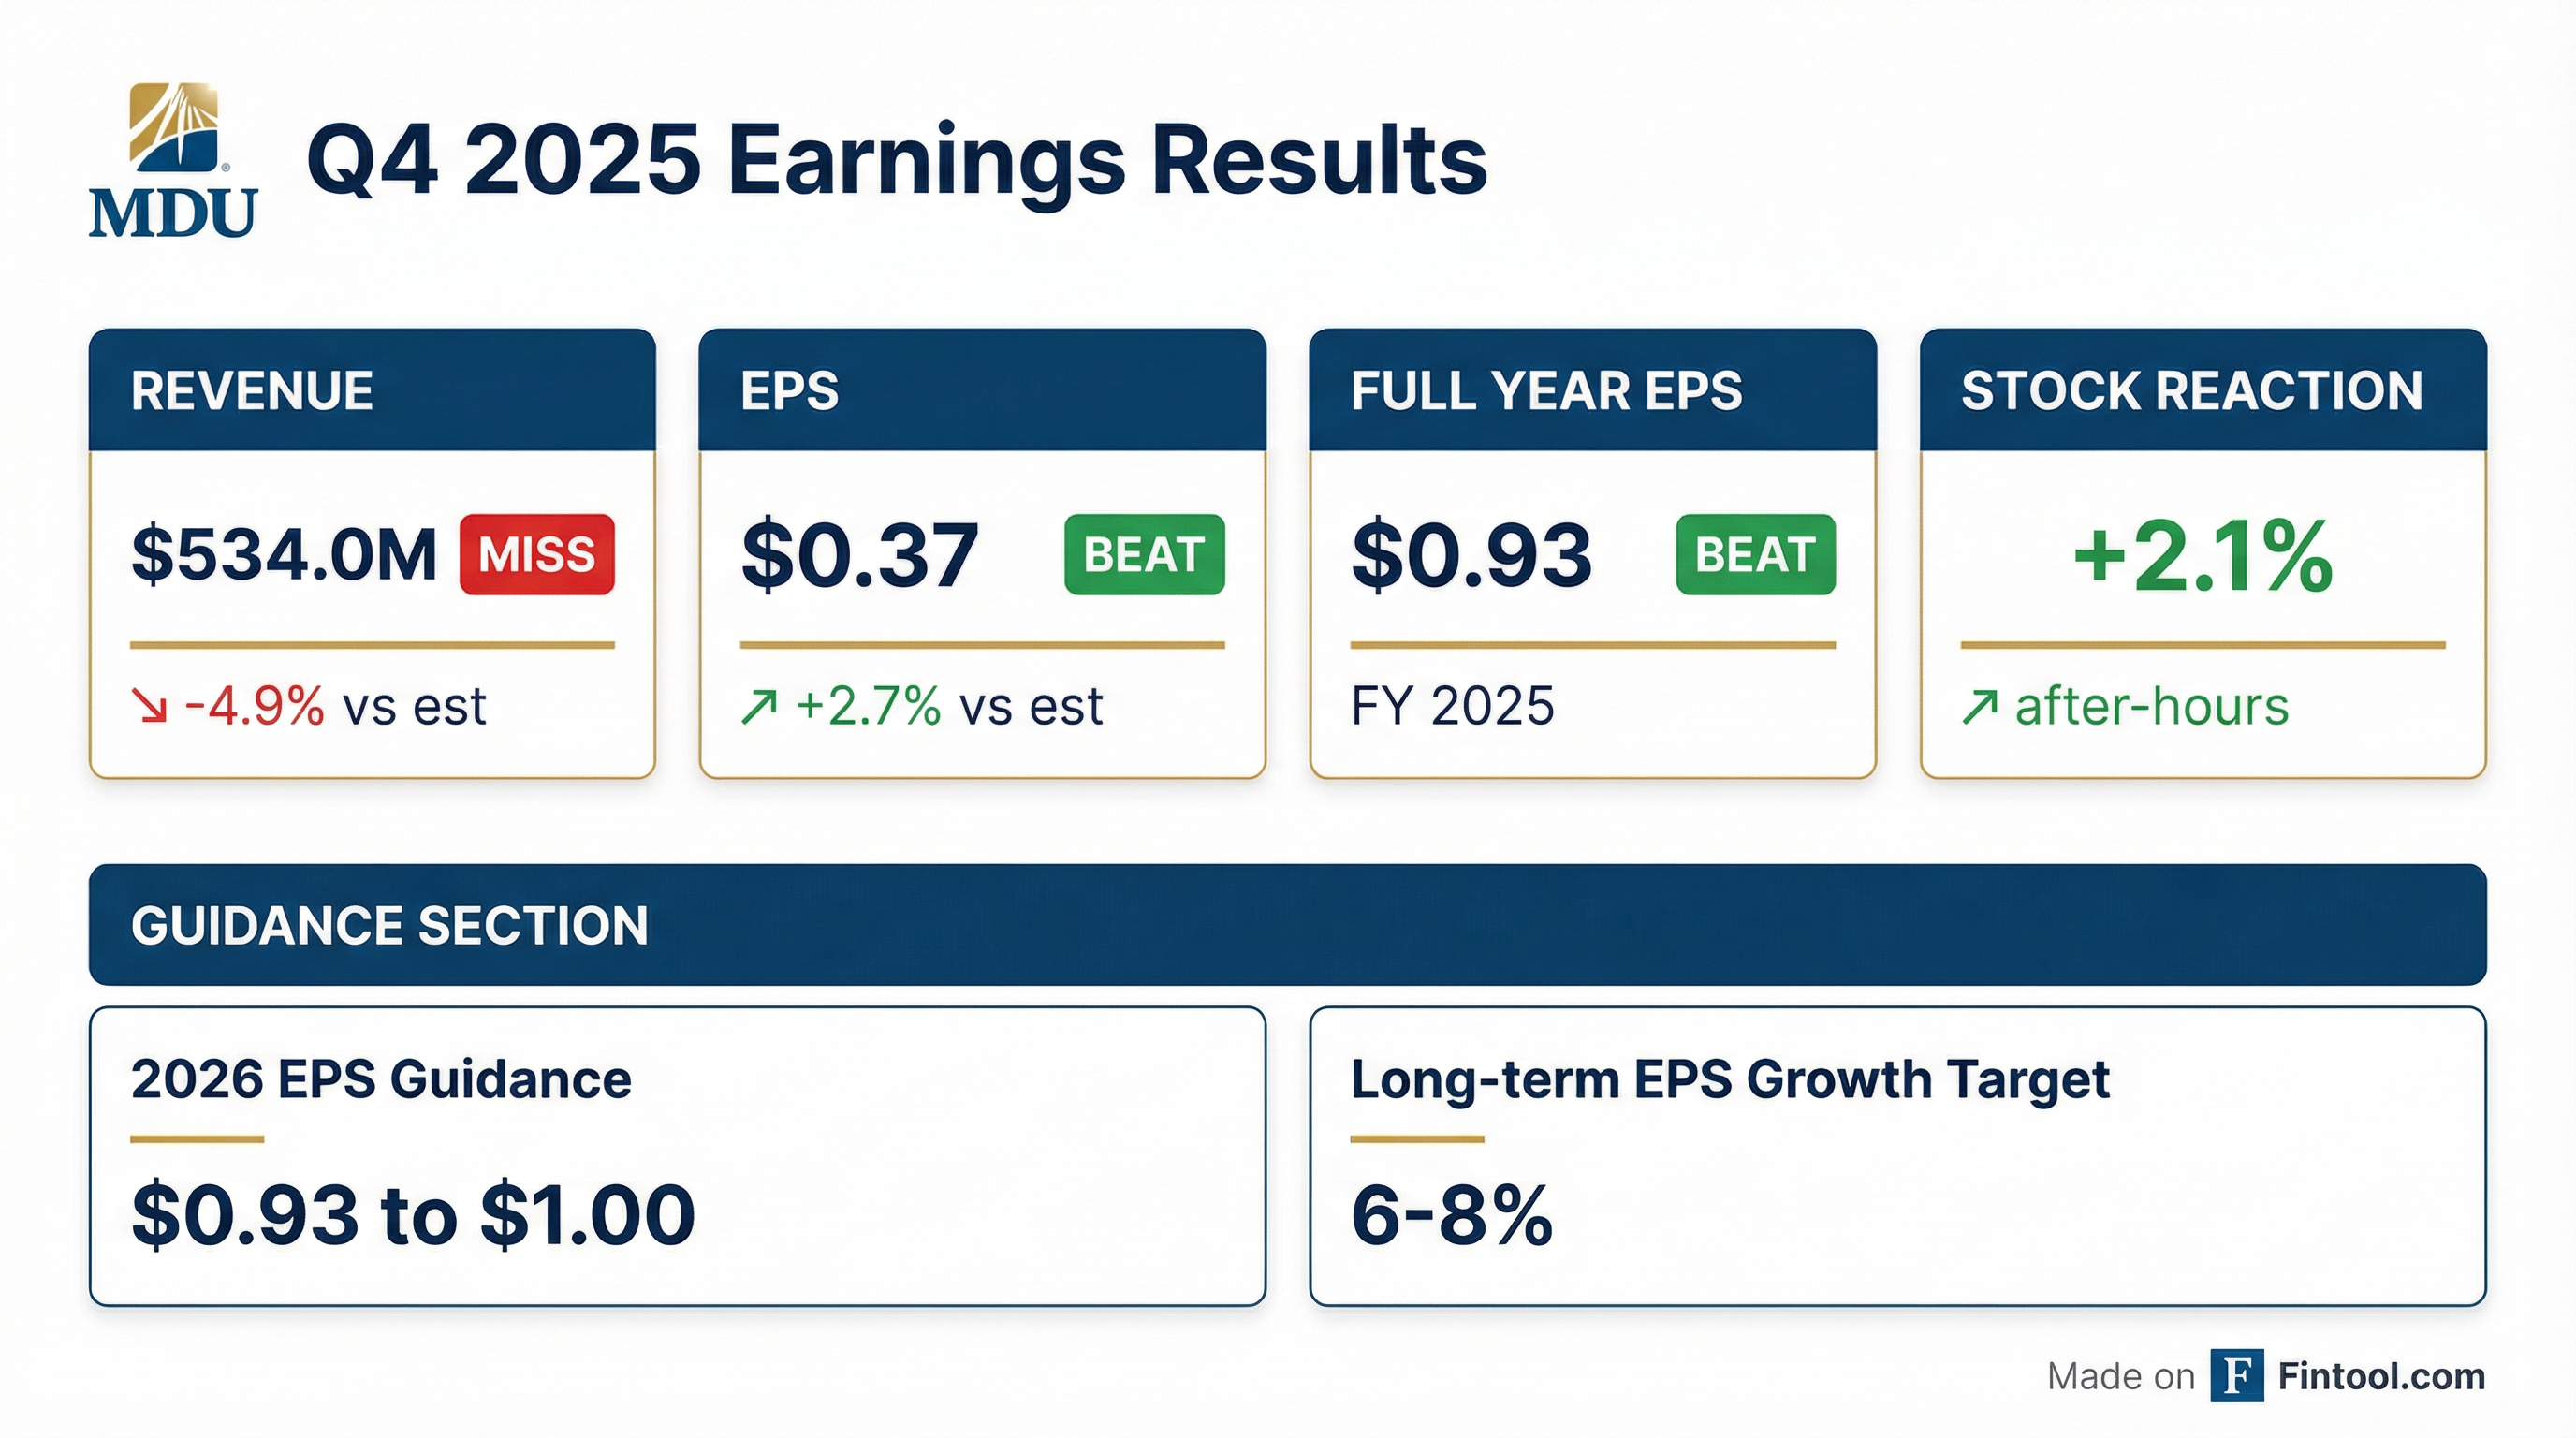
- MDU Resources Group reported 2025 earnings of $190.4 million, or $0.93 per share, from continuing operations, and initiated 2026 earnings per share guidance in the range of $0.93-$1.00 per share.
- The company deployed $792 million of capital in 2025, including the acquisition of a 49% ownership interest in Badger Wind Farm on December 31, 2025, and revised its 2026-2030 capital investment plan to $3.1 billion.
- Significant regulatory approvals include a $13 million annual increase in Idaho's natural gas rate case effective January 1, 2026, and a $5.8 million annual increase in Wyoming's electric case effective April 1, 2026.
- A follow-on public offering in December involved 10.15 million shares at $19.70 per share, with underwriters purchasing an additional 1.5 million shares, contributing to a consolidated debt-to-capitalization ratio of 49.1%.
- MDU Resources Group reported 2025 earnings of $190.4 million, or $0.93 per share, and initiated 2026 EPS guidance in the range of $0.93-$1.00 per share.
- The company deployed $792 million of capital in 2025, including the acquisition of a 49% ownership interest in Badger Wind Farm on December 31, 2025, which contributed to a 16% year-over-year utility rate base growth.
- MDU has revised its 2026-2030 capital investment plan to $3.1 billion and is progressing with pipeline projects, notably the Bakken East Pipeline, which is undergoing a binding open season until March 13, 2026, and is not yet included in the five-year capital forecast.
- Significant regulatory advancements include rate increases approved in North Dakota, Idaho, and Washington, with additional rate case filings in Montana and Oregon.
- In December 2025, MDU completed a follow-on public offering of over 10.15 million shares of common stock at $19.70 per share, expected to meet all 2026 and a significant portion of 2027 equity funding needs.
- MDU Resources Group reported 2025 earnings from continuing operations of $191.4 million, or $0.93 per share.
- The company initiated 2026 EPS guidance in the range of $0.93 to $1.00, maintaining a long-term EPS growth rate target of 6%-8% and an annual dividend payout ratio target of 60%-70%.
- MDU plans $3.1 billion in capital investments from 2026-2030 and completed the acquisition of a 49% ownership interest in the Badger Wind Farm on December 31, 2025.
- To support capital expenditures, the company completed a follow-on public offering in December 2025, issuing 11,675,126 shares of common stock through forward sale agreements.
- MDU Resources Group reported 2025 earnings of $190.4 million, or $0.93 per share, and initiated 2026 EPS guidance in the range of $0.93-$1.00 per share.
- The company deployed $792 million in capital in 2025, including the acquisition of a 49% ownership interest in Badger Wind Farm on December 31, 2025, which led to a revised 2026-2030 capital investment plan of $3.1 billion.
- MDU achieved several regulatory successes, including approval for cost recovery of the Badger Wind Farm in North Dakota on January 26, 2026, an $13 million annual increase in Idaho natural gas rates effective January 1, 2026, and a $5.8 million annual increase in Wyoming electric rates effective April 1, 2026.
- The Bakken East Pipeline project had its FERC pre-filing submitted on December 23, 2025, and a binding open season is underway from February 2 to March 13, 2026, with potential in-service dates in late 2029 and late 2030, though it is not yet included in the five-year capital forecast.
- MDU Resources Group reported 2025 year-end net income of $190.4 million and earnings per share of $0.93, with income from continuing operations increasing by $10.3 million year-over-year to $191.4 million.
- The company initiated 2026 earnings per share guidance in the range of $0.93 to $1.00 and plans a disciplined capital plan of approximately $560 million for 2026, while maintaining a long-term EPS growth rate of 6%-8%.
- In 2025, MDU Resources deployed $792 million of capital, including the 49% ownership acquisition of Badger Wind Farm, as it continues its strategy as a pure-play regulated energy delivery business.
- To support capital expenditures, the company completed a follow-on public offering of 10,152,284 shares at $19.70 per share on December 5, 2025, with underwriters exercising an option for 1,522,842 additional shares on December 23, 2025, expected to meet a substantial portion of equity issuance needs for 2026 and 2027.
- MDU Resources Group reported net income of $190.4 million and earnings per share of $0.93 for the full year ended December 31, 2025.
- The company initiated 2026 earnings per share guidance in the range of $0.93 to $1.00 and plans $560 million in capital investment for the year.
- Income from continuing operations for 2025 increased by $10.3 million year-over-year to $191.4 million, and the utility rate base grew 16.0%.
- Strategic developments in 2025 included the acquisition of a 49% ownership stake in Badger Wind Farm, which was placed in service on December 31, 2025, and a follow-on public offering of 11,675,126 shares to support future capital expenditures.
- MDU Resources Group, Inc. entered into an Amended and Restated Credit Agreement on December 11, 2025, with U.S. Bank National Association as the administrative agent.
- This agreement extends the maturity date of the revolving commitments from May 31, 2028 to December 11, 2030.
- The credit facility maintains an initial commitment amount of $200 million, which includes a $25 million standby letter of credit facility and a $25 million swingline subfacility.
- As of December 11, 2025, $33,850,000 million of loans were outstanding and $1 million of letters of credit were issued under the agreement.
- The Credit Agreement contains a financial covenant that prohibits the ratio of funded debt to total capitalization from exceeding 65% at the end of any fiscal quarter.
- MDU Resources Group, Inc. entered into an Underwriting Agreement and Forward Sale Agreements on December 3, 2025, for the offering and sale of 10,152,284 shares of common stock, with underwriters having a 30-day option for an additional 1,522,842 shares.
- The initial forward sale price is $19.04 per share, which will be adjusted based on a floating interest rate factor and expected dividends.
- The Forward Sale Agreements are scheduled for settlement by December 6, 2027, with the Company having discretion over physical, cash, or net share settlement.
- The Company anticipates no dilutive effect on earnings per share unless the average market price of the common stock is above the adjusted forward sale price.
- MDU Resources Group announced on December 4, 2025, the pricing of an underwritten public offering of 10,152,284 shares of its common stock at $19.70 per share.
- The company has granted the underwriters an option to purchase up to 1,522,842 additional shares of common stock.
- MDU Resources will not initially receive any proceeds from the sale of shares by the forward sellers due to the forward sale agreements.
- If MDU Resources elects physical settlement of the forward sale agreements, the net proceeds are expected to be used for general corporate purposes, including repayment or refinancing of debt, capital expenditures, and acquisitions, such as a 49% undivided ownership interest in the Badger Wind Farm project in 2026.
- MDU Resources Group, Inc. has commenced an underwritten public offering of $200 million of shares of its common stock, with an option for underwriters to purchase up to $30 million of additional shares.
- The company intends to enter into separate forward sale agreements for approximately $200 million of common stock, with settlement expected no later than 24 months following the completion of the offering.
- MDU Resources will not initially receive any proceeds from the sale of shares by the forward sellers.
- Upon physical settlement of the forward sale agreements, net proceeds are expected to be used for general corporate purposes, including debt repayment, capital expenditures, and the acquisition of a 49% undivided ownership interest in the Badger Wind Farm project in 2026.
Quarterly earnings call transcripts for MDU RESOURCES GROUP.
Ask Fintool AI Agent
Get instant answers from SEC filings, earnings calls & more