Earnings summaries and quarterly performance for PRUDENTIAL FINANCIAL.
Executive leadership at PRUDENTIAL FINANCIAL.
Andrew Sullivan
Chief Executive Officer and President
Caroline Feeney
Executive Vice President, Head of Global Retirement and Insurance
Charles Lowrey
Executive Chairman
Jacques Chappuis
President and CEO, PGIM
Scott Case
Executive Vice President, Head of Global Technology and Operations
Vicki Walia
Chief People Officer
Yanela Frias
Executive Vice President and Chief Financial Officer
Board of directors at PRUDENTIAL FINANCIAL.
Carmine Di Sibio
Director
Christine Poon
Director
Gilbert Casellas
Director
Joseph Wolk
Director
Martina Hund-Mejean
Director
Michael Todman
Lead Independent Director
Sandra Pianalto
Director
Tom Stoddard
Director
Wendy Jones
Director
Research analysts who have asked questions during PRUDENTIAL FINANCIAL earnings calls.
John Barnidge
Piper Sandler
4 questions for PRU
Ryan Krueger
KBW
4 questions for PRU
Suneet Kamath
Jefferies
4 questions for PRU
Thomas Gallagher
Evercore
4 questions for PRU
Wesley Carmichael
Autonomous Research
4 questions for PRU
Elyse Greenspan
Wells Fargo
3 questions for PRU
Francis Matten
BMO Capital Markets
2 questions for PRU
Jamminder Bhullar
JPMorgan Chase & Co.
2 questions for PRU
Michael Ward
Citi Research
2 questions for PRU
Alex Scott
Barclays PLC
1 question for PRU
Jian Huang
Morgan Stanley
1 question for PRU
Joel Hurwitz
Dowling & Partners Securities, LLC
1 question for PRU
Mike Ward
UBS
1 question for PRU
Nick Anita
Wells Fargo
1 question for PRU
Taylor Scott
BofA Securities
1 question for PRU
Wilma Burdis
Raymond James Financial
1 question for PRU
Wilma Jackson Burdis
Raymond James
1 question for PRU
Recent press releases and 8-K filings for PRU.
- Revenue rose to US$608.5 million, a 5% increase on H1 FY25.
- Profit after tax was US$185.5 million, an 8% decline year-on-year.
- Interim dividend declared of A$5.00 cents per share, a 100% increase vs H1 FY25.
- EBITDA of US$315.5 million, operating cash flow of US$193.4 million, and net cash & bullion of US$755 million as at 31 Dec 2025.
- FY26 guidance confirmed: group gold production 400,000–440,000 oz at AISC US$1,600–1,760/oz.
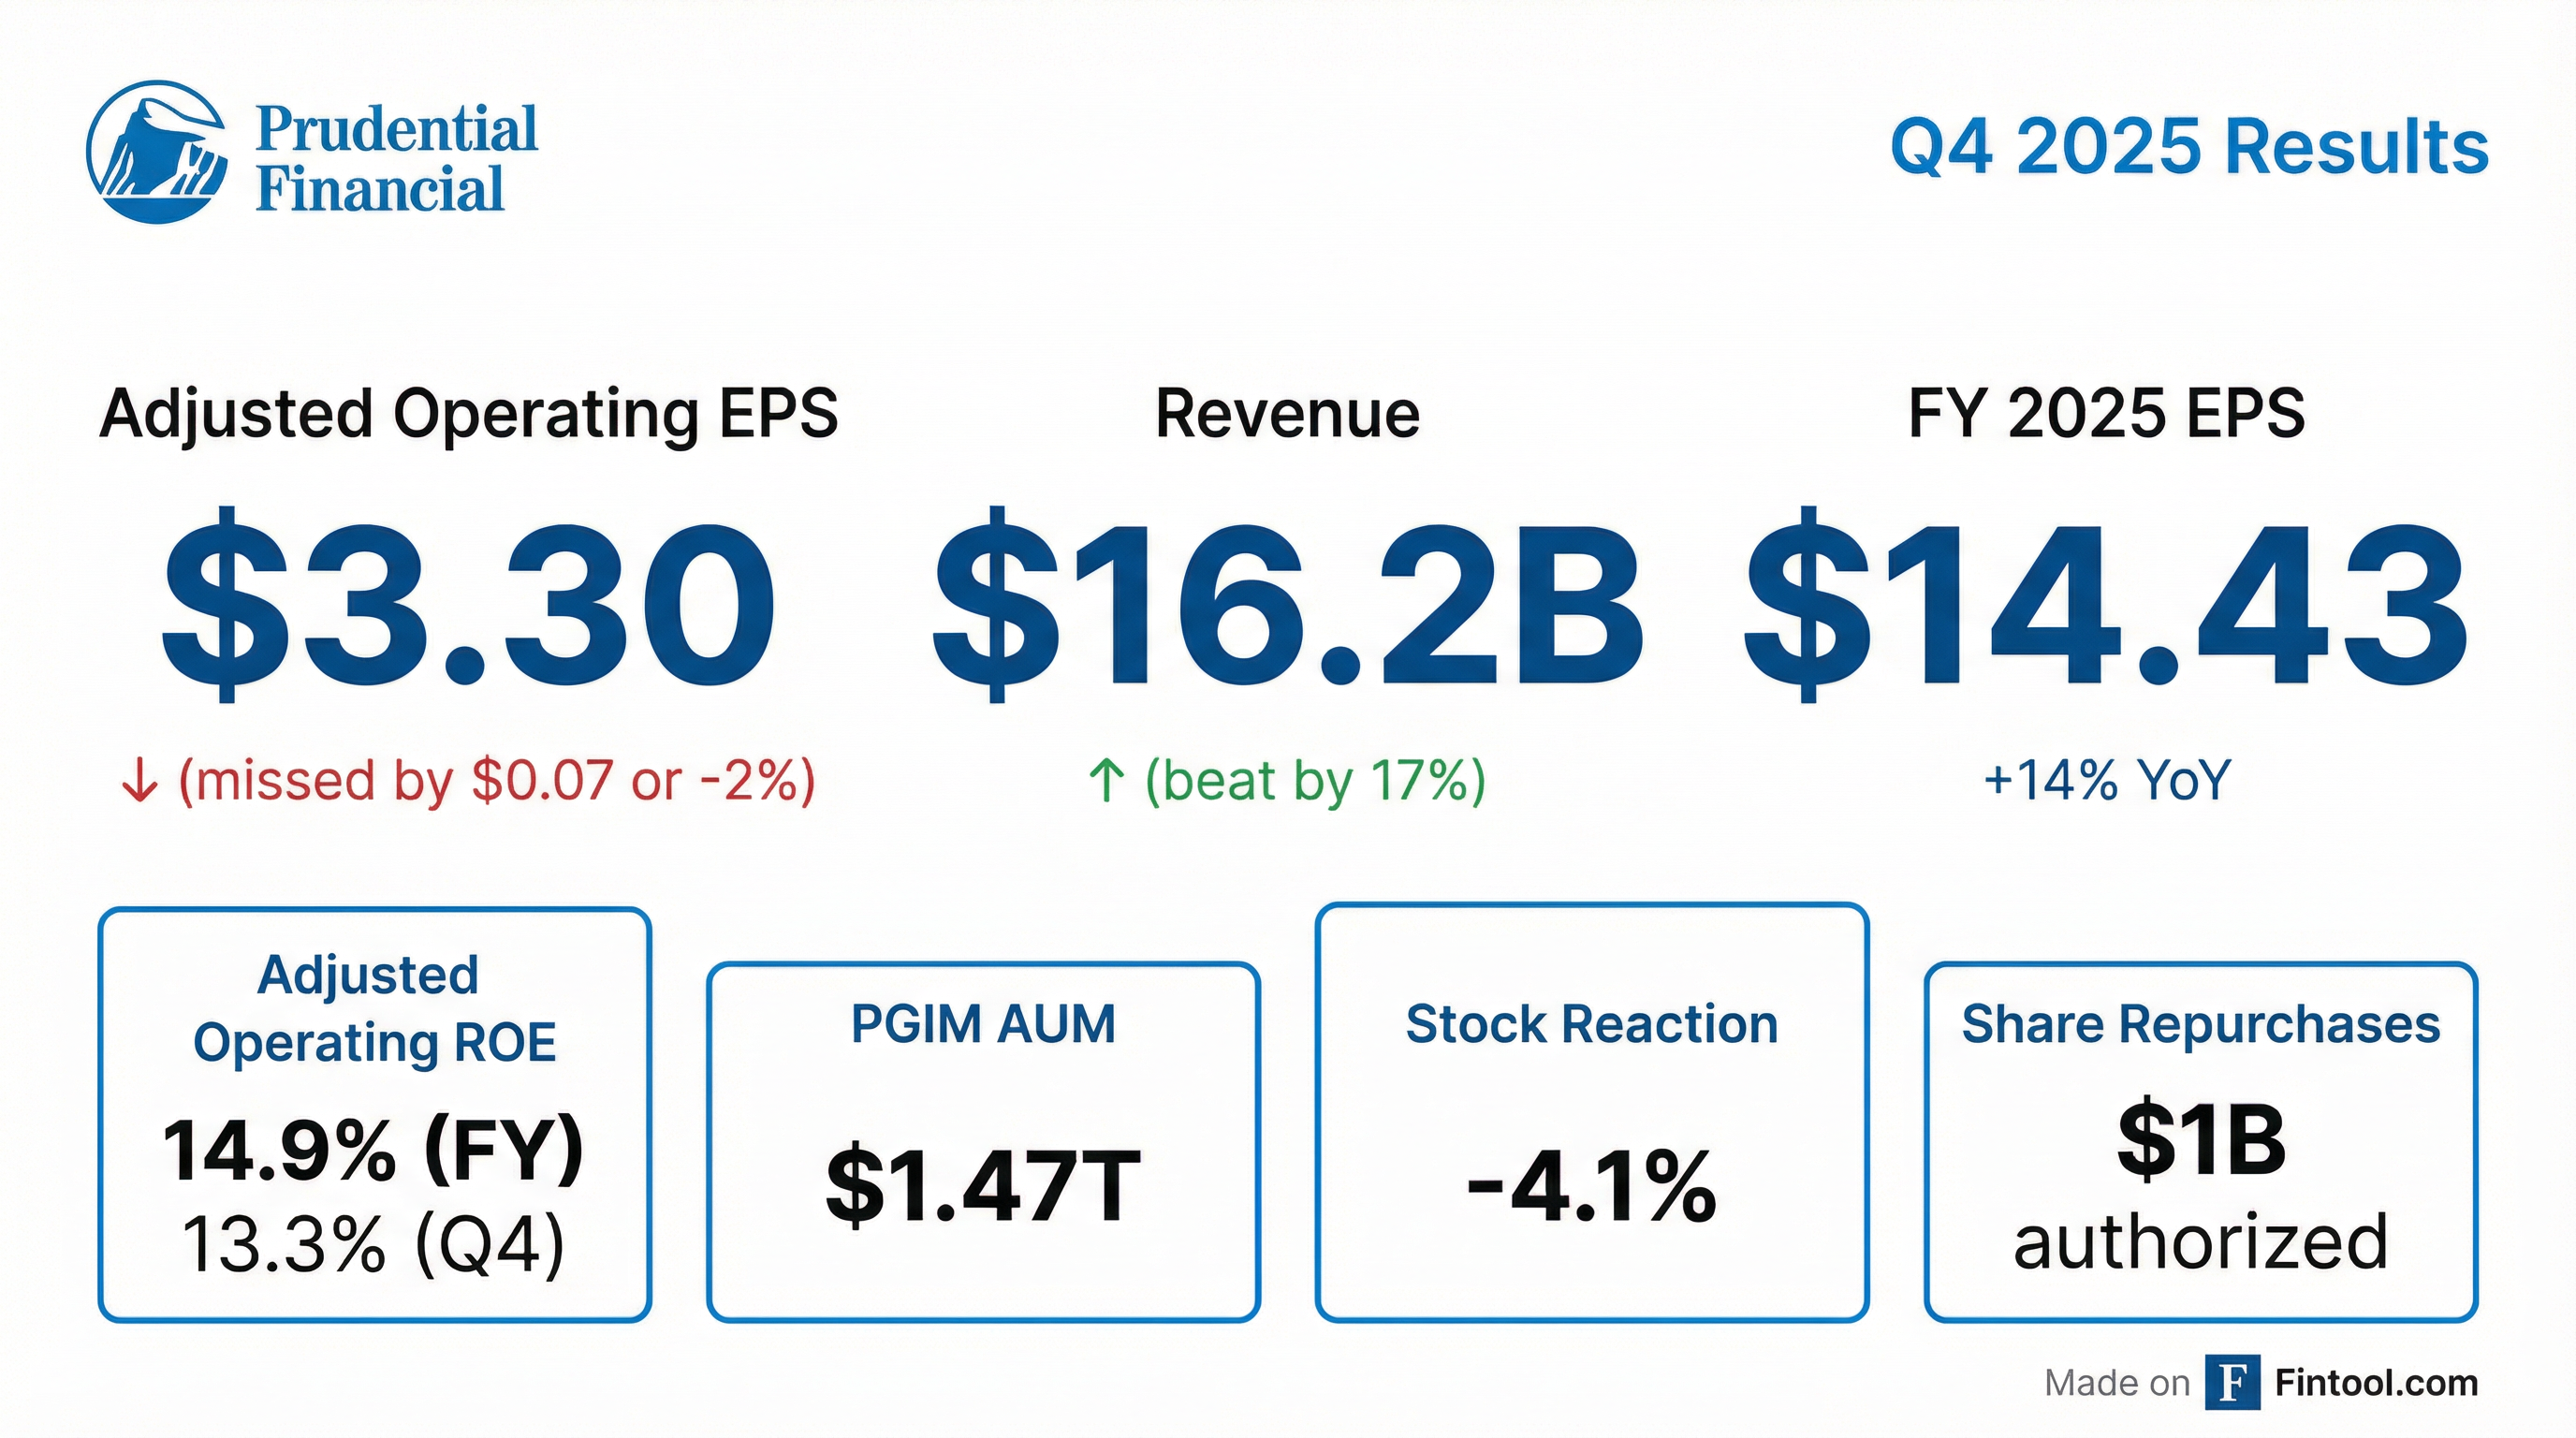
- 2025 net income of $3.576 billion, or $9.99 per share, up from $2.727 billion, or $7.50 per share in 2024; after-tax adjusted operating income rose to $5.161 billion, or $14.43 per share, from $4.588 billion, or $12.62 per share in 2024.
- Q4 2025 net income of $905 million, or $2.55 per share, versus a net loss of $57 million, or $0.17 per share in Q4 2024; after-tax adjusted operating income was $1.168 billion, or $3.30 per share, compared to $1.068 billion, or $2.96 per share in the year-ago quarter.
- Book value per share reached $92.05, up from $77.62 a year ago; adjusted book value per share increased to $100.17 from $95.82.
- Capital returned of $730 million in Q4 2025, including $250 million in share repurchases and $480 million in dividends (dividend of $1.35 per share, yielding over 5% on adjusted book value).
- Assets under management totaled $1.609 trillion versus $1.512 trillion a year earlier; parent company highly liquid assets were $3.8 billion, down from $4.6 billion.
- For FY 2025, net income attributable was $3.576 billion ($9.99/share) versus $2.727 billion ($7.50/share) in 2024; after-tax adjusted operating income rose to $5.161 billion ($14.43/share) from $4.588 billion ($12.62/share).
- In Q4 2025, net income of $905 million ($2.55/share) compared to a net loss of $57 million (–$0.17/share) in Q4 2024; after-tax adjusted operating income was $1.168 billion ($3.30/share) versus $1.068 billion ($2.96/share).
- Book value per share reached $92.05 (adjusted: $100.17), and assets under management climbed to $1.609 trillion.
- Q4 capital returns totaled $730 million (including $250 million in buybacks and $480 million in dividends); board authorized up to $1.0 billion in share repurchases for 2026 and declared a $1.40 quarterly dividend.
- Announced a 90-day suspension of new sales in Japan to address employee misconduct issues.
- Prudential of Japan will implement a 90-day suspension of new sales activity beginning Feb. 9, 2026 to address previously disclosed employee misconduct and strengthen governance and risk management.
- The company will introduce an independent program to reimburse impacted customers and has confirmed that support for existing customers and servicing of in-force policies is unaffected.
- Kan Mabara departed as president and CEO of Prudential of Japan on Feb. 1, 2026 and was replaced by Hiromitsu Tokumaru, formerly CEO of Prudential Gibraltar Financial Life.
- Prudential Financial CEO Andy Sullivan reaffirmed the firm’s commitment to rebuilding customer trust and addressing compliance and operational issues in Japan.
- PURE Property Management and HomeRiver Group have merged to form PURE HomeRiver, now the nation’s largest third-party single-family rental manager, overseeing 40,000+ homes across 35+ states and 200+ markets.
- The combined company secured $80 million in growth capital from PGIM, Prudential Financial’s global asset management arm, to fund further acquisitions and technology investments.
- PURE HomeRiver integrates AI-native technology with 80+ local offices and unified operations to enhance efficiency and scale client and resident services.
- The platform offers full-stack lifecycle services—including acquisition, construction and rehab, leasing, management, maintenance, and disposition—to streamline investor and resident experiences.
- As of December 31, 2025, PGIM segment assets under management were $1.47 trillion.
- For Q4 2025, PGIM’s other related revenues, net of related expenses, were approximately $55 million on an adjusted operating income basis.
- The General Account’s alternative investment income for Q4 2025 was estimated $5–25 million below near-term expectations.
- All figures are preliminary, unaudited, and subject to change upon completion of financial closing procedures.
- PGIM Inc., Prudential Financial’s investment-management arm, has engaged Ernst & Young to advise on a potential divestment of its India asset management unit, PGIM India Asset Management, acquired from Deutsche Bank in 2015.
- The unit manages approximately ₹266 billion (about $3 billion) in assets but has experienced little growth and after-tax losses exceeding ₹235 million in the fiscal year ended March 2025.
- A leadership change in July 2025 has not reversed the downturn, prompting Prudential to reevaluate the business amid intense competition in India’s mutual-fund market.
- Prudential Financial’s global assets under management total roughly $1.5 trillion, underscoring the India unit’s relatively small scale.
- Prudential Financial has realigned its senior leadership to streamline operations and sharpen focus on key growth markets, with all major business heads now reporting directly to CEO Andrew Sullivan.
- Phil Waldeck, head of Multi-Asset and Quantitative Solutions at PGIM, will become Executive Vice President and Head of U.S. Businesses effective February 2, 2026.
- David Legher (Emerging Markets), Brad Hearn (Japan Group), and Jacques Chappuis (PGIM) will also report directly to CEO Sullivan under the new structure.
- Caroline Feeney, EVP and Global Head of Retirement and Insurance, will depart as her role is eliminated, remaining through February 2, 2026.
- Prudential Financial will have its U.S. businesses, Emerging Markets, Japan Group and PGIM leaders report directly to CEO Andrew Sullivan to streamline operations and sharpen growth focus.
- Phil Waldeck is appointed Executive Vice President, head of U.S. Businesses, effective February 2, 2026.
- David Legher, Japan Group President Brad Hearn, and PGIM President Jacques Chappuis will also report directly to Sullivan under the new structure.
- Caroline Feeney, global head of Retirement and Insurance, will depart the company as part of the realignment.
- Prudential Advisors has added experienced financial advisors managing nearly $3 billion in client assets, boosting advisor headcount by nearly 9% to over 3,000 through October 31, 2025.
- The firm entered a strategic partnership with LPL Financial to expand investment and wealth management options by combining Prudential’s brand and support with LPL’s technology and infrastructure.
- With strong year-to-date growth and a flexible affiliation model for advisors, Prudential Advisors expects to sustain its positive trajectory into year-end and beyond.
Quarterly earnings call transcripts for PRUDENTIAL FINANCIAL.
Ask Fintool AI Agent
Get instant answers from SEC filings, earnings calls & more