Sign in

    Allstate Corp (ALL)

    You might also like

    Allstate Corporation is a leading provider of property and casualty insurance in the United States and Canada, offering a wide range of protection solutions for autos, homes, and personal property . The company is structured into several segments, with Allstate Protection being the largest contributor to its revenue . Allstate's offerings include auto and homeowners insurance, consumer product protection plans, roadside assistance, identity protection, and health and benefits products . The company's strategy focuses on expanding its market share in personal property-liability and enhancing its protection offerings through various distribution channels .

    1. Allstate Protection - Offers private passenger auto and homeowners insurance, serving as the primary revenue driver for the company.
    2. Protection Services - Provides consumer product protection plans, roadside assistance, and identity protection through services like Allstate Protection Plans, Allstate Dealer Services, Allstate Roadside, Arity, and Allstate Identity Protection.
    3. Allstate Health and Benefits - Delivers employer voluntary benefits, group health, and individual health products, including life, accident, and critical illness insurance.
    4. Corporate and Other - Encompasses various corporate functions and other business activities not included in the main segments.
    Revenue by Segment - in Millions of USDFY 2013Q1 2014Q2 2014Q3 2014Q4 2014FY 2014Q1 2015Q2 2015Q3 2015Q4 2015FY 2015Q1 2016Q2 2016Q3 2016Q4 2016FY 2016Q1 2017Q2 2017Q3 2017Q4 2017FY 2017Q1 2018Q2 2018Q3 2018Q4 2018FY 2018Q1 2019Q2 2019Q3 2019Q4 2019FY 2019Q1 2020Q2 2020Q3 2020Q4 2020FY 2020Q1 2021Q2 2021Q3 2021Q4 2021FY 2021Q1 2022Q2 2022Q3 2022Q4 2022FY 2022Q1 2023Q2 2023Q3 2023Q4 2023FY 2023Q1 2024Q2 2024Q3 2024Q4 2024FY 2024Q1 2025
    Property-Liability13,44251,89813,87014,32015,15513,22158,34314,969
    - Auto8,56632,9408,7789,0799,2709,34836,4759,347
    - Homeowners3,07711,7393,1543,2553,4033,54813,3603,657
    - Other Personal Lines632,3876597017187452,823741
    - Commercial Lines183811169158151131609113
    - Other Business Lines145550140146152161599169
    - Other Revenue23892019171,8391,895488
    - Net Investment Income241051821252,7462,810783
    - Net Gains/Losses15(11)1117-244(228)(329)
    Protection Services7322,7737487728328853,223850
    - Protection Plans4141,5404394534804971,869510
    - Roadside Assistance471954734343515036
    - Protection Products126508126126125126503125
    - Intersegment Fees361383539495718037
    Health and Benefits6322,3786376206306562,538642
    - Employer Benefits2481,001248246248243985243
    - Group Health112440118120120123481124
    - Individual Health107405112108119116455120
    Corporate and Other621833941592118228
    Intersegment Eliminations-36(138)(35)(39)(49)-57(180)(37)
    Total Revenue14,83257,09415,25915,71416,62716,50664,10616,452
    KPIs - Metric (Unit, Scale)FY 2013Q1 2014Q2 2014Q3 2014Q4 2014FY 2014Q1 2015Q2 2015Q3 2015Q4 2015FY 2015Q1 2016Q2 2016Q3 2016Q4 2016FY 2016Q1 2017Q2 2017Q3 2017Q4 2017FY 2017Q1 2018Q2 2018Q3 2018Q4 2018FY 2018Q1 2019Q2 2019Q3 2019Q4 2019FY 2019Q1 2020Q2 2020Q3 2020Q4 2020FY 2020Q1 2021Q2 2021Q3 2021Q4 2021FY 2021Q1 2022Q2 2022Q3 2022Q4 2022FY 2022Q1 2023Q2 2023Q3 2023Q4 2023FY 2023Q1 2024Q2 2024Q3 2024Q4 2024FY 2024Q1 2025
    Percentage of gross payments for Direct excess commercial insurance related to settlement agreements (percentage)-85%85%87%94%---
    Percentage of gross payments for Direct excess commercial insurance (ceded) related to settlement agreements (percentage)-83%89%96%98%---
    Total net reserves as a percentage of estimated IBNR reserves (percentage)-53%53%50%52%---
    Percentage of consolidated fixed income securities portfolio rated investment grade (percentage)-91.5%91.4%91.4%91.4%---
    Modeled 1-in-100 probable maximum loss for hurricane, wildfire and earthquake perils (net of reinsurance) (USD billions)--2.5-2.9---
    Loss ratio for Auto (percentage)-82.875.474.271.9---
    Loss ratio for Auto (%)--------
    Auto Loss Ratio (Allstate)--------
    Auto Loss Ratio (Encompass)--------
    Auto Loss Ratio (Esurance)--------
    Loss ratio for Homeowners (%)-85.460.390.376.3---
    Effect of catastrophe losses (%)--------
    Effect of prior year reserve reestimates (%)--------
    Loss ratio for Homeowners (percentage)--------
    Loss ratio for Other personal lines (%)-82.085.692.096.2---
    Loss ratio for Commercial lines (%)-105.8115.4158.884.8---
    Loss ratio for Commercial lines (percentage)--------
    Loss ratio for Other business lines (percentage)-48.444.349.372.4---
    Loss ratio for Other business lines (%)--------
    Loss ratio for Total (Allstate Protection) (%)-83.372.479.874.4---
    Expense ratio for Auto (%)-20.620.621.722.9---
    Expense ratio for Auto (percentage)--------
    Expense ratio for Allstate Protection (percentage)--------
    Expense ratio for Encompass brand (percentage)--------
    Expense ratio for Esurance brand (percentage)--------
    Expense ratio for Homeowners (%)-21.421.821.221.9---
    Expense ratio for Homeowners (percentage) - Allstate--------
    Expense ratio for Homeowners (percentage) - Esurance--------
    Expense ratio for Homeowners (percentage) - Encompass--------
    Total Expense Ratio (percentage) - Allstate Protection--------
    Total Expense Ratio (percentage) - Encompass Brand--------
    Total Expense Ratio (percentage) - Esurance Brand--------
    Expense ratio for Other personal lines (%)-19.613.315.86.3---
    Expense ratio for Other personal lines (percentage)--------
    Expense ratio for Commercial lines (%)-26.926.028.525.8---
    Expense ratio for Commercial lines (percentage)--------
    Expense ratio for Other business lines (percentage)-30.721.415.11.3---
    Expense ratio for Other business lines (%)--------
    Combined ratio for Auto (%)-103.496.095.994.8---
    Combined ratio for Auto (%) - Allstate--------
    Combined ratio for Auto (%) - Encompass--------
    Combined ratio for Auto (%) - Esurance--------
    Combined ratio for Homeowners (%)-106.882.1111.598.2---
    Combined ratio for Homeowners (percentage)--------
    Combined ratio for Other personal lines (%)-101.698.9107.8102.5---
    Combined ratio for Commercial lines (%)-132.7141.4187.3110.6---
    Combined ratio for Commercial lines (percentage)--------
    Combined ratio for Other business lines (%)-79.165.764.473.7---
    Combined ratio for Other business lines (percentage)--------
    Combined ratio for Total (Allstate Protection) (%)-104.393.0101.196.4---
    Combined ratio for Total (Allstate Protection) (percentage)--------
    Allstate brand average premium for Auto (USD)-757823841852---
    Allstate brand average premium for Homeowners (USD)-1,8121,9121,9932,050---
    Allstate brand renewal ratio for Auto (percentage)-85.486.085.784.7---
    Allstate brand renewal ratio for Auto (%)--------
    Allstate brand renewal ratio for Homeowners (%)-86.787.187.287.2---
    New issued applications for Auto (exclusive agency channel) (thousands)-2,294589574675---
    New issued applications for Auto (Allstate brand) (thousands)--------
    New issued applications for Auto (Esurance brand) (thousands)--------
    New issued applications for Auto (Encompass brand) (thousands)--------
    New issued applications for Auto (direct channel) (thousands)-1,632463415620---
    New issued applications for Auto (direct channel) (thousands) - Allstate--------
    New issued applications for Auto (direct channel) (thousands) - Esurance--------
    New issued applications for Auto (direct channel) (thousands) - Encompass--------
    New issued applications for Auto (thousands)--------
    New issued applications for Auto (independent agency channel) (thousands)-1,989482489597---
    New issued applications (thousands)--------
    Total new issued applications for Auto (thousands)-5,9151,6701,7281,892---
    Total new issued applications for Auto (thousands) - Allstate--------
    Total new issued applications for Auto (thousands) - Esurance--------
    Total new issued applications for Auto (thousands) - Encompass--------
    New issued applications for Homeowners (exclusive agency channel) (thousands)-800259293260---
    New issued applications for Homeowners (direct channel) (thousands)-79191939---
    New issued applications for Homeowners (independent agency channel) (thousands)-232505963---
    New issued applications for Homeowners (Allstate brand) (thousands)--------
    New issued applications for Homeowners (Esurance brand) (thousands)--------
    New issued applications for Homeowners (Encompass brand) (thousands)--------
    Total new issued applications for Homeowners (thousands)-1,111291334362---
    Total new issued applications (thousands)--------
    Allstate Brand--------
    Esurance Brand--------
    Encompass Brand--------
    Policies in force for Auto (count (thousands))-25,28325,20725,12424,998---
    Policies in force for Homeowners (count (thousands))-7,3387,3647,4267,483---
    Policies in force for Other personal lines (count (thousands))--4,8494,8714,877---
    Policies in force for Commercial lines (count (thousands)) - Allstate brand-204273256238---
    Policies in force for Commercial lines (count (thousands)) - National General-132142151----
    Policies in force for Commercial lines (count (thousands)) - Allstate Protection-284273256296---
    Policies in force for Commercial lines (count (thousands))--------
    Total Policies in force (Allstate Protection) (count (thousands))-37,76837,69337,67737,596---
    Number of events for Hurricanes/tropical storms (count)-3--5---
    Number of events for Tornadoes (count)-4010---
    Number of events for Wind/hail (count)-136184139---
    Number of events for Wildfires (count)-4215---
    Number of events for Freeze/other events (count)-21-1---
    Benefit ratio for Allstate Health and Benefits (percentage)-56.260.059.763.4---
    Policies in force for Allstate Protection Plans (count, thousands)-145.292148.086151.172156.818---
    Policies in force for Allstate Protection Plans (count)--------
    Policies in force for Allstate Dealer Services (count, thousands)-3,7763,7583,7333,703---
    Policies in force for Allstate Roadside (count)-553565604670---
    Policies in force for Allstate Roadside (count, thousands)--------
    Policies in force for Allstate Identity Protection (count, thousands)-2,8843,0312,5102,538---
    Policies in force for Allstate Identity Protection (count)--------
    Total policies in force for Protection Services (count)-152,505155,440158,019163,729---
    NamePositionExternal RolesShort Bio

    Thomas J. Wilson

    ExecutiveBoard

    Chairman of the Board, President, and CEO

    None

    Thomas J. Wilson has been with Allstate for 29 years, serving as CEO since January 2007 and Chairman since May 2008. He has led transformative growth strategies and digital innovation initiatives.

    View Report →

    Christine M. DeBiase

    Executive

    EVP, Chief Legal Officer, General Counsel, and Corporate Secretary

    None

    Christine M. DeBiase joined Allstate in January 2023, bringing extensive legal and corporate governance experience from her previous role at Brighthouse Financial.

    Elizabeth A. Brady

    Executive

    EVP, Chief Marketing, Customer, and Communications Officer

    None

    Elizabeth A. Brady joined Allstate in 2018 and oversees marketing, customer engagement, and communications strategies. She has held her current role since January 2020.

    Eric K. Ferren

    Executive

    SVP, Controller, and Chief Accounting Officer

    None

    Eric K. Ferren rejoined Allstate in May 2024 as Chief Accounting Officer, having previously served in various financial leadership roles at the company.

    Jesse E. Merten

    Executive

    EVP, Chief Financial Officer

    None

    Jesse E. Merten has been with Allstate since 2012, serving in various financial leadership roles. He became CFO in September 2022, overseeing financial strategy and operations.

    John C. Pintozzi

    Executive

    SVP, Controller, and Chief Accounting Officer

    None

    John C. Pintozzi has been with Allstate since 2012 and has served as Chief Accounting Officer since September 2019, overseeing financial reporting and compliance.

    John E. Dugenske

    Executive

    President, Investments and Corporate Strategy

    None

    John E. Dugenske joined Allstate in 2017 and has held several senior roles. He currently oversees investments and corporate strategy, focusing on risk management and long-term planning.

    Mario Rizzo

    Executive

    President, Property-Liability

    None

    Mario Rizzo has been with Allstate for over 33 years. He became President, Property-Liability in September 2022, overseeing a business that constitutes 90% of Allstate's insurance premiums.

    Mark Q. Prindiville

    Executive

    EVP, Chief Risk Officer

    None

    Mark Q. Prindiville joined Allstate in 2016 and became Chief Risk Officer in May 2020. He focuses on enterprise risk management and optimizing risk-adjusted returns.

    Robert Toohey

    Executive

    EVP, Chief Human Resources Officer

    None

    Robert Toohey joined Allstate in March 2022 as CHRO, focusing on talent development, diversity, and organizational effectiveness.

    Suren Gupta

    Executive

    President, Protection Products and Enterprise Services

    None

    Suren Gupta joined Allstate in 2011 and has led technology and enterprise services. He transitioned to his current role in 2023, focusing on protection products and operational efficiency.

    Zulfikar Jeevanjee

    Executive

    EVP, Chief Information Officer

    None

    Zulfikar Jeevanjee joined Allstate in 2018 and became CIO in October 2022. He oversees technology strategy and enterprise architecture.

    1. Given the DOJ lawsuit related to National General's lender-placed auto insurance program and the potential for SEC involvement, can you elaborate on the possible financial and operational impacts this litigation may have on Allstate's ongoing business and how you are preparing for potential outcomes?

    2. With the improvement in the auto underlying combined ratio largely driven by lower frequency, can you quantify any unsustainable benefits from frequency reductions this quarter, and how confident are you that these improvements are sustainable moving forward?

    3. You've increased advertising investment by approximately $300 million to support growth efforts in certain states; how are you measuring the effectiveness of this spend across different channels, and what metrics ensure that this substantial investment translates into profitable growth?

    4. In states like New York and New Jersey, where you're managing new business volumes due to challenges in achieving rate adequacy, how do you balance the need for profitability with the desire to grow market share, and what strategies are you implementing to achieve acceptable returns in these difficult markets?

    5. Although Allstate Protection Plans have shown a 20% revenue growth and expansion into Europe and Asia, what risks or challenges do you foresee that could impact maintaining this growth trajectory and profitability levels in this segment?

    Program DetailsProgram 1
    Approval DateAugust 2021
    End Date/DurationMarch 31, 2024
    Total additional amount$5 billion
    Remaining authorization amount$0 (as of March 31, 2024)
    DetailsThe program was initiated to return capital from the sale of life and annuity businesses and was suspended in July 2023 due to financial losses and increased catastrophe costs.
    NameStart DateEnd DateReason for Change
    Deloitte & Touche LLP1992 PresentCurrent auditor

    Recent press releases and 8-K filings for ALL.
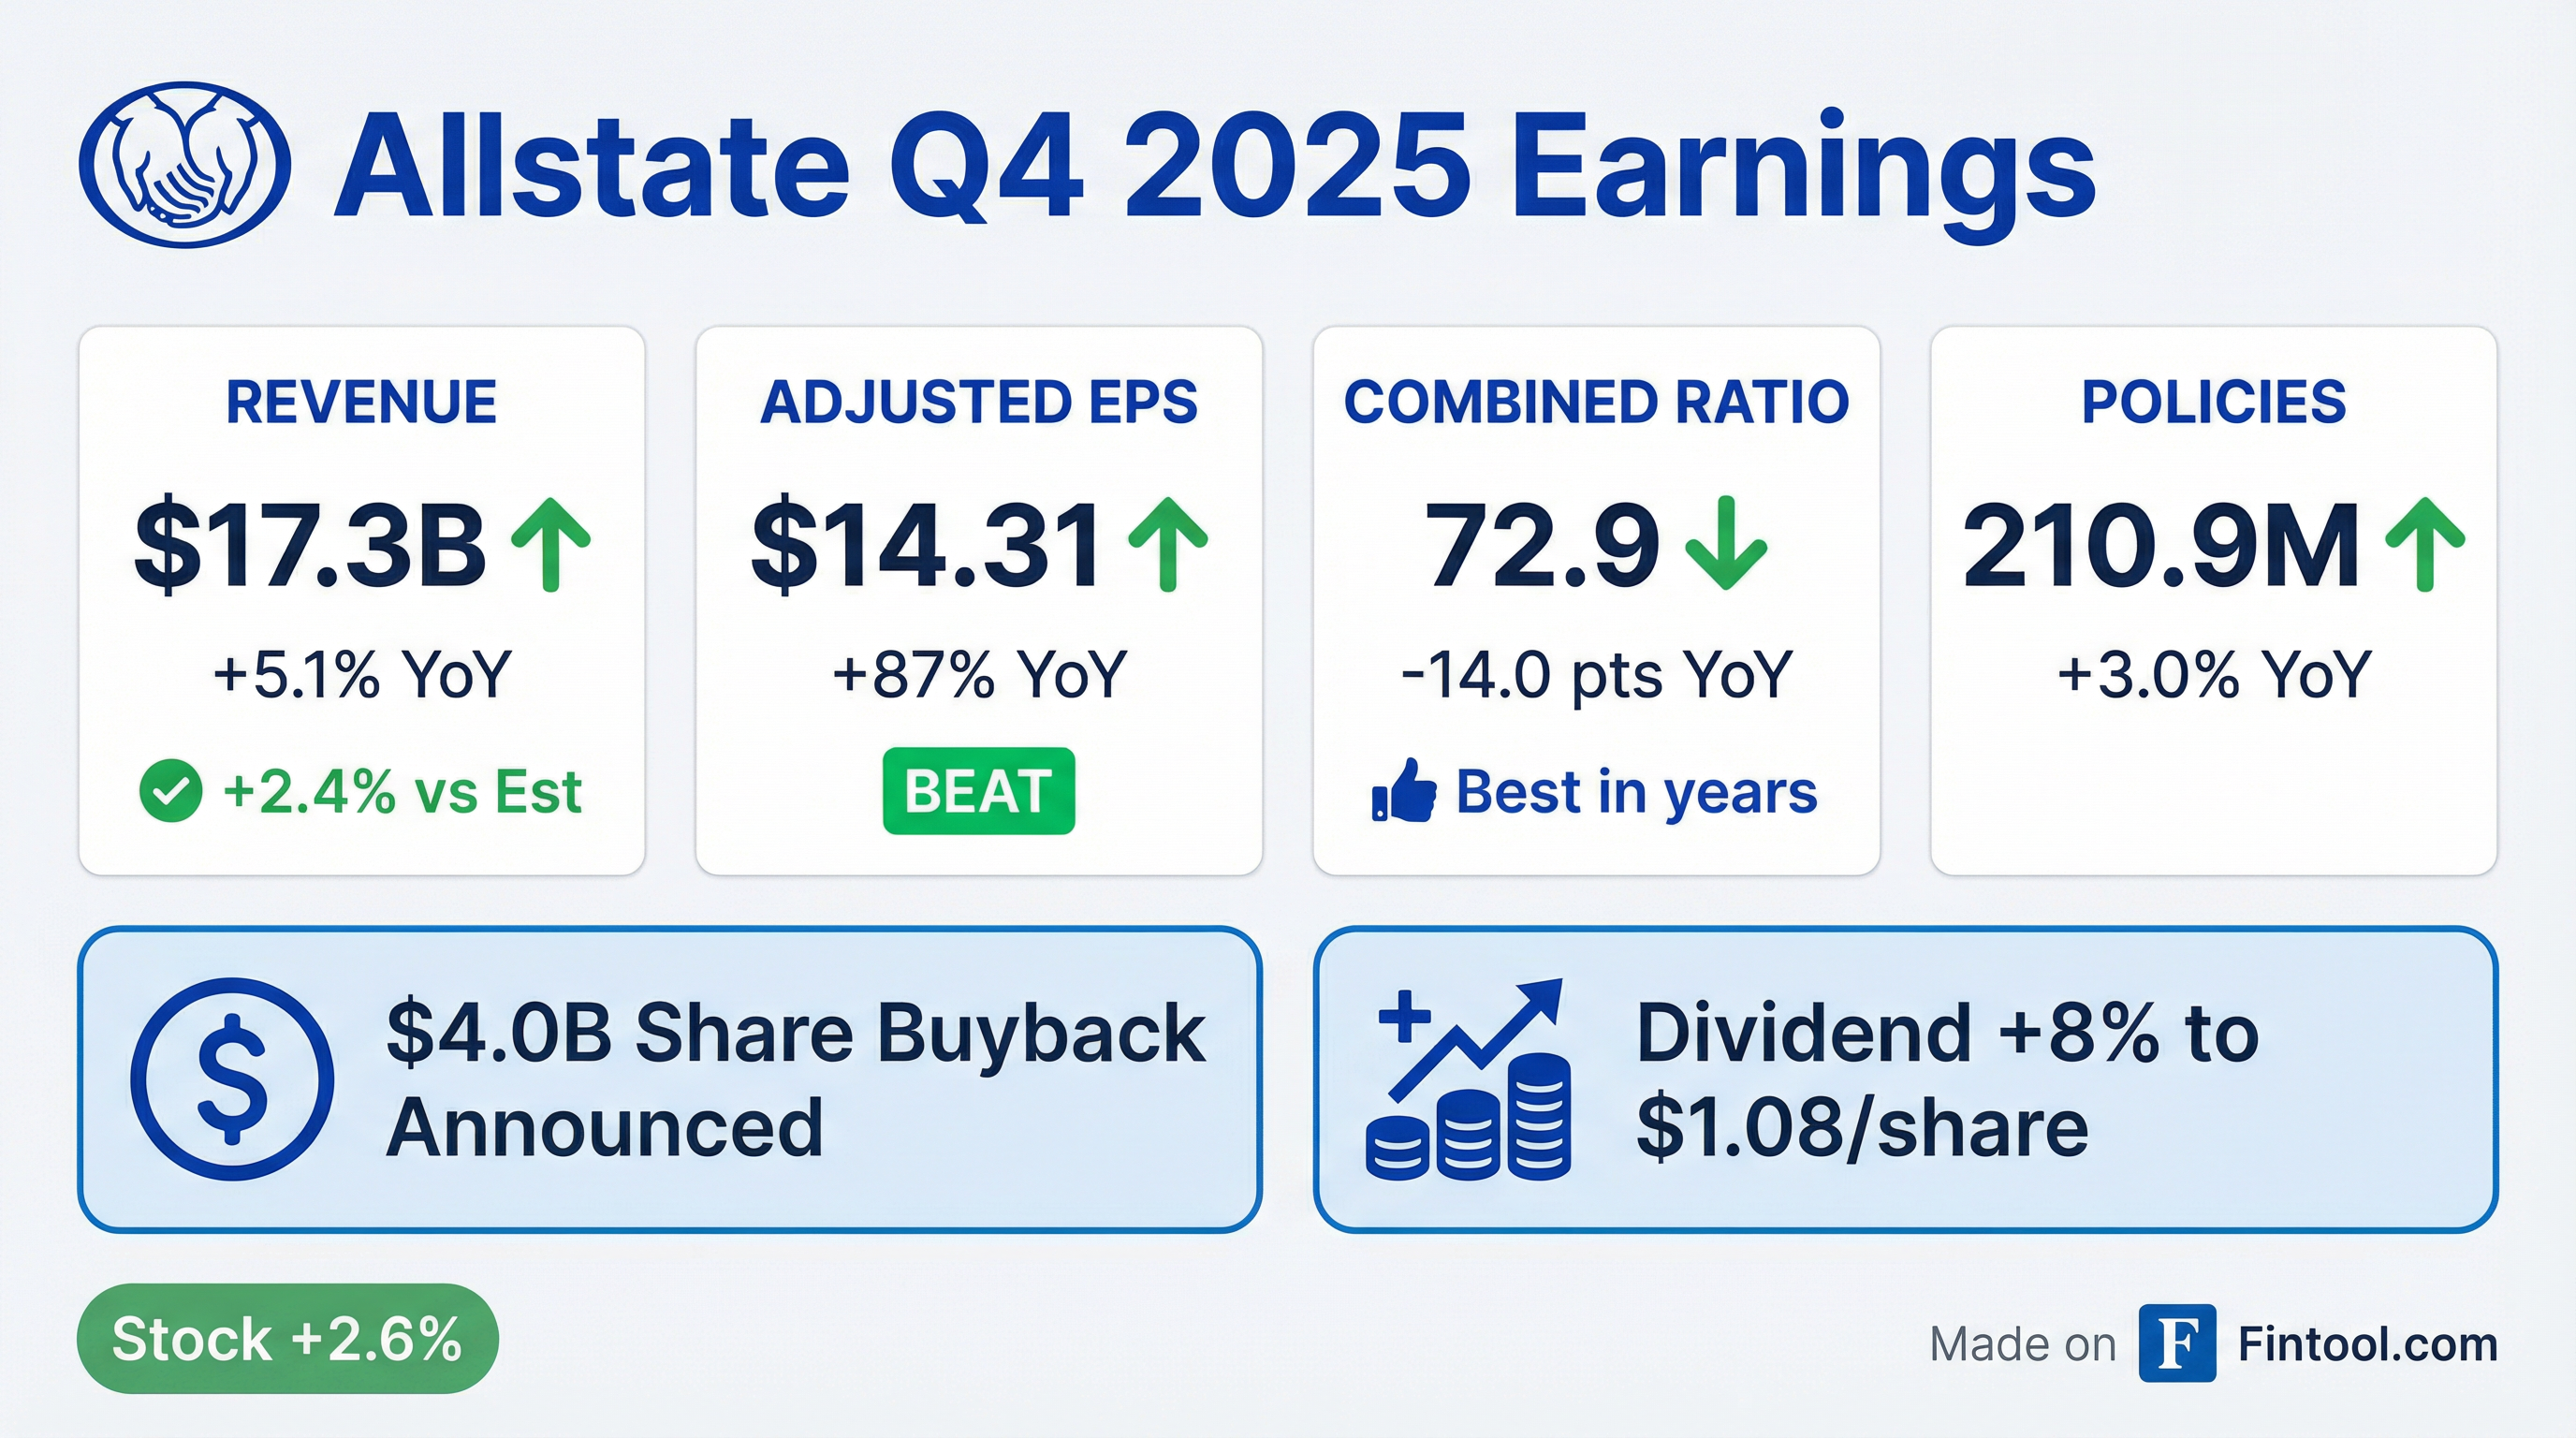
    Allstate outlines strategic transformation at William Blair Conference
    ALL
    M&A
    Dividends
    Share Buyback
    • Allstate detailed its Transformative Growth initiative aimed at increasing property liability market share through product innovation, improved customer retention, and multi-channel distribution.
    • The company emphasized significant investments in modernizing its technology platform, including a new policy administration system that supports direct, agent, and independent channels.
    • Strategic M&A activity was highlighted, notably the acquisition of National General for $4B and relevant divestitures to streamline the portfolio and enhance shareholder value.
    • The discussion also covered capital management strategies with a history of robust share buybacks and consistent dividend increases, alongside efforts to manage risks in key lines such as homeowners insurance.
    Jun 5, 2025, 1:40 PM
    Allstate Announces April 2025 Catastrophe Loss Estimates
    ALL
    • Catastrophe losses for April 2025 are estimated at $594 million pre-tax and $469 million after-tax from 11 events, with two events accounting for approximately 60% of the losses.
    • The report also updates policy counts across Auto, Homeowners, Other personal lines, and Commercial lines as of April 30, 2025, reflecting current operational exposure.
    May 15, 2025, 12:00 AM
    Allstate Reports Q1 2025 Earnings Results
    ALL
    Earnings
    Share Buyback
    Revenue Acceleration/Inflection
    Dividends
    • Total revenue reached $16.5 billion, marking a 7.8% increase over Q1 2024
    • Net income of $566 million and adjusted net income of $949 million ($3.53 per share) drove an adjusted ROE of 23.7% over the last twelve months
    • The Property-Liability segment delivered $360 million of underwriting income with a combined ratio of 97.4%, despite $3.3 billion in gross catastrophe losses
    • Capital management efforts included a $1.5 billion share repurchase program (with $100 million executed), a $1.0 dividend per share, and the $2.0 billion divestiture of Employer Voluntary Benefits
    • Expanded digital initiatives and distribution channels fueled growth, with auto new business up by 31.2% and homeowners new business increasing by 10%
    May 1, 2025, 1:01 PM
    Allstate Reports Q1 2025 Catastrophe Loss Estimates
    ALL
    Profit Warning
    • The 8-K filing dated April 17, 2025 details updated catastrophe loss estimates for March 2025 and the first quarter, highlighting key event figures and reinsurance recoveries.
    • For March 2025, estimated catastrophe losses were $1.04 billion (or $818 million after-tax), with expected recoveries of approximately $123 million; total Q1 losses reached $2.20 billion (or $1.74 billion after-tax).
    • The filing also provides updated counts of Allstate Protection policies in force across auto, homeowners, personal lines, and commercial lines.
    Apr 17, 2025, 12:00 AM
    Allstate Completes Sale of Employer Voluntary Benefits Business
    ALL
    M&A
    Share Buyback
    • Allstate Corp completed the sale of its Employer Voluntary Benefits business to StanCorp Financial Group for $2.0 billion, enhancing its strategic focus.
    • The transaction, together with the previously announced Group Health business sale, is expected to generate combined proceeds of $3.25 billion in 2025.
    • The sale resulted in a financial book gain of about $625 million, providing additional support for its share repurchase program and disciplined capital strategy.
    Apr 1, 2025, 12:00 AM
    Allstate Announces February 2025 Catastrophe Loss Estimates
    ALL
    • Estimated catastrophe losses for February 2025 were reported at $92 million (or $73 million after-tax), with year-to-date losses reaching $1.17 billion (or $922 million after-tax).
    • The release also detailed Allstate Protection Policies in Force, providing policy counts across auto, homeowners, other personal, and commercial lines as of February 28, 2025.
    • The information was disseminated via a monthly press release and incorporated as Exhibit 99 in the Form 8-K submission.
    Mar 20, 2025, 12:00 AM