Earnings summaries and quarterly performance for Simpson Manufacturing Co..
Executive leadership at Simpson Manufacturing Co..
Michael Olosky
President and Chief Executive Officer
Cassandra Payton
Executive Vice President, General Counsel
Jennifer Lutz
Executive Vice President, Human Resources
Jeremy Gilstrap
Executive Vice President, Innovation
Matt Dunn
Chief Financial Officer and Treasurer
Michael Andersen
Executive Vice President, Europe
Phil Burton
Executive Vice President, North America
Udit Mehta
Chief Technology Officer
Board of directors at Simpson Manufacturing Co..
Research analysts who have asked questions during Simpson Manufacturing Co. earnings calls.
Kurt Yinger
D.A. Davidson & Co.
8 questions for SSD
Dan Moore
B. Riley Securities
4 questions for SSD
Timothy Wojs
Robert W. Baird & Co.
4 questions for SSD
Tim Wojs
Robert W. Baird & Co. Incorporated
4 questions for SSD
Daniel Moore
CJS Securities, Inc.
2 questions for SSD
Trey Grooms
Stephens Inc.
2 questions for SSD
Will Gildea
CJS Securities
2 questions for SSD
Recent press releases and 8-K filings for SSD.
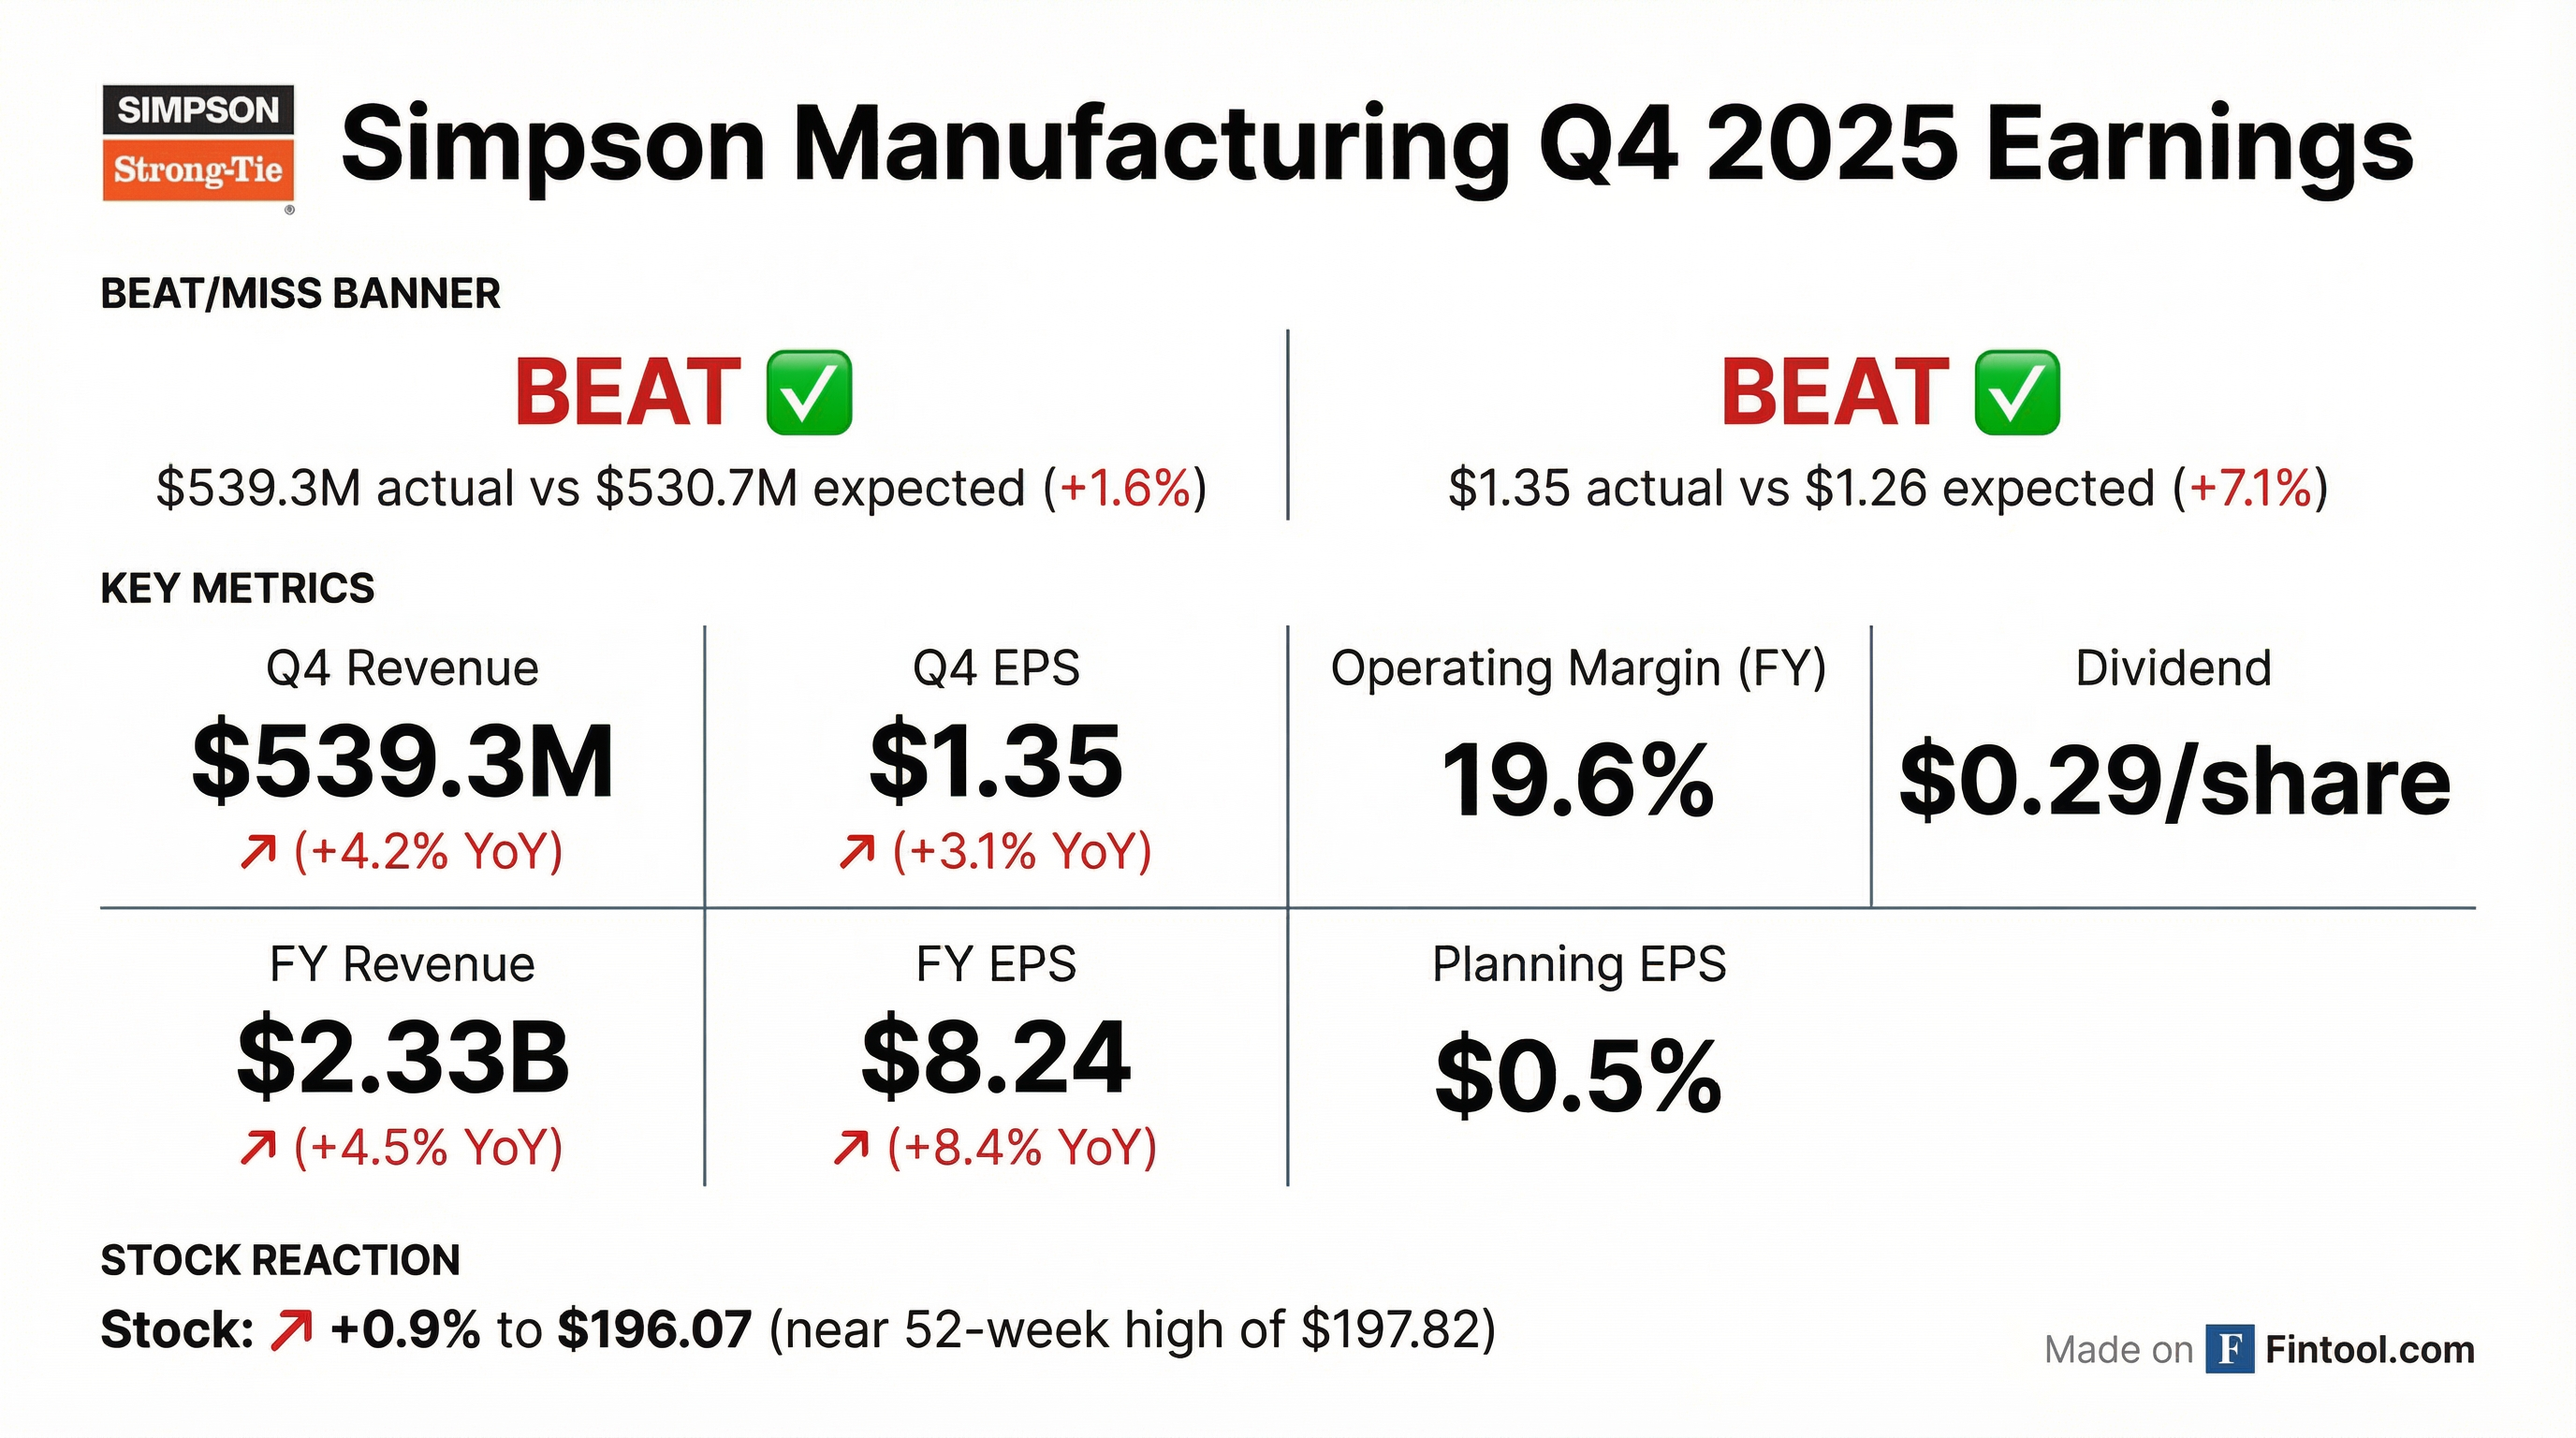
- Simpson Manufacturing Co. reported full year 2025 net sales of $2.3 billion, an increase of 4.5% from 2024, achieving a 19.6% operating margin and $544.3 million in adjusted EBITDA.
- For the fourth quarter of 2025, net income totaled $56.2 million or $1.35 per fully diluted share, with consolidated income from operations at $74.8 million.
- The company generated $458.6 million in cash flow from operations for the full year 2025 and returned capital to shareholders through $47.6 million in dividends and $120 million in share repurchases. A new share repurchase program for up to $150 million was authorized for 2026.
- For fiscal year 2026, Simpson Manufacturing Co. expects its consolidated operating margin to be in the range of 19.5%-20.5% and anticipates capital expenditures between $75 million and $85 million.
- The 2026 outlook assumes U.S. housing starts will be relatively flat year-over-year with continued challenging regional mix headwinds, while the European market is expected to see slight growth.
- Simpson Manufacturing Co. reported full year 2025 net sales of $2.3 billion, an increase of 4.5% from 2024, driven by 3% pricing, 1% acquisitions, and 1% foreign exchange, partially offset by a 1% decline in volume due to weaker housing starts.
- For Q4 2025, consolidated net sales increased 4.2% year-over-year to $539.3 million, with net income totaling $56.2 million or $1.35 per fully diluted share.
- The company achieved full year 2025 EPS growth that outpaced revenue by 390 basis points and improved its operating income margin by 30 basis points, narrowing the gap to its 20% target.
- Simpson Manufacturing Co. provided a 2026 outlook, expecting a consolidated operating margin in the range of 19.5%-20.5% and capital expenditures between $75-$85 million.
- The company also authorized a new share repurchase program for up to $150 million through the end of 2026 and anticipates absolute operating expenses to be down $10-$15 million in fiscal 2026 compared to 2025, benefiting from strategic cost savings initiatives expected to deliver at least $30 million in annualized savings.
- Simpson Manufacturing Co. reported full year 2025 net sales of $2.3 billion, an increase of 4.5% from 2024, with an operating margin of 19.6% and EPS growth outpacing revenue by 390 basis points.
- For Q4 2025, consolidated net sales increased 4.2% year-over-year to $539.3 million, and net income totaled $56.2 million or $1.35 per fully diluted share.
- The company issued fiscal 2026 guidance, projecting a consolidated operating margin between 19.5% and 20.5% and capital expenditures in the range of $75 million to $85 million.
- A new share repurchase program of up to $150 million was authorized through the end of 2026, with a commitment to return at least 35% of free cash flow to shareholders.
- Management expects North American housing starts to be relatively flat in 2026, while strategic cost savings initiatives are anticipated to deliver annualized savings of at least $30 million.
- For the fourth quarter of 2025, Simpson Manufacturing Co., Inc. reported net sales of $539.3 million, a 4.2% increase year-over-year, and net income per diluted share of $1.35.
- For the full year 2025, net sales reached $2.3 billion, up 4.5% from the previous year, with net income per diluted share of $8.24 and an operating income margin of 19.6%.
- The company repurchased $120.0 million in common stock during 2025, including $30.0 million in the fourth quarter, and declared a quarterly dividend of $0.29 per share.
- As of December 31, 2025, cash and cash equivalents totaled $384.1 million with total debt outstanding of $374.2 million.
- For fiscal year 2026, the company estimates its consolidated operating margin to be in the range of 19.5% to 20.5% and capital expenditures between $75.0 million and $85.0 million.
- Simpson Manufacturing (SSD) reported adding approximately $1 billion in revenue and $180 million in operating income from 2020 to 2024, despite a flat U.S. Housing Starts market, driven by net pricing, the Etanco acquisition, and share gains.
- The company aims for 20%+ operating income and has implemented $30 million in cost savings for 2026 to achieve this target in a potentially flat market.
- Strategic growth areas include the $1.5 billion truss market, where Simpson holds less than 10% share and is investing significantly in software development, and the new Gallatin, Tennessee facility, which will enable in-house fastener manufacturing and unlock new revenue opportunities.
- CapEx is projected to normalize to $75-$80 million in 2026, down from over $160 million in prior years, and the company approved a $150 million share repurchase for 2026, marking its highest single-year approval.
- Simpson Manufacturing (SSD) achieved $1 billion in revenue growth and $180 million in operating income growth from 2020 to 2024, despite a flat U.S. housing market.
- The company is targeting an additional $30 million in cost savings for 2026 to achieve its goal of 20%+ operating income.
- Key growth drivers include expanding its presence in the $1.5 billion truss market and new product innovation, supported by significant investments in software development and a new fastener manufacturing facility in Gallatin, Tennessee, opening tomorrow (January 15, 2026).
- Capital allocation priorities for 2026 include a $150 million share repurchase approval (the highest single year in company history) and a reduction in CapEx to a more normalized $75-$80 million range, down from over $160 million in previous years.
- Simpson Manufacturing achieved significant growth from 2020-2024, adding approximately $1 billion in revenue and $180 million in operating income despite a flat U.S. housing market.
- To reach its goal of 20%+ operating income, the company is implementing $30 million in cost savings for 2026, with most activity occurring in Q4 2025.
- Capital expenditures are projected to normalize to $75-$80 million annually starting in 2026, down from over $160 million in recent years, and a $150 million share repurchase program has been approved for 2026.
- The company is opening a new fastener manufacturing facility in Gallatin, Tennessee, to improve efficiency, reduce lead times, and support growth, especially in the mass timber segment.
- Simpson Strong-Tie (SSD) maintains a dominant 75%-80% market share in the $1.5 billion traditional structural connector market, while identifying a significant growth opportunity in the $1.5 billion truss plates market where it currently holds less than 10% share.
- The company implemented price increases in April (effective June 2) and mid-August (effective mid-October), which are expected to generate approximately $100 million in annualized pricing to largely offset $100 million in tariff-related cost increases.
- SSD is committed to achieving a 20% EBIT margin and plans to implement at least $30 million of annualized cost reductions in 2026 to support this target, even in a "flattish" market environment.
- Capital expenditures are projected to normalize from $150-$160 million annually to the $75-$80 million range per year, and the company announced an expected $150 million stock buyback for 2026, aiming to return at least 35% of free cash flow to shareholders.
- Simpson Manufacturing Co. (SSD) aims for a 20% EBIT margin in 2026, supported by a commitment to $30 million in annualized cost reductions to navigate a projected "flattish" market.
- Capital expenditures are expected to normalize from $150-$160 million per year to $75-$80 million per year, which will increase free cash flow.
- The company plans to return at least 35% of its free cash flow to shareholders, including an anticipated $150 million in share buybacks for 2026.
- Recent price increases, including an 8% weighted average increase across the U.S. product line effective June 2, were implemented to offset rising costs and approximately $100 million in annualized tariff costs on imported anchor bolts and fasteners.
- In the $1.5 billion component manufacturing market, where SSD holds less than a 10% share, the company is investing in software solutions, with each percentage point of share gain representing a $15 million opportunity.
- Simpson Manufacturing is targeting a 20%+ EBIT margin for 2026, supported by actions taken in late Q3/early Q4 2025 expected to deliver $30 million or more in annualized savings through restructuring and winding down underperforming businesses.
- The company anticipates a slightly above flat-ish U.S. housing market in 2025, with Zonda forecasting 0.4% growth in housing starts, and expects multi-family construction to ramp up.
- Simpson has implemented recent price increases totaling approximately $100 million, with $50 million attributed to general inflation (labor, freight, utilities) and the remainder partially offsetting a $100 million annualized cost headwind from tariffs on imported items.
- The company is investing heavily in digital solutions and component manufacturing software, which has been one of its fastest-growing segments, with new tools like CS Producer launched and Director and a fully integrated design tool planned for release by next year.
- Simpson plans to reduce capital expenditures to a more normal range of $75-$80 million and has increased share buyback amounts for 2025 and 2026, while also aiming to pay down approximately $350 million in debt from the Ataco acquisition.
Quarterly earnings call transcripts for Simpson Manufacturing Co..
Ask Fintool AI Agent
Get instant answers from SEC filings, earnings calls & more