Dow Jones Crosses 50,000 for First Time in 129-Year History
February 6, 2026 · by Fintool Agent
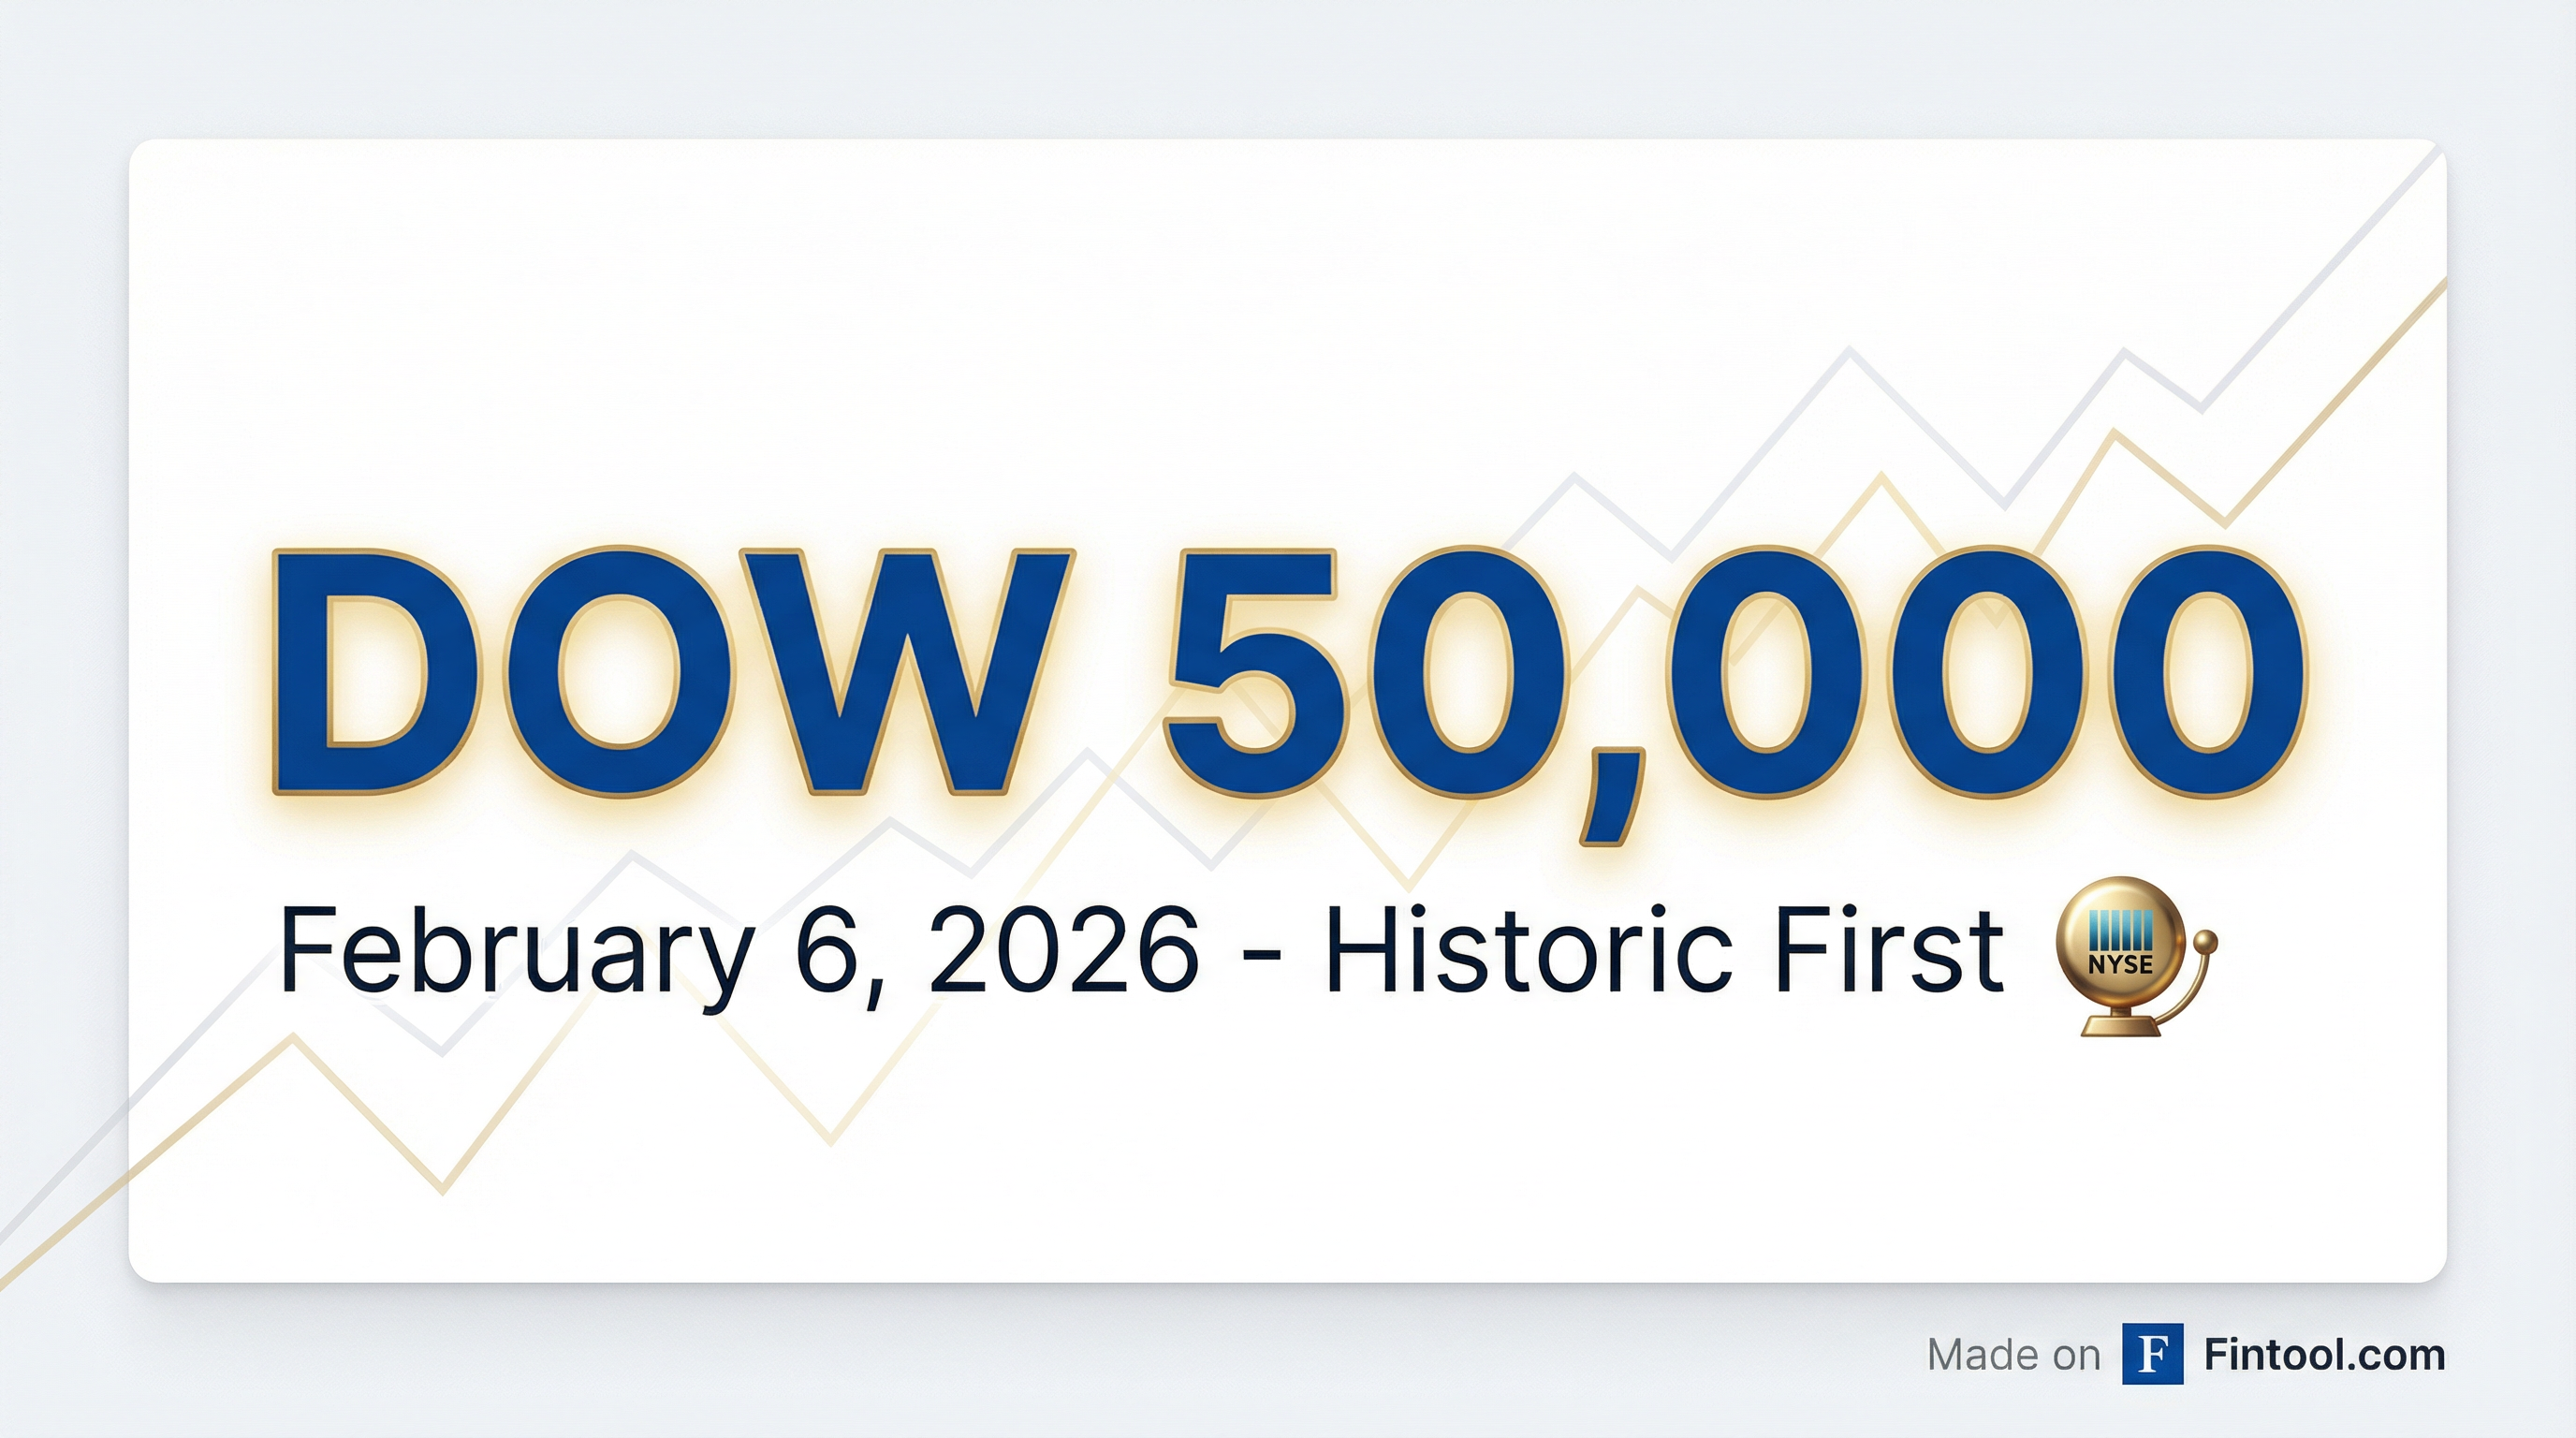
The Dow Jones Industrial Average surged past 50,000 for the first time in its 129-year history on Friday, closing at 50,008.35 after a 976-point rally (+1.99%) . The milestone caps a volatile 431-day journey from 40,000 that saw the index weathering a 2025 correction before powering to new highs on the back of infrastructure spending, AI demand, and a broadening bull market .
The Rally That Broke the Record
Friday's surge was driven by a powerful snapback in technology stocks after a brutal midweek selloff. Nvidia jumped 7.3%, Caterpillar rose 6.4%, and 3m gained 4% .
The catalyst was a better-than-expected University of Michigan consumer sentiment reading of 57.3 — the highest since August 2025 — and a drop in year-ahead inflation expectations to 3.5% from 4.0%, the lowest in over a year .
"The positives of the Dow getting to that new milestone is it's showing we're seeing a broadening in the market," said Matt Dmytryszyn, CIO at Composition Wealth. "It's not just tech stocks and AI. We're seeing financial and industrial companies becoming more broadly bought."
The Road From 40,000 to 50,000
The path wasn't linear. After first closing above 40,000 on May 17, 2024, the Dow hit 45,000 by December 4, 2024. But April 2025 brought a sharp correction, dropping the index to 37,646 — a 15% pullback from highs .
| Milestone | Date | Trading Days from Prior |
|---|---|---|
| 40,000 | May 17, 2024 | — |
| 45,000 | December 4, 2024 | 139 |
| Low: 37,646 | April 8, 2025 | — |
| 50,000 | February 6, 2026 | 292 (from 45K) |
The full journey from 40,000 to 50,000 took 431 trading days — roughly 21 months. For context, it took just over a year for the Dow to climb from 30,000 (November 2020) to 36,000, but the pandemic-era bull market moved faster than today's more mature cycle.
Who Powered the Gains
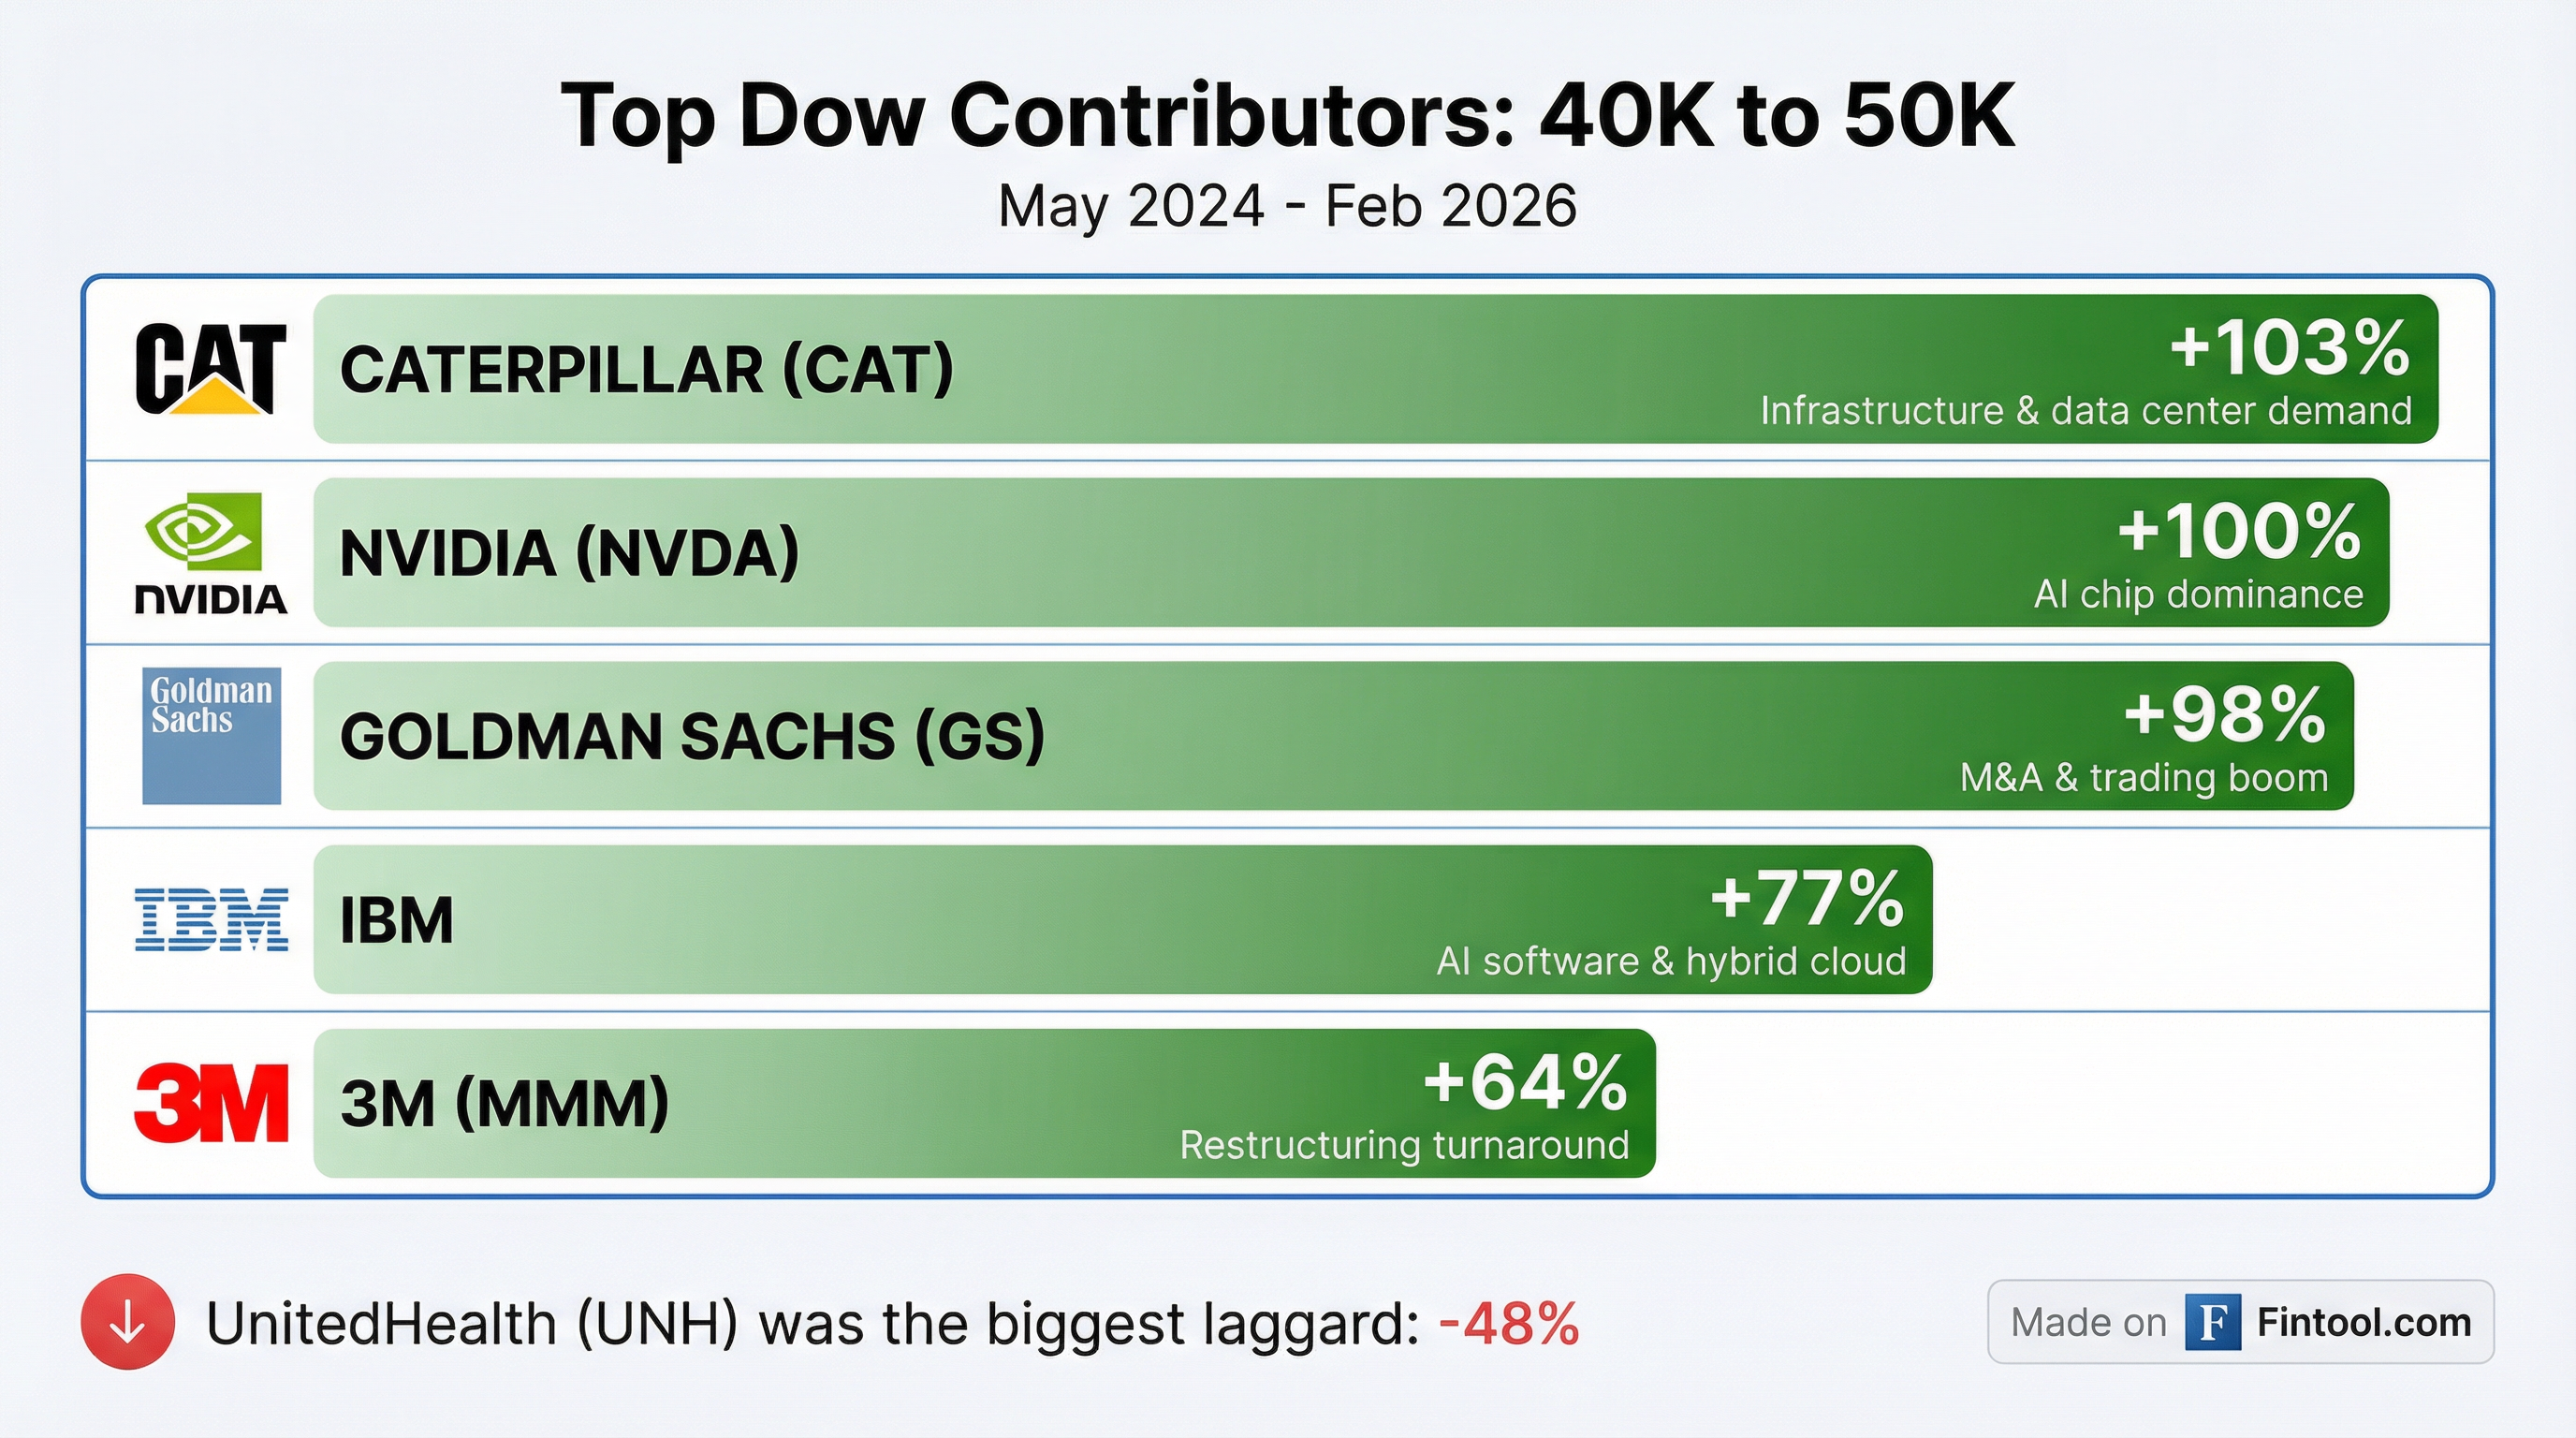
The Dow is price-weighted, meaning higher-priced stocks have more influence. Goldman Sachs, Caterpillar, and Ibm contributed the most to the 10,000-point gain since May 2024 .
| Company | Return (May '24 - Feb '26) | Driver |
|---|---|---|
| Caterpillar | +103% | Infrastructure & data center construction |
| Nvidia | +100% | AI chip dominance |
| Goldman Sachs | +98% | M&A and trading boom |
| Ibm | +77% | AI software and hybrid cloud |
| 3m | +64% | Restructuring turnaround |
| Apple | +47% | Steady iPhone demand |
| Unitedhealth | -48% | Regulatory and margin pressure |
Goldman Sachs posted its best year since 2009, with net income jumping to $17.2 billion in FY2025 from $14.3 billion a year earlier . The bank recently announced a 12.5% dividend increase and is now partnering with Anthropic to build AI-powered agents for banking tasks .
Caterpillar's revenue grew to $64 billion in FY2025 as data center construction and infrastructure spending accelerated globally.
A Broadening Bull Market
The Dow's outperformance in 2026 reflects a rotation away from mega-cap tech. While the tech-heavy Nasdaq fell 2% for the week, the Dow gained 2% as investors favored industrials, financials, and healthcare .
The U.S. stock market is now in its fourth year of a bull run that began in late 2022. Key tailwinds include:
- Improving earnings growth across sectors beyond tech
- Rate cut expectations from the Federal Reserve later this year
- Resilient consumer spending despite elevated inflation
- Infrastructure investment from the 2021 federal bill continuing to flow
"Fundamentals remain solidly in place — improving earnings growth and resilient consumer spending," said Rob Haworth, senior investment strategy director at US Bank Asset Management .
What 50,000 Means — and What It Doesn't
For all its symbolism, Dow 50,000 is a round number, not a signal. The index's price-weighted methodology and narrow 30-stock composition make it less representative than the S&P 500 or Russell 3000.
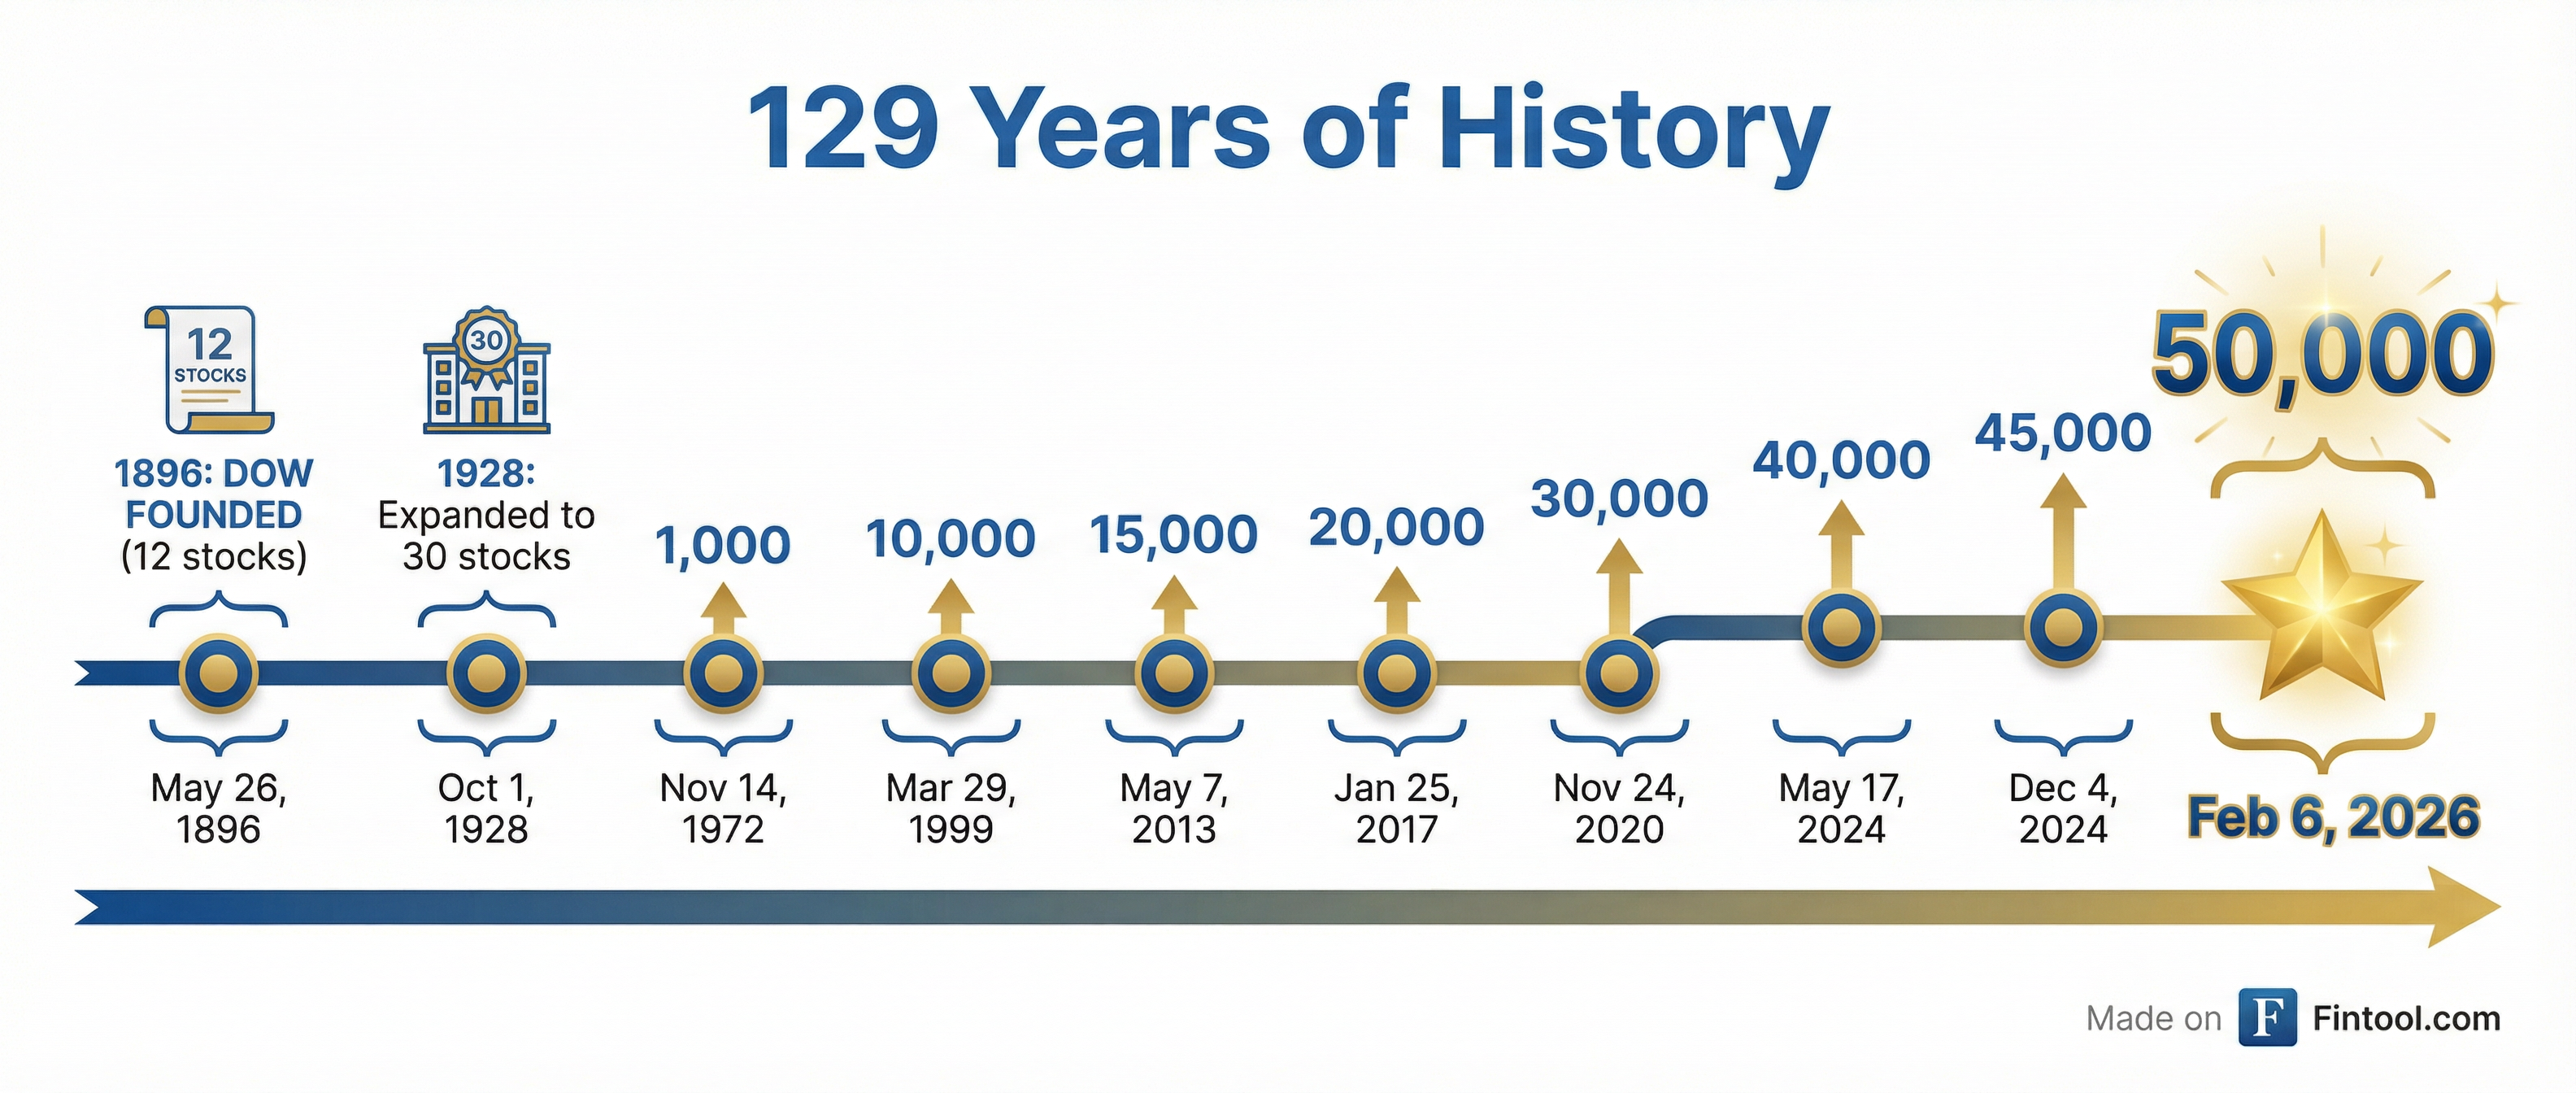
But the Dow retains cultural significance. Founded in 1896 by Charles Dow and Edward Jones with just 12 industrial stocks, it remains America's most-watched market barometer — the number millions hear on the evening news .
Historical Milestones
| Level | Date | Time to Reach |
|---|---|---|
| 1,000 | November 14, 1972 | 76 years |
| 10,000 | March 29, 1999 | 27 years |
| 20,000 | January 25, 2017 | 18 years |
| 30,000 | November 24, 2020 | 3.8 years |
| 40,000 | May 17, 2024 | 3.5 years |
| 50,000 | February 6, 2026 | 1.7 years |
The accelerating pace reflects both sustained earnings growth and the compounding nature of equity returns — but also elevated valuations that have expanded during the AI-driven rally.
What to Watch
- Fed policy: Markets are pricing in rate cuts later this year. Any shift in guidance could alter the trajectory.
- Earnings trajectory: Can the rally broaden further into small caps and value stocks?
- Geopolitical risks: Trade tensions and global conflicts remain wildcards.
- Tech correction risk: The AI capex boom is drawing scrutiny. Amazon's $200B capex forecast rattled shares this week .
For now, Dow 50,000 joins 10,000, 20,000, and 30,000 as milestones that seemed impossible until they weren't.
Related: Goldman Sachs · Caterpillar · Ibm · Nvidia · Apple · JPMorgan · 3m · Unitedhealth