Earnings summaries and quarterly performance for KEMPER.
Executive leadership at KEMPER.
C. Thomas Evans, Jr.
Interim President and Chief Executive Officer
Bradley Camden
Executive Vice President and Chief Financial Officer
Charles Brooks
Executive Vice President, Operations and Systems
Christopher Flint
Executive Vice President and President, Kemper Life
John Boschelli
Executive Vice President and Chief Investment Officer
Laura Rock
Executive Vice President, Chief Human Resources Officer
Matthew Hunton
Executive Vice President and President, Kemper Auto
Board of directors at KEMPER.
Research analysts who have asked questions during KEMPER earnings calls.
Andrew Kligerman
TD Cowen
4 questions for KMPR
Jon Paul Newsome
Piper Sandler & Co.
4 questions for KMPR
Brian Meredith
UBS
3 questions for KMPR
Charles Peters
Raymond James
3 questions for KMPR
C. Gregory Peters
Raymond James
1 question for KMPR
Recent press releases and 8-K filings for KMPR.
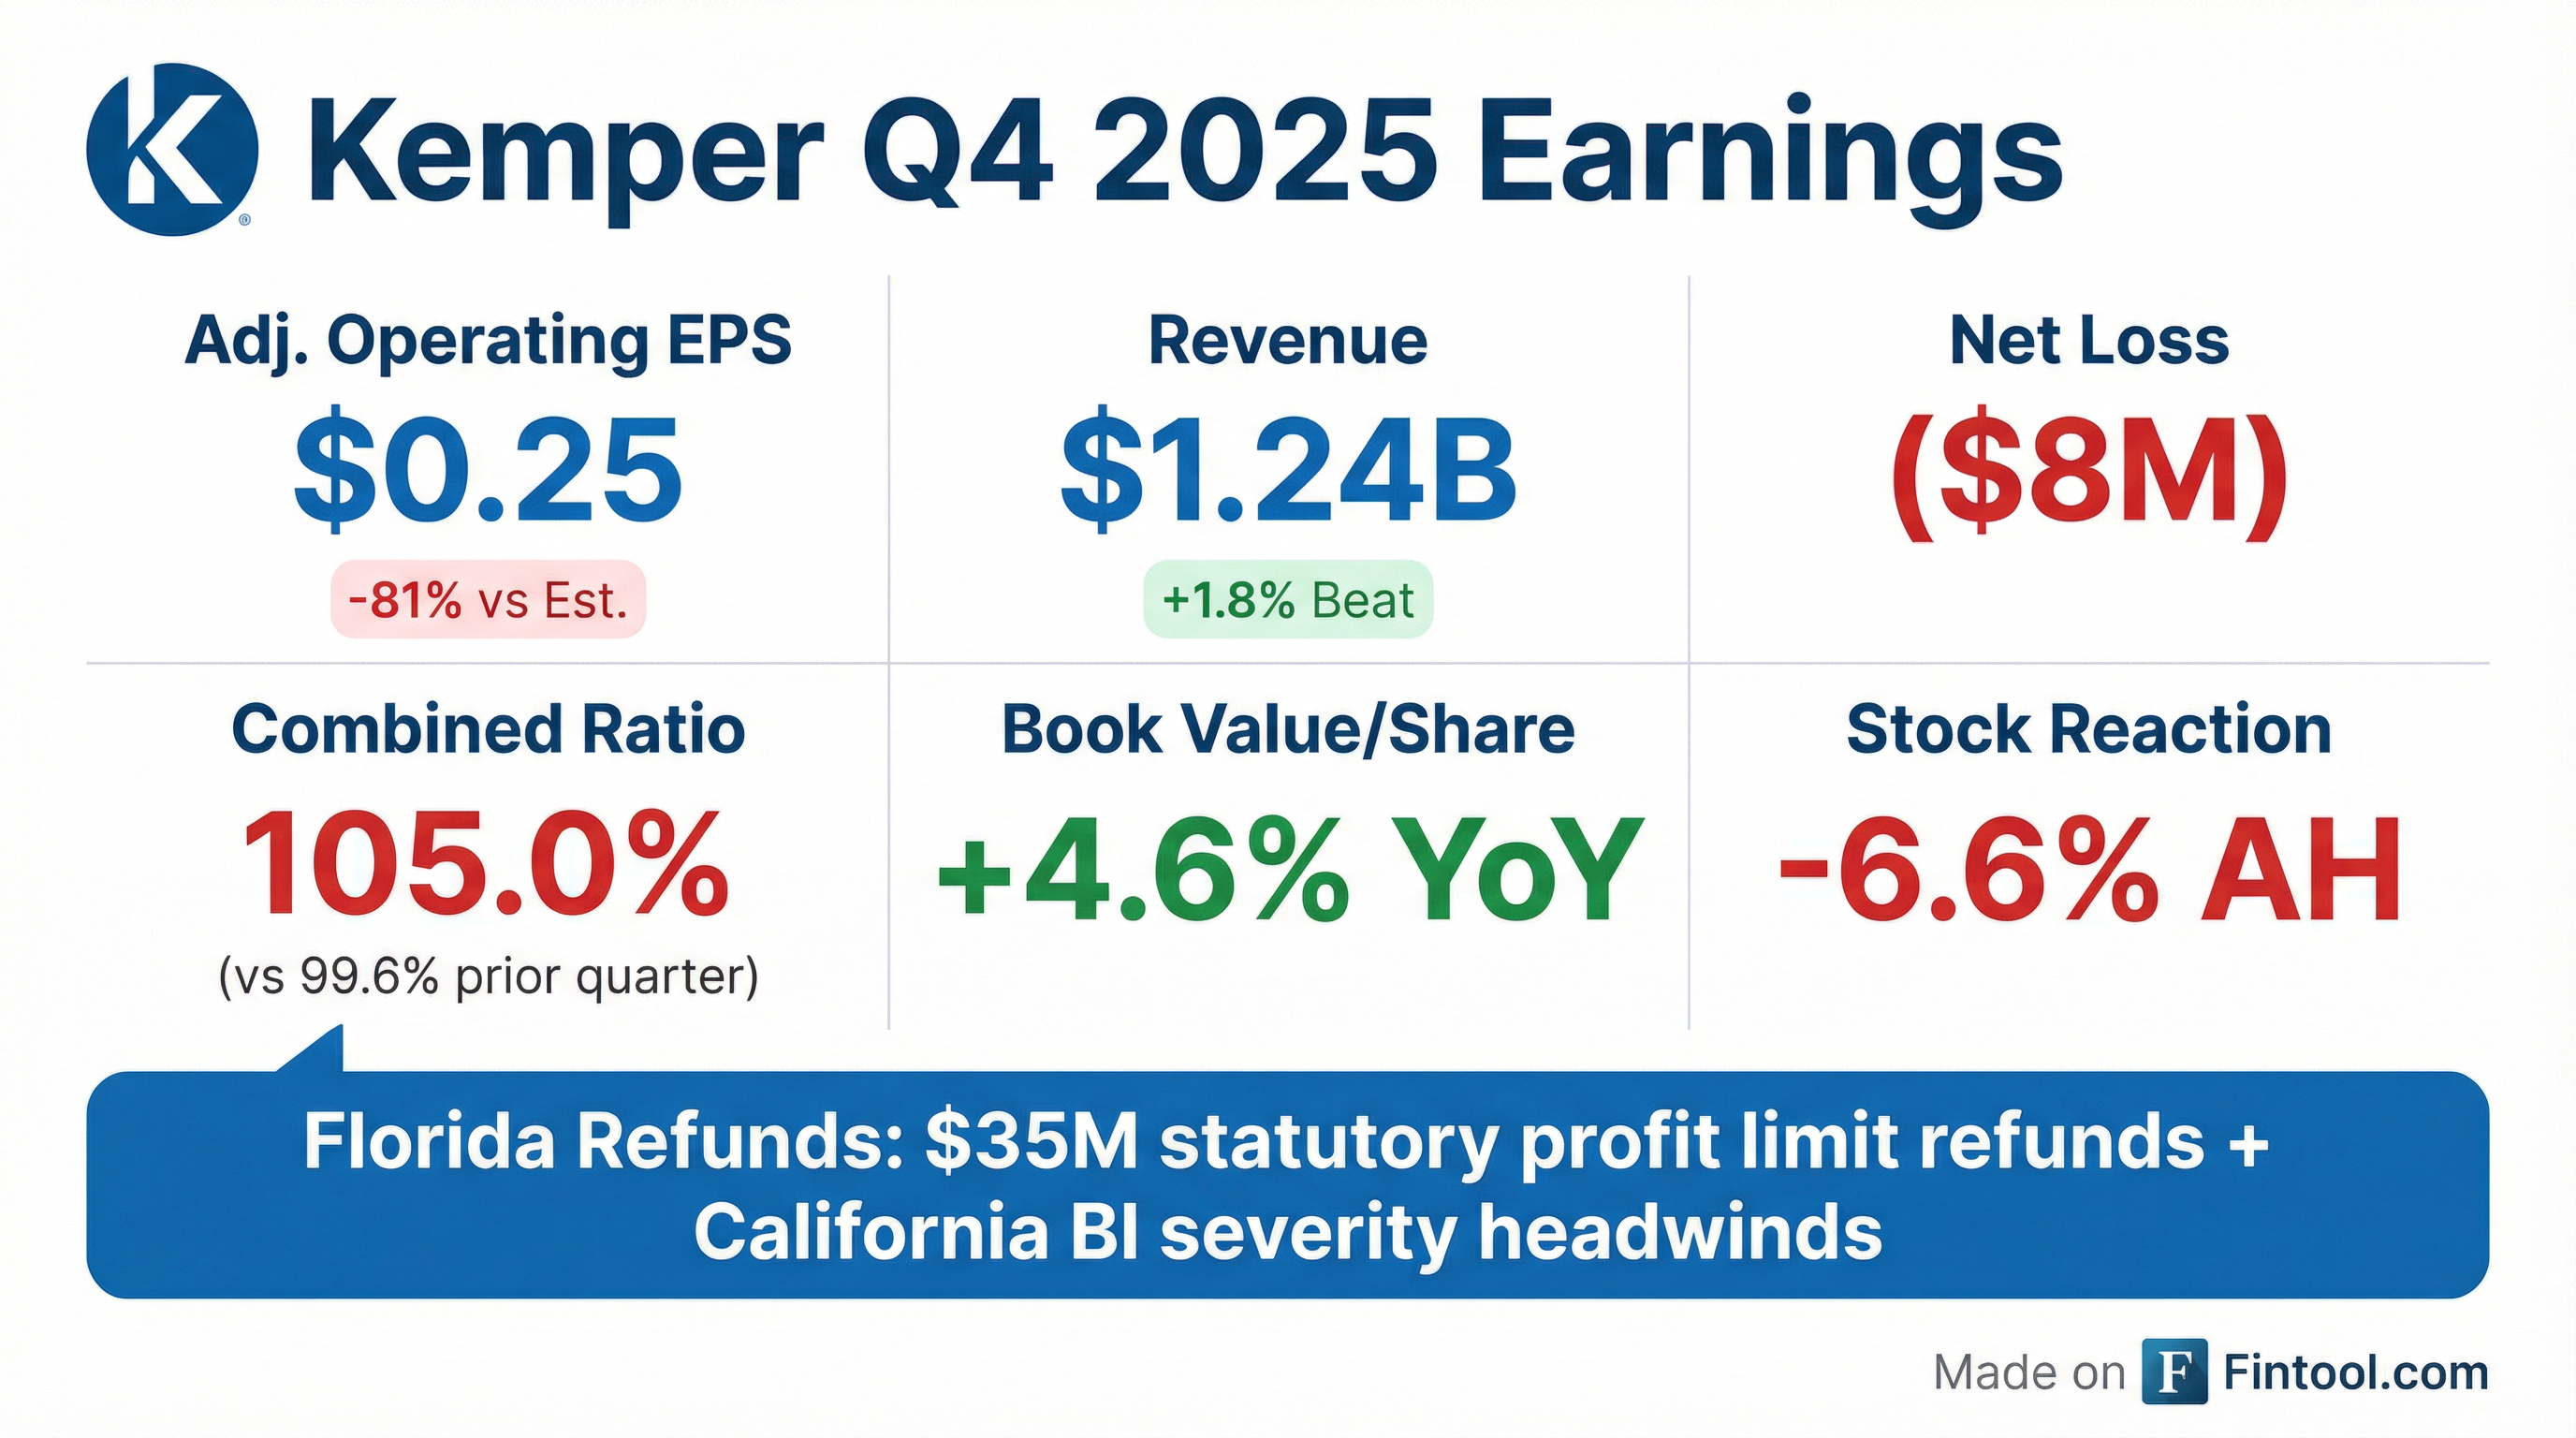
- Kemper Corporation reported a net loss of $8.0 million, or $(0.13) per share, and Adjusted Consolidated Net Operating Income of $14.6 million, or $0.25 per share, for the fourth quarter of 2025. Total revenues for the quarter decreased to $1,131.4 million.
- The company's Specialty Property & Casualty operating results were negatively impacted by bodily injury severity, while its Life business delivered solid results.
- Management is implementing actions to improve profitability, including rate adjustments, cost efficiency initiatives with cumulative run-rate savings increasing to $33 million, and leadership changes.
- Kemper repurchased $50 million of common stock during Q4 2025, bringing the 2025 total to ~$300 million, and retired $450 million of debt in 2025.
- The company maintains strong parent liquidity at over $1.0 billion, and its trailing 12-month operating cash flow was ~$585 million.
- Kemper Corporation reported a net loss of $21.0 million, or $(0.34) per share, for the third quarter of 2025, compared to net income of $73.7 million, or $1.14 per diluted share, for the third quarter of 2024.
- Adjusted Consolidated Net Operating Income for Q3 2025 was $20.4 million, or $0.33 per diluted share, a decrease from $105.0 million, or $1.62 per diluted share, in Q3 2024.
- Total revenues for the third quarter of 2025 increased by $60.8 million to $1,239.7 million compared to the third quarter of 2024.
- The company repurchased approximately 5.1 million shares for a total cost of approximately $266 million from July 1st through October 31st, at an average price of $52.65.
- Parent liquidity remained strong at approximately $1.0 billion, and the Specialty P&C segment's Underlying Combined Ratio was 99.6% for Q3 2025.
- Kemper Corporation reported net income of $72.6 million ($1.12 per diluted share) and Adjusted Consolidated Net Operating Income of $84.1 million ($1.30 per diluted share) for the second quarter of 2025.
- Total revenues for Q2 2025 increased by $95.7 million to $1,225.6 million compared to Q2 2024, primarily due to a $148.2 million increase in Specialty Property & Casualty Insurance earned premiums.
- The company achieved a 14.9% Adjusted Return on Equity and its Specialty P&C segment saw Policies-in-Force (PIF) grow 8% year-over-year.
- Kemper reported strong parent liquidity of approximately $1.1 billion and repurchased $80 million of stock between April 1 and July 31, 2025, with a new $500 million repurchase authorization.
- Kemper Corp filed an 8-K on May 8, 2025, reporting shareholder approval of its Second Amended and Restated 2023 Omnibus Plan, which increased the authorized common stock by 625,000 shares.
- The document details vote outcomes at the Annual Meeting on May 7, 2025, including the election of 10 directors, advisory votes on executive compensation, and approval of the Omnibus Plan and auditor selection.
- Kemper Corp delivered robust Q1 2025 results with a net income of approximately $100 million and $106.4 million in adjusted consolidated net operating income, reflecting significant improvement over Q1 2024 .
- The company posted operating cash flow of roughly $520 million, nearing historical peak levels and underlining effective liquidity management .
- Improved financial stability was marked by a debt-to-capital ratio of 22.9%, achieved through a $450 million debt repayment and a $4 million share repurchase .
- Key specialty segments performed strongly, with the Specialty Auto and Specialty Property & Casualty businesses achieving an underlying combined ratio near 92% and robust year-over-year premium and policy growth .
- Management highlighted that potential tariff impacts are expected to be a one-time cost, manageable through targeted rate adjustments and frequent repricing in key markets such as California, Florida, and Texas .
- Kemper’s CEO and CFO detailed a strong turnaround in 2024, driven by rate increases in California (55% of auto premiums) and disciplined underwriting, setting the stage for robust premium growth in 2025.
- The management explained that the current underwriting approach and pace of new business expansion are effectively absorbing the new business penalty, maintaining attractive combined ratios near 93%.
- The company highlighted its strong balance sheet with over $1 billion in liquidity, a $450 million debt repayment in February 2025, and approximately $40 million in stock buybacks.
- Kemper’s Life business was noted as a core, stable performer that contributes consistent cash flows and strong ROE, while investment portfolio adjustments are expected to boost net investment income.
- Kemper delivered strong Q4 2024 performance with net income of $97.4 million , earnings of $1.51 per diluted share, and adjusted operating income of $115.1 million .
- The Specialty P&C (including Specialty Auto P&C) segment outperformed with an underlying combined ratio of 91.7% and achieved notable policy in-force (PIF) growth, reversing its typical seasonal decline .
- The company maintained robust financial flexibility with $1.3 billion in liquidity and enhanced capital returns by repurchasing $14 million of stock .
- Kemper increased its quarterly dividend to $0.31 per share and advanced plans to retire $450 million in debt, reinforcing its balance sheet .
- These results represent a significant improvement over Q4 2023 and support strong annual performance .
Quarterly earnings call transcripts for KEMPER.
Ask Fintool AI Agent
Get instant answers from SEC filings, earnings calls & more