Earnings summaries and quarterly performance for MONOLITHIC POWER SYSTEMS.
Executive leadership at MONOLITHIC POWER SYSTEMS.
Michael Hsing
Chief Executive Officer and President
Bernie Blegen
Executive Vice President and Chief Financial Officer
Deming Xiao
Executive Vice President, Global Operations
Maurice Sciammas
Executive Vice President, Worldwide Sales and Marketing
Saria Tseng
Executive Vice President, Strategic Corporate Development, General Counsel and Corporate Secretary
Board of directors at MONOLITHIC POWER SYSTEMS.
Research analysts who have asked questions during MONOLITHIC POWER SYSTEMS earnings calls.
Quinn Bolton
Needham & Company, LLC
8 questions for MPWR
Tore Svanberg
Stifel Financial Corp.
8 questions for MPWR
Gary Mobley
Loop Capital
7 questions for MPWR
Joshua Buchalter
TD Cowen
6 questions for MPWR
Richard Schafer
Oppenheimer & Co. Inc.
6 questions for MPWR
Ross Seymore
Deutsche Bank
6 questions for MPWR
Chris Caso
Wolfe Research LLC
5 questions for MPWR
Jack Egan
Charter Equity Research
5 questions for MPWR
Kelsey Chia
Citigroup Inc.
5 questions for MPWR
Joe Quatrochi
Wells Fargo
4 questions for MPWR
William Stein
Truist Securities
4 questions for MPWR
Christopher Caso
Wolfe Research
3 questions for MPWR
Joseph Quatrochi
Wells Fargo Securities, LLC
2 questions for MPWR
Josh Buchalter
Cowen
2 questions for MPWR
Rick Schafer
Oppenheimer & Co.
2 questions for MPWR
Sebastien Naji
William Blair
2 questions for MPWR
Hans Mosesmann
Rosenblatt Securities
1 question for MPWR
Wei Chia
Citigroup
1 question for MPWR
William Kerwin
Morningstar
1 question for MPWR
Recent press releases and 8-K filings for MPWR.
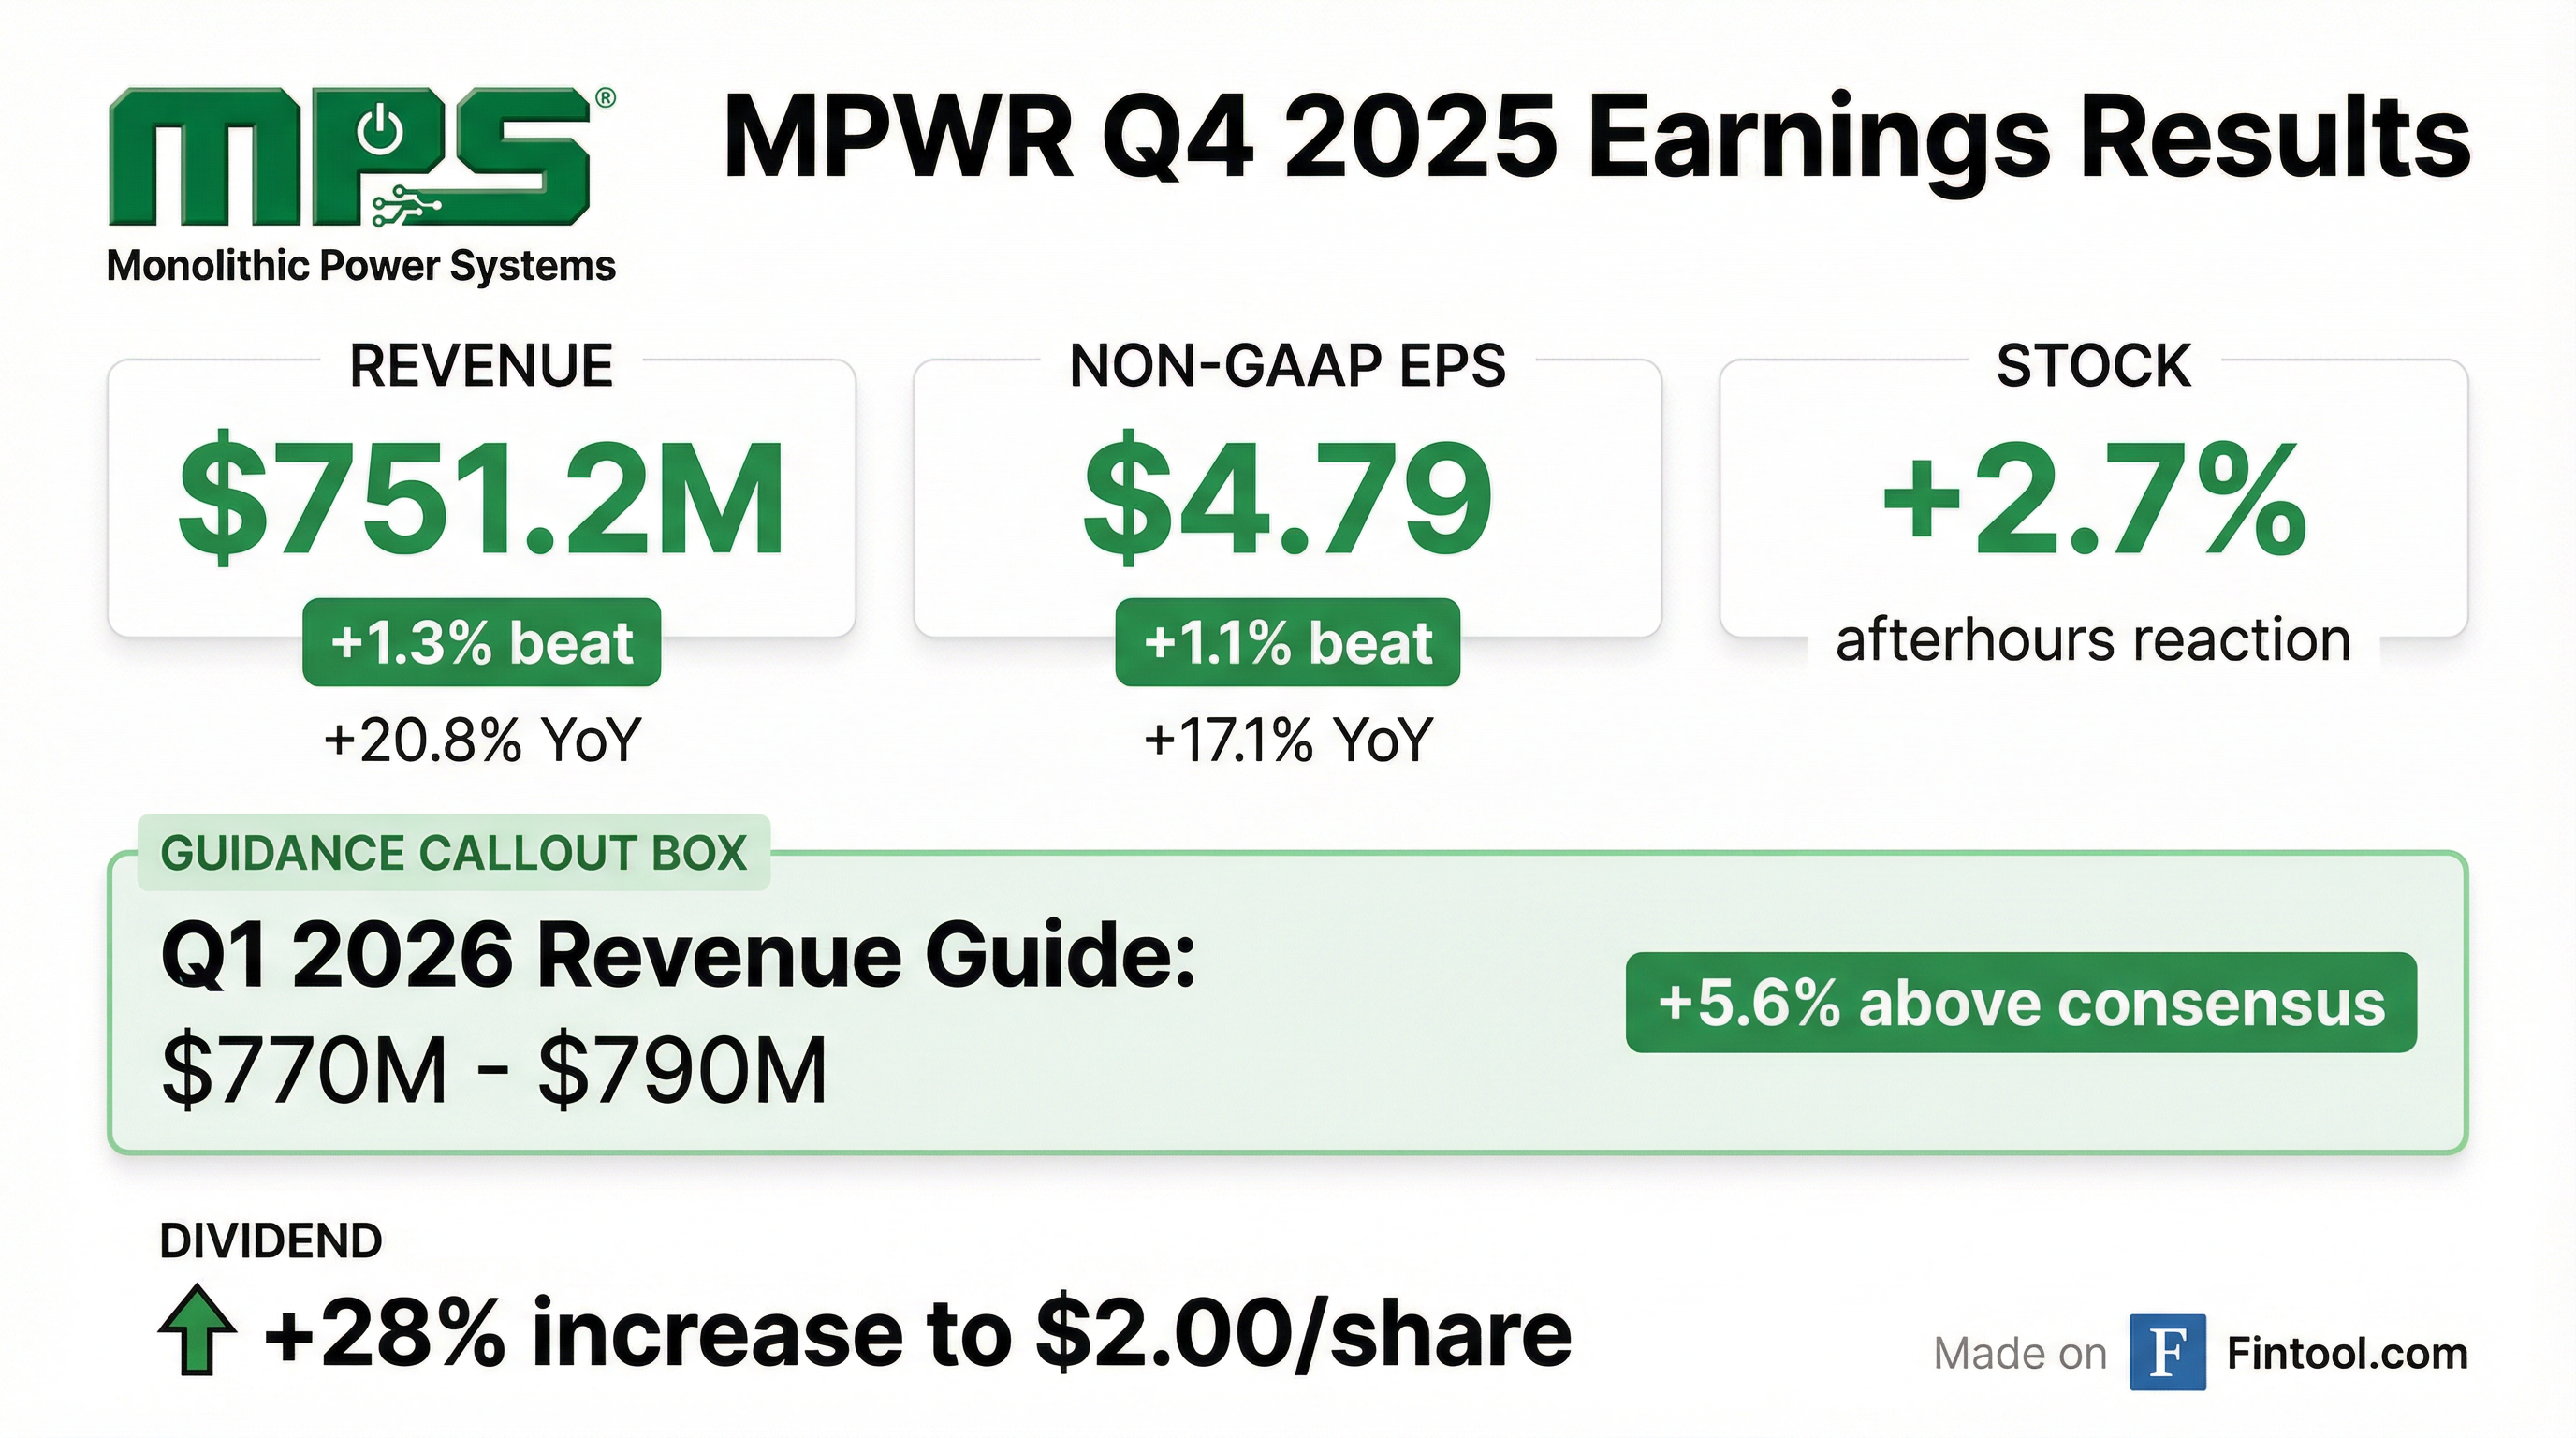
- FY 2025 revenue of $2.8 billion, up 26.4% YoY; Q4 2025 revenue of $751.2 million, +1.9% QoQ and +20.8% YoY
- CFO Bernie Blegen to retire after 15 years; Rob Dean named Interim CFO
- Quarterly dividend increased 28% to $2.00 per share; over 72% of free cash flow returned to shareholders in past three years
- Book-to-bill > 1 in Q4, with backlog extending into Q2/Q3 2026, underpinned by strong enterprise data demand
- Non-enterprise data end markets grew > 40% YoY; secured over $4.0 billion of geographically balanced capacity
- Monolithic reported FY2025 revenue of $2.8 billion, up 26.4% y/y, and Q4 revenue of $751.2 million, up 20.8% y/y and 1.9% q/q.
- CFO Change: Bernie Blegen to retire after 15 years at MPS (10 as CFO); Rob Dean named Interim CFO.
- Dividend increased 28% to $2.00 per share, with >72% of free cash flow returned to shareholders since 2023.
- FY2025 segment growth: non-enterprise data +40% y/y, automotive +43% y/y; 2026 enterprise data growth guidance raised to ≥50%.
- Sampled 800 V data center power solutions and launched 48 V eFuse and kilowatt-level zonal controller for automotive.
- MPS delivered record Q4 revenue of $751.2 M (+20.8% YoY) and full-year revenue of $2.8 B (+26.4% YoY).
- CFO Change: Bernie Blegen announced his retirement after 10 years as CFO; Rob Dean will serve as Interim CFO.
- Dividend: Quarterly dividend raised 28% to $2/share, with over 72% of free cash flow returned to shareholders via buybacks and dividends over the past three years.
- Raised enterprise data growth outlook, targeting at least 50% growth in 2026, supported by a book-to-bill >1 and backlog extending into Q2/Q3 2026.
- Non-enterprise data markets grew >40% YoY; record module revenue and new automotive solutions (48 V eFuse, kilowatt zonal controller) underscore a diversified growth strategy.
- Monolithic Power Systems delivered full-year 2025 revenue of $2.79 billion, up 26.4% year-over-year, with a GAAP gross margin of 55.2% and operating margin of 26.1%.
- In Q4 2025, revenue reached $751.2 million, up 20.8% year-over-year and 1.9% sequentially; GAAP diluted EPS was $3.46.
- On a non-GAAP basis, full-year 2025 net income was $858.4 million or $17.77 per diluted share, a 25.8% increase over 2024.
- For Q1 2026, MPS forecasts revenue of $770 million to $790 million and will raise its quarterly dividend 28% to $2.00 per share.
- Record 2025 revenue of $2.79 billion, up 26.4% year-over-year; non-GAAP net income of $858.4 million and diluted EPS of $17.77, up 24.5% and 25.8%, respectively.
- Q4 2025 revenue of $751.2 million, +20.8% YoY and +1.9% QoQ, with GAAP gross margin of 55.2% and non-GAAP gross margin of 55.5%.
- Q4 2025 GAAP net income of $170.1 million (EPS $3.46) and non-GAAP net income of $235.3 million (EPS $4.79).
- End-Q4 cash, cash equivalents and short-term investments of $1.256 billion and Q4 operating cash flow of $104.9 million, underscoring strong liquidity.
- Q1 2026 guidance: revenue of $770 million–$790 million; GAAP gross margin of 54.9%–55.5%; non-GAAP gross margin of 55.2%–55.8%.
- Revenue for Q4 2025 was $751.2 million, up 20.8% YoY, and full-year revenue was $2.79 billion, a 26.4% increase.
- GAAP net income for Q4 was $170.1 million ($3.46 diluted EPS) and FY net income was $615.9 million ($12.75 diluted EPS).
- The board approved an increase in the quarterly cash dividend from $1.56 to $2.00 per share, payable April 15, 2026, to shareholders of record March 31, 2026.
- Q1 2026 guidance: revenue $770 million–$790 million, GAAP gross margin 54.9%–55.5%, and operating expenses $207.1 million–$213.1 million.
- Achieved record Q3 revenue of $737.2 million, up 10.9% sequentially and 18.9% year-over-year, driven by growth across all end markets.
- Secured new design wins, including a Tier 1 ADAS solution in automotive and its first full battery management system for a robotics platform, underscoring its shift toward system-level silicon solutions.
- Raised Q4 2025 revenue guidance by ~1%, citing stronger-than-anticipated enterprise data and industrial market momentum carrying into early 2026.
- Expects enterprise data segment to grow 30-40% in 2026, with the bulk of ramps in H2, and maintains a mid-55% gross margin outlook.
- Record Q3 revenue of $737.2 M, up 10.9% QoQ and 18.9% YoY, driven by diversified end-market strength.
- Q4 2025 revenue guidance up ~1% sequentially, underpinned by momentum in enterprise data and industrial segments.
- Notable design wins include expanded ADAS solutions for automotive and first full battery management system for robotics, supporting transition to system-level offerings.
- Gross margins remain in the mid-55% range, expected to stay steady (±20–30 bps) absent extended backlog visibility.
- Enterprise data segment projected to grow 30–40% in 2026, with major ramps in H2 2026 from vertical power and module solutions.
- Record Q3 revenue of $737.2 million, up 10.9% sequentially and 18.9% year-over-year.
- CFO highlighted strong momentum in enterprise data and industrial markets as new customer layering drives growth into Q4 and early 2026.
- Secured key design wins: next-generation automotive ADAS solutions and first full battery management system for robotics, underscoring the shift to full-service silicon-based offerings.
- Management expects gross margins to remain in the mid-55% range, constrained by short-term order visibility.
- Monolithic Power Systems reported Q3 2025 revenue of $737.2 M (up 10.9% QoQ; 18.9% YoY) and GAAP net income of $178.3 M (+33.3% QoQ), or $3.71 EPS.
- Non-GAAP net income was $227.1 M, or $4.73 EPS, reflecting a 12.3% QoQ and 14.3% YoY increase.
- All end markets saw YoY growth, led by Storage & Computing (+29.6%) and Automotive (+36.1%).
- Cash, cash equivalents and short-term investments totaled $1.27 B, and operating cash flow was $239.3 M in the quarter.
- For Q4 2025, MPS forecasts revenue of $730 M–$750 M and non-GAAP gross margin of 55.2%–55.8%.
Fintool News
In-depth analysis and coverage of MONOLITHIC POWER SYSTEMS.

Quarterly earnings call transcripts for MONOLITHIC POWER SYSTEMS.
Ask Fintool AI Agent
Get instant answers from SEC filings, earnings calls & more