Earnings summaries and quarterly performance for SKYWORKS SOLUTIONS.
Executive leadership at SKYWORKS SOLUTIONS.
Philip Brace
Chief Executive Officer and President
Philip Carter
Senior Vice President and Chief Financial Officer
Reza Kasnavi
Executive Vice President, Chief Operations and Technology Officer
Robert Terry
Senior Vice President, General Counsel and Secretary
Todd Lepinski
Senior Vice President, Sales and Marketing
Board of directors at SKYWORKS SOLUTIONS.
Research analysts who have asked questions during SKYWORKS SOLUTIONS earnings calls.
Edward Snyder
Charter Equity Research
8 questions for SWKS
Christopher Rolland
Susquehanna Financial Group
7 questions for SWKS
Karl Ackerman
BNP Paribas
6 questions for SWKS
Harsh Kumar
Piper Sandler & Co.
5 questions for SWKS
Peter Peng
Evercore ISI
5 questions for SWKS
Timothy Arcuri
UBS
5 questions for SWKS
Jim Schneider
Goldman Sachs
4 questions for SWKS
Gary Mobley
Loop Capital
3 questions for SWKS
Krish Sankar
TD Cowen
3 questions for SWKS
Liam Pharr
Bank of America Securities
3 questions for SWKS
Craig Ellis
B. Riley Securities
2 questions for SWKS
Nick Doyle
Needham & Company
2 questions for SWKS
Nicolas Doyle
Needham & Company, LLC
2 questions for SWKS
Peter Pang
JPMorgan Chase & Co.
2 questions for SWKS
Vivek Arya
Bank of America Corporation
2 questions for SWKS
Chris Caso
Wolfe Research LLC
1 question for SWKS
Christopher Caso
Wolfe Research
1 question for SWKS
Joe Moore
Morgan Stanley
1 question for SWKS
Michael Mani
Bank of America
1 question for SWKS
Ruben Roy
Stifel Financial Corp.
1 question for SWKS
Sam Feldman
BNP Paribas
1 question for SWKS
Sreekrishnan Sankarnarayanan
Wolfe Research, LLC
1 question for SWKS
Srinivas Pajjuri
Raymond James & Associates, Inc.
1 question for SWKS
Thomas O’Malley
Barclays Capital
1 question for SWKS
Toshiya Hari
Goldman Sachs Group, Inc.
1 question for SWKS
Vijay Rakesh
Mizuho
1 question for SWKS
Recent press releases and 8-K filings for SWKS.
- Agreed to combine with Qorvo, targeting over $500 million of synergies, 50–55% gross margins and ~1× net leverage upon closing in early CY 2027; regulatory filings completed and shareholder vote scheduled.
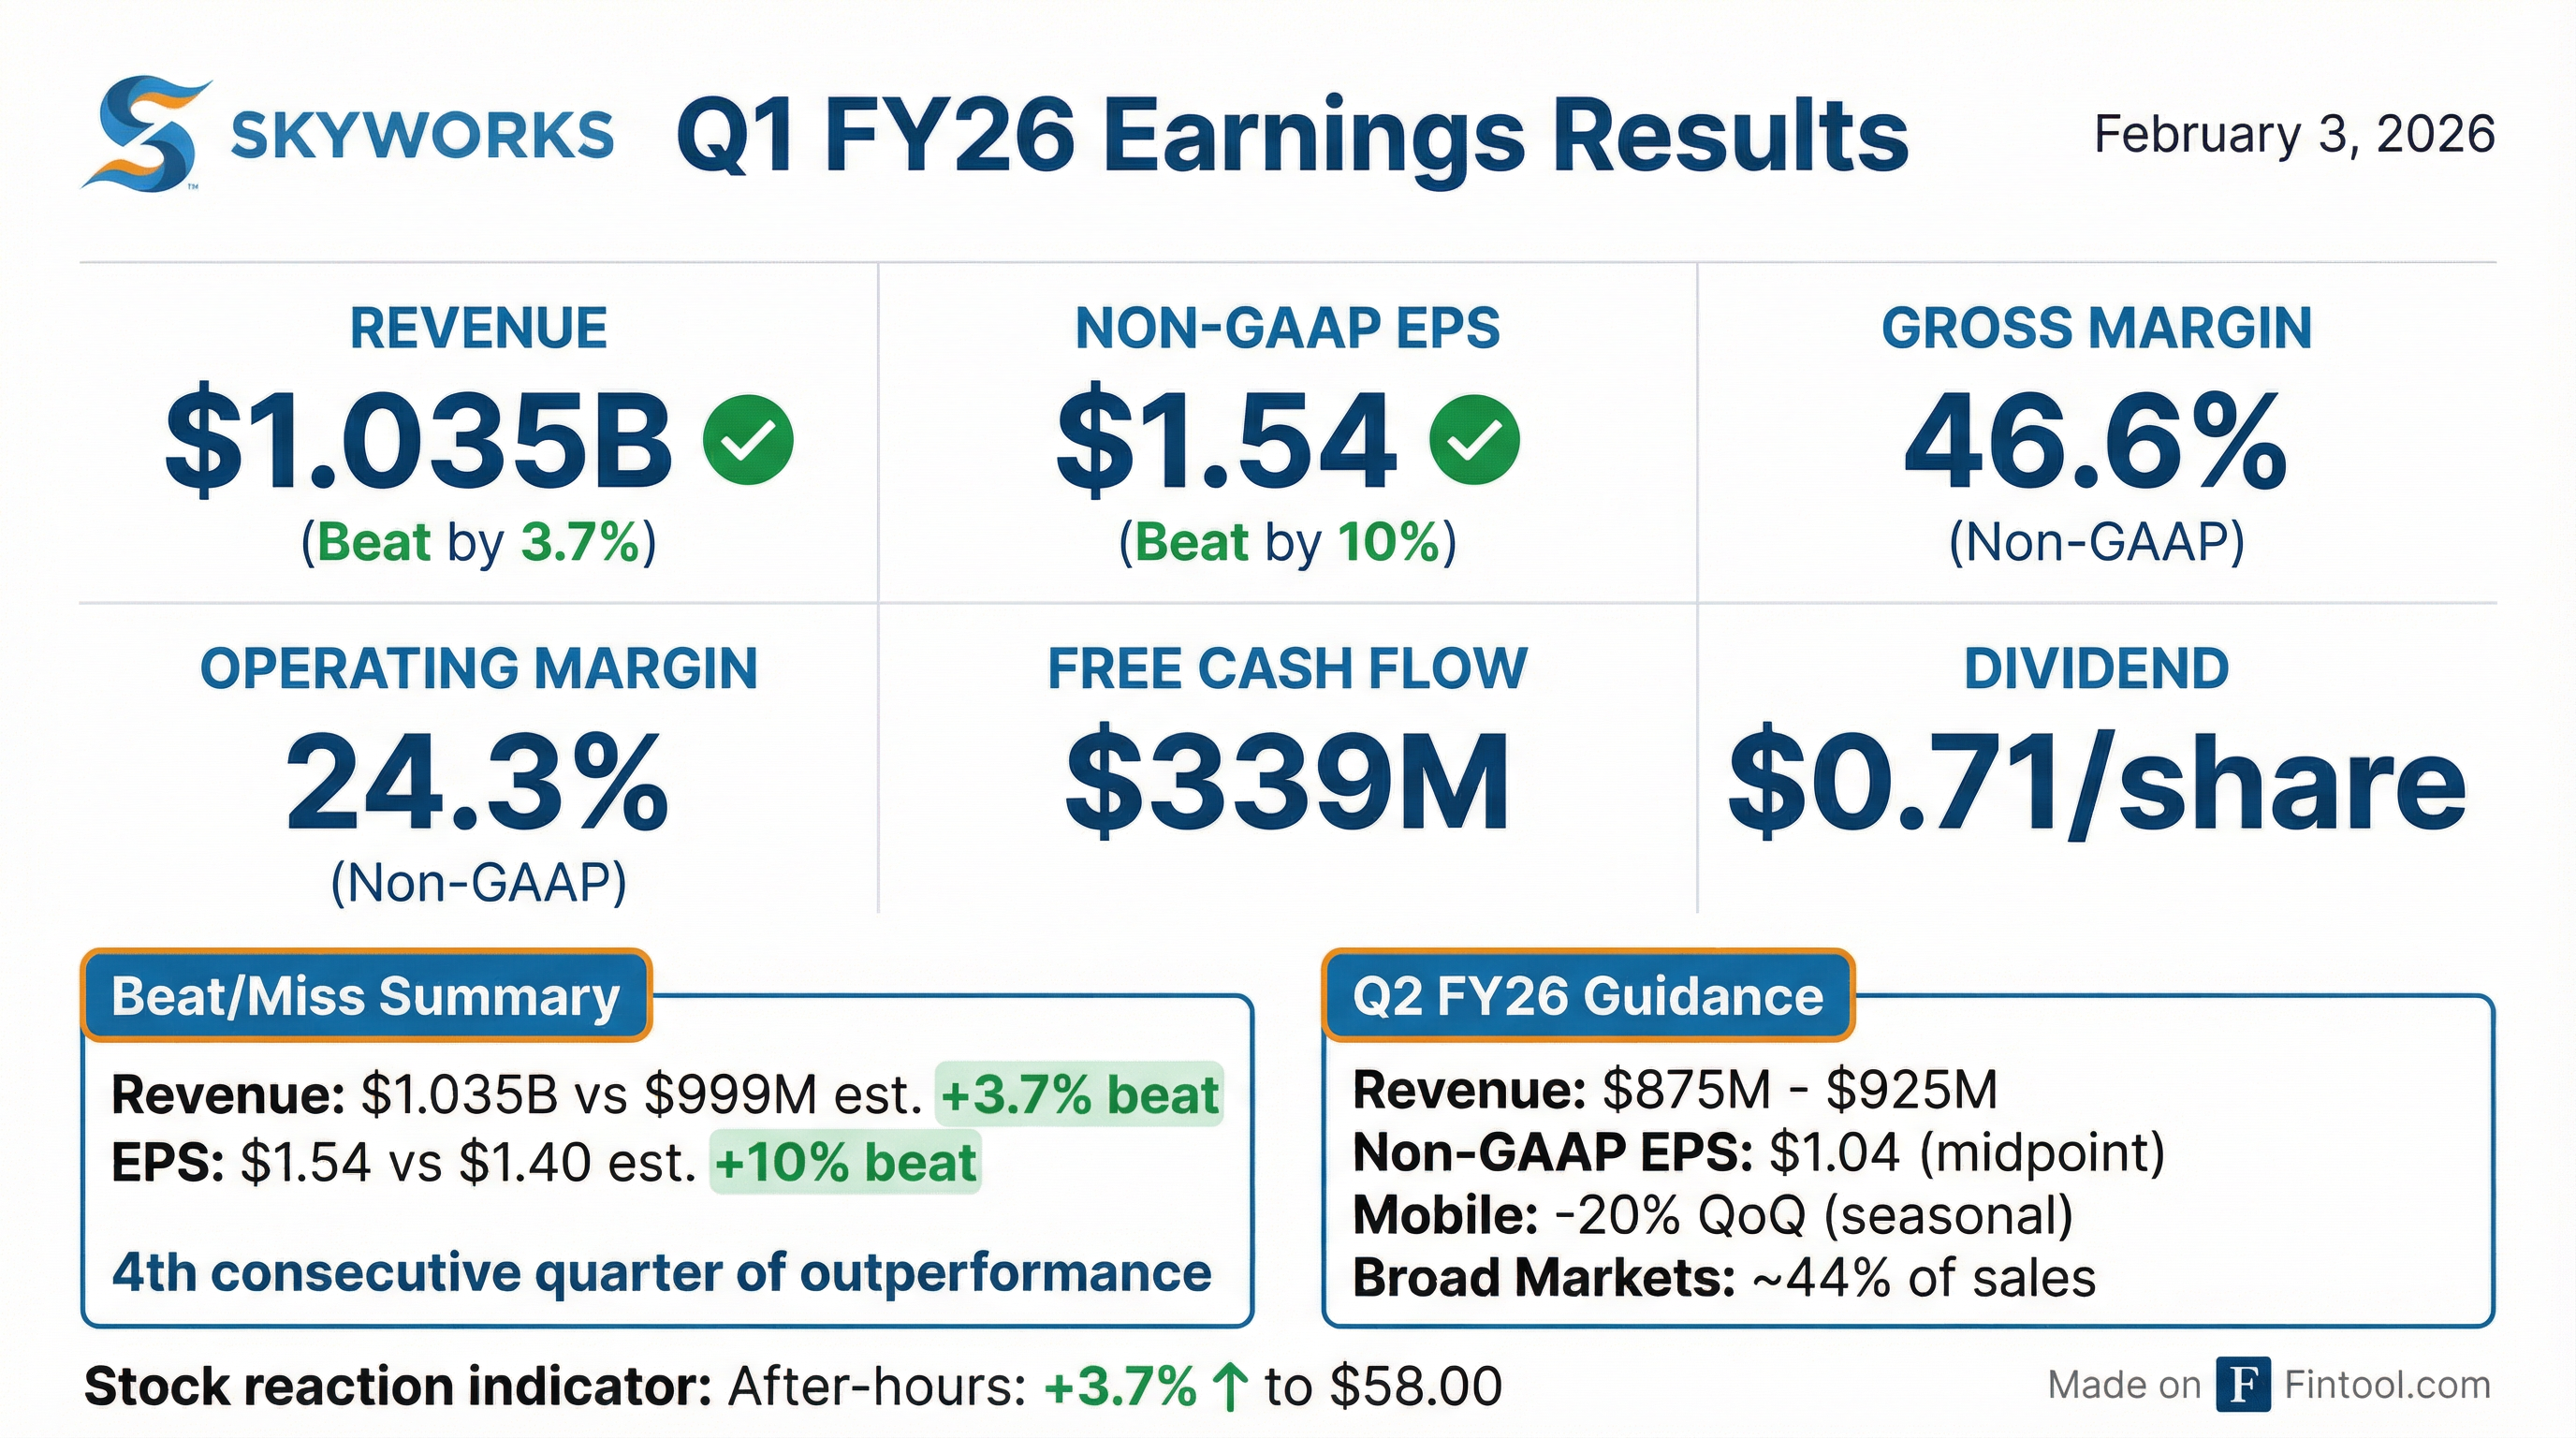
- Q1 FY 2026 revenue of $1.035 billion, non-GAAP EPS of $1.54, gross margin 46.6%, free cash flow $339 million, ending cash of $1.6 billion versus $1.0 billion in debt.
- Broad markets grew 11% year-over-year and 4% sequentially, driven by strength in edge IoT, data center/cloud infrastructure and automotive.
- Q2 FY 2026 guidance: revenue $875 million–$925 million, mobile down ~20% sequentially, broad markets flat (~44% of sales), gross margin 44.5%–45.5%, and EPS of $1.04 at midpoint.
- Announced strategic combination with Qorvo expected to deliver over $500 million of synergies, target 50–55% gross margins and net leverage of ~1× at close; transaction on track to close in early CY 2027 pending approvals.
- Q1 FY 2026 revenue of $1.035 billion, non-GAAP EPS of $1.54, gross margin 46.6% and free cash flow of $339 million (33% margin).
- Mobile represented 62% of sales and outperformed expectations; Broad Markets grew 4% sequentially and 11% year-over-year, led by edge IoT, data center and automotive.
- Q2 FY 2026 guidance: revenue $875–925 million, gross margin 44.5–45.5%, diluted EPS of $1.04 at midpoint; mobile down ~20% sequentially, Broad Markets flat sequentially (44% of sales).
- Skyworks delivered $1.035 billion in revenue, $1.54 diluted EPS, $339 million in free cash flow, and paid $106 million in dividends in Q1 FY2026.
- Broad markets revenue grew 11% year-over-year, driven by edge IoT, data center infrastructure, and automotive, while mobile remained 62% of total sales.
- The announced combination with Qorvo is on track to close in early calendar 2027, targeting over $500 million of synergies and 50-55% gross margins through cycles.
- For Q2 FY2026, Skyworks expects $875 million – $925 million in revenue (mobile down ~20% QoQ; broad markets flat) and $1.04 EPS at the midpoint.
- Revenue of $1.035 billion; GAAP diluted EPS of $0.53 and non-GAAP diluted EPS of $1.54 for Q1 FY26.
- Operating cash flow of $396 million and free cash flow of $339 million.
- Q2 FY26 guidance: revenue of $875 million–$925 million and non-GAAP diluted EPS of $1.04 at midpoint.
- Declared cash dividend of $0.71 per share, payable March 17, 2026; record date February 24, 2026.
- Projected to expand from $2.38 billion in 2026 to $3.06 billion by 2030 at a 6.5% CAGR
- Growth driven by deployment of advanced 5G/6G networks, connected and autonomous vehicles, satellite communications, and defense electronics spending
- Asia-Pacific identified as a leading regional market amid surging wireless communications demand
- Global trade tensions and tariffs are prompting increased investment in domestic GaAs manufacturing capabilities
- Investors have rotated out of technology into value sectors, yet semiconductors have rallied ~50% over six months.
- Skyworks Solutions is forecast to see sales decline another 10.7% over the next 12 months, following annual drops of 7.5% over the past two years.
- The company’s operating margin has contracted by 19.3 percentage points over the past five years, reflecting shrinking profitability.
- Analysts urge selectivity, praising peers like Seagate while flagging Skyworks for falling sales and shrinking margins.
- Skyworks CEO Philip Brace detailed the strategic rationale for the proposed Skyworks-Qorvo combination, aiming to create a $7.7 billion company comprising a $5 billion mobile business and a $2.6 billion non-mobile segment including defense and GaN capabilities.
- Major handset customers have expressed support for the merger, viewing Skyworks and Qorvo technologies as largely complementary, with minimal overlap and the potential to redirect duplicate R&D spend toward joint innovations.
- The merger model assumes no revenue synergies or multiple expansion; management is focused on cost synergies, integration planning, and a methodical international regulatory approach—China approval is considered likely but not guaranteed and not a deal breaker.
- Skyworks’ standalone Broad Markets business shows strong momentum, notably with Wi-Fi 7 adoption entering its “third inning” against supply constraints, automotive connectivity growth, and infrastructure timing/power demand; defense becomes a leading growth area when combined with Qorvo’s portfolio.
- Self-help measures ahead of closing include consolidation of the Newbury Park site, reorganization of product marketing into business units, and leadership changes affecting ~25% of staff to improve operational efficiency.
- CEO Phil Brace detailed the strategic rationale for combining Skyworks and Qorvo into a $7.7 billion revenue platform—split into a $5 billion mobile business and a $2.6 billion non-mobile business featuring GaN technology for defense and aerospace—with a strong capital structure to support future growth.
- Major customers have expressed support for the merger, citing complementary technologies (e.g., envelope tracking, high-frequency components) and the opportunity to reallocate duplicate R&D spend, while Skyworks has not assumed any revenue synergies in its financial model.
- Management plans a deliberate, step-by-step international regulatory process, with China clearance viewed as essential to closing the transaction; U.S. operations alone would not justify closing without full approval.
- Skyworks is executing standalone self-help measures—such as consolidating a manufacturing site into Newbury Park and streamlining product-marketing and business unit structures—to drive cost efficiencies and target a 46.5% gross margin in fiscal Q4 ahead of deal close.
- Skyworks CEO Phil Brace outlined the strategic rationale for the Qorvo merger, creating a combined platform with $7.7 billion in annual revenue (split into $5 billion mobile and $2.6 billion non-mobile businesses) and adding GaN technology capabilities.
- No revenue synergies are baked into the financial model; value creation relies on cost synergies, focused R&D, and a favorable capital structure to support future growth.
- Major handset customers have strong support for the deal, citing minimal product overlap, complementary technologies (e.g., envelope tracking, antenna tuners), and potential to reduce duplicate R&D spend.
- The international regulatory path, especially in China, will be approached methodically, and full jurisdictional approvals are required for the deal to close—not planned to proceed without China.
- Skyworks highlighted Broad Markets momentum in Wi-Fi 7, automotive connectivity, defense electronics (via Qorvo’s GaN products), and infrastructure timing/power products, with Wi-Fi 7 adoption in its early innings.
- Skyworks delivered Q4 FY2025 revenue of $1.1 billion and diluted EPS of $1.76; mobile constituted 65% of sales (up 21% QoQ) and broad markets grew 3% QoQ; gross margin was 46.5%, net income was $264 million.
- For fiscal 2025, the company generated $1.3 billion of operating cash flow and $1.1 billion of free cash flow (27% margin) on $195 million of capex; ended Q4 with $1.4 billion in cash/investments and $1.0 billion in debt.
- Q1 FY2026 guidance: revenue $975 million–$1.025 billion, diluted EPS of $1.40 at midpoint; mobile expected to decline low-to-mid teens sequentially, broad markets to rise slightly, with gross margin of 46–47% and OpEx of $230–$240 million.
- Appointed Philip Carter as CFO and announced a transformative agreement to combine with Corvo, aiming to add scale and diversification to its wireless portfolio.
Quarterly earnings call transcripts for SKYWORKS SOLUTIONS.
Ask Fintool AI Agent
Get instant answers from SEC filings, earnings calls & more