Earnings summaries and quarterly performance for Victory Capital Holdings.
Executive leadership at Victory Capital Holdings.
David C. Brown
Chief Executive Officer
Mannik S. Dhillon
President, Investment Franchises and Solutions; Head of Product and Strategy
Michael D. Policarpo
President, Chief Financial Officer and Chief Administrative Officer
Nina Gupta
Chief Legal Officer and Head of Human Resource Administration
Board of directors at Victory Capital Holdings.
Alan H. Rappaport
Director
Céline Boyer-Chammard
Director
Dominique Carrel-Billiard
Director
Karin Hirtler-Garvey
Director
Lawrence Davanzo
Director
Mary Jackson
Director
Richard M. DeMartini
Lead Independent Director
Robert V. Delaney, Jr.
Director
Research analysts who have asked questions during Victory Capital Holdings earnings calls.
Michael Cho
JPMorgan Chase & Co.
6 questions for VCTR
Alexander Blostein
Goldman Sachs
5 questions for VCTR
Kenneth Lee
RBC Capital Markets
5 questions for VCTR
Michael Cyprys
Morgan Stanley
4 questions for VCTR
Ben Budish
Barclays PLC
3 questions for VCTR
Etienne Ricard
BMO Capital Markets
3 questions for VCTR
Craig Siegenthaler
Bank of America
2 questions for VCTR
Adam Beatty
UBS
1 question for VCTR
Benjamin Budish
Barclays PLC
1 question for VCTR
Ben Rubin
UBS
1 question for VCTR
Brennan Hawken
UBS Group AG
1 question for VCTR
Matthew Howlett
B. Riley Securities
1 question for VCTR
Randy Binner
B. Riley Securities
1 question for VCTR
Recent press releases and 8-K filings for VCTR.
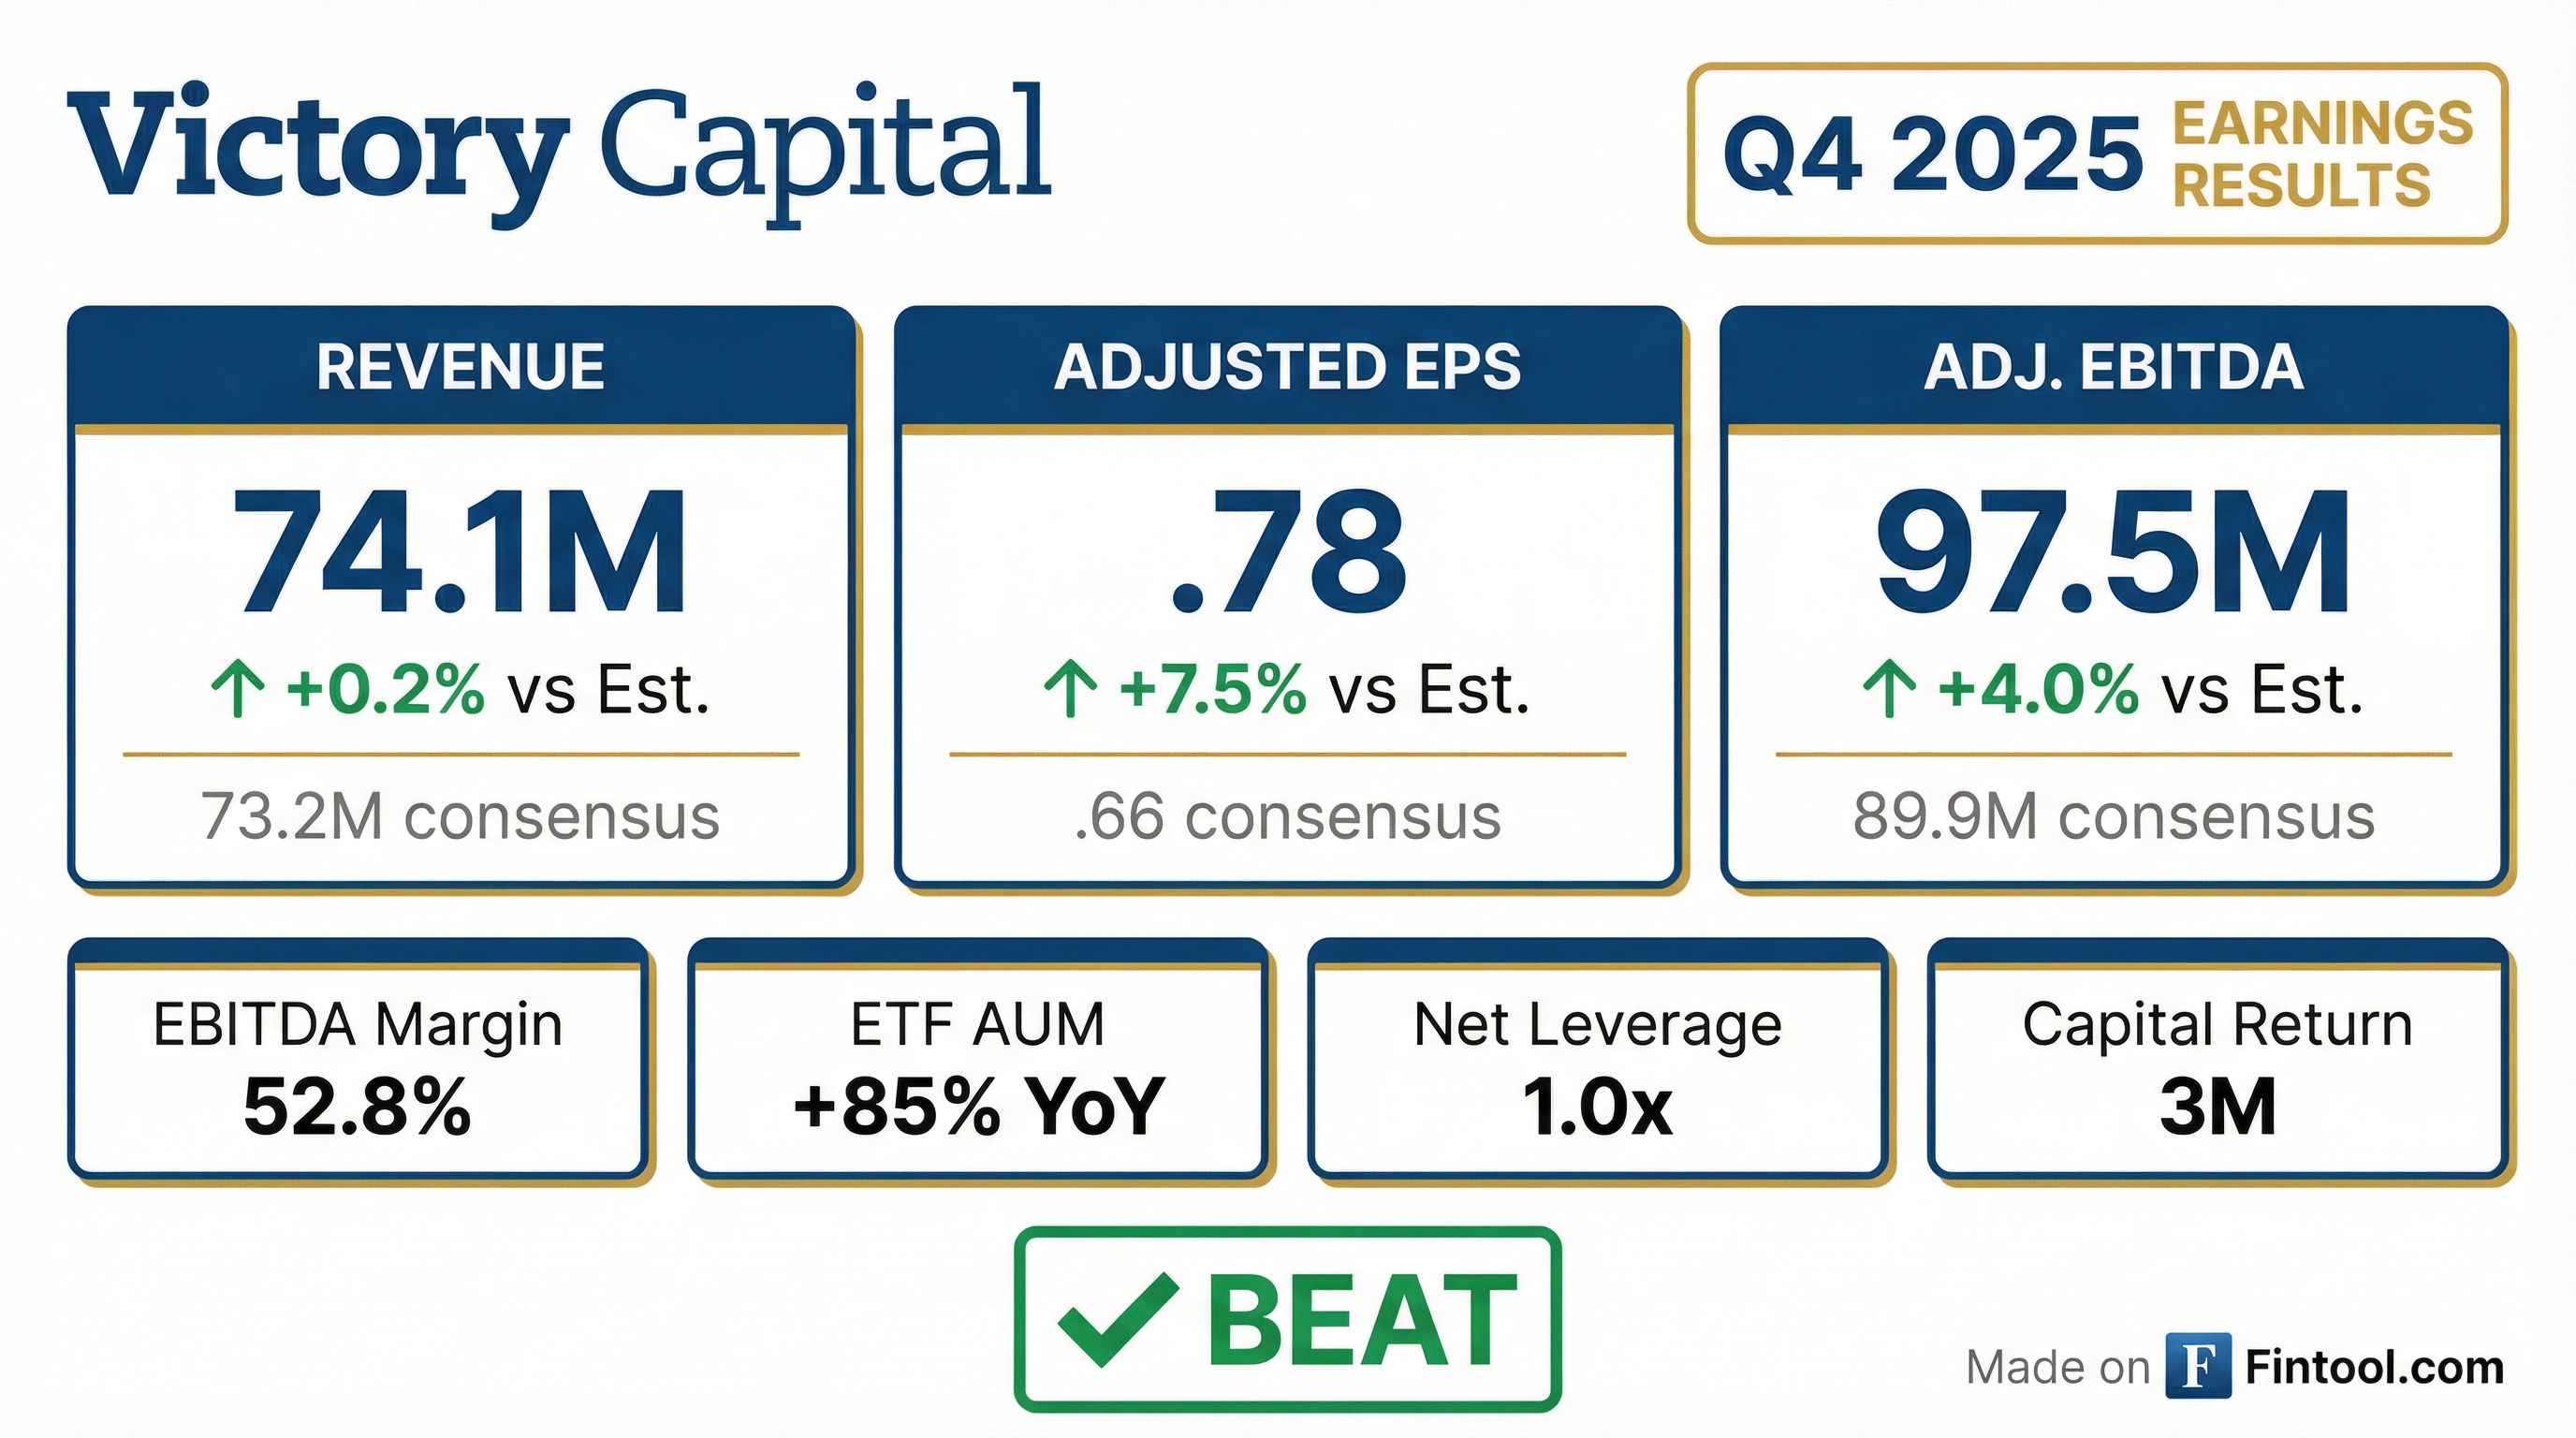
- Victory Capital reported Q4 2025 revenue of $374.1MM, Adjusted EBITDA of $197.5MM, and Adjusted earnings per diluted share with tax benefit of $1.78.
- For the full year 2025, the company achieved record highs in Gross Sales, AUM, Revenue, EBITDA, Earnings Per Share, and Cash Flow from Operations, with full-year revenue up 46% from 2024.
- Total client assets reached $317Bn in Q4 2025, and ETF AUM increased 85% year-over-year to $19Bn.
- The company returned $93MM to shareholders in Q4 2025, contributing to a full-year capital return of $366MM, and declared a quarterly cash dividend of $0.49 per share.
- Victory Capital Holdings, Inc. reported record financial results for the quarter and year ended December 31, 2025, achieving record quarterly and annual levels of gross flows, revenue, and earnings.
- Assets Under Management (AUM) reached $313.8 billion at December 31, 2025, significantly increasing from $171.9 billion at December 31, 2024, following the substantially complete integration of Pioneer Investments which achieved $97 million in net expense synergies by year-end 2025.
- The company returned a record $366 million in capital to shareholders during 2025, including $93 million in Q4 2025 through share repurchases and dividends, and the Board authorized a regular quarterly cash dividend of $0.49 per share.
- Victory Capital Holdings reported record financial results for the fourth quarter and full year ended December 31, 2025.
- For Q4 2025, revenue was $374.1 million and GAAP net income per diluted share was $1.32.
- For the full year 2025, revenue increased to $1.3 billion and adjusted net income with tax benefit per diluted share was $6.38.
- Total client assets (AUM) reached $316.6 billion as of December 31, 2025.
- The company returned a record $366 million to shareholders during 2025, and the Board authorized a regular quarterly cash dividend of $0.49 per share.
- Victory Capital Holdings (VCTR) reported a landmark year in 2025, achieving $1.3 billion in annual revenue for the first time , and reaching record adjusted EBITDA of $197.5 million and record adjusted EPS of $1.78 in Q4 2025. The company's Adjusted EBITDA margin increased to 52.8% in Q4 2025.
- The company ended 2025 with $317 billion in total client assets and record-high AUM in Q4 2025. While long-term gross sales reached an all-time high of $17.1 billion in Q4 2025 , long-term net flows were -$2.1 billion due to one-time items. However, key growth areas such as Pioneer's strategies, the international channel, and VictoryShares ETFs experienced positive net flows.
- VCTR is nearing completion of the Amundi/Pioneer Investments integration, having realized 88% of the targeted $110 million in net expense synergies on a run-rate basis by year-end 2025, with full realization expected in 2026. The acquisition has significantly globalized the business, with 17% of AUM from clients outside the U.S., and the international channel has been net flow positive since the acquisition's closing.
- In Q4 2025, the company repurchased 814,000 shares for $51.6 million, with over $300 million remaining under its current $500 million authorization. With a net leverage ratio of 1.0x and substantial liquidity, VCTR is actively pursuing inorganic growth opportunities, maintaining a historical cadence of approximately one acquisition every 1.5 years.
- Victory Capital Holdings reported record financial performance for 2025, with annual revenue exceeding $1 billion and Q4 2025 adjusted EBITDA reaching $197.5 million and adjusted diluted EPS of $1.78.
- The company achieved a record-high AUM of $317 billion by year-end 2025. While Q4 2025 saw long-term net outflows of -$2.1 billion due to one-time items, the international distribution channel and VictoryShares ETF platform experienced positive net flows.
- The integration of Amundi's Pioneer Investments is nearly complete, with 88% of the $110 million net expense synergy target realized on a run-rate basis, expected to be fully achieved in 2026.
- Victory Capital demonstrated strong capital allocation, ending Q4 2025 with a net leverage ratio of 1.0x and returning $366 million to shareholders in 2025, including $51.6 million in share repurchases during Q4 2025.
- Victory Capital Holdings achieved record financial performance in Q4 and full-year 2025, with annual revenue surpassing $1 billion for the first time, reaching $1.3 billion for the full year. Q4 2025 saw revenue of $374.1 million, record adjusted EBITDA of $197.5 million with a 52.8% margin, and record adjusted EPS of $1.78.
- The company ended 2025 with record-high AUM of $317 billion and achieved its highest-ever quarterly long-term gross sales of $17.1 billion. However, Q4 2025 experienced long-term net outflows of -$2.1 billion due to one-time client reallocations and a large platform redemption.
- Integration of Pioneer Investments is nearing completion, with $97 million of the targeted $110 million in net expense synergies achieved on a run-rate basis by year-end 2025, ahead of schedule for full realization in 2026. The acquisition has globalized the business, with 17% of AUM from outside the U.S..
- Victory Capital demonstrated strong capital allocation, repurchasing 814,000 shares for $51.6 million in Q4 2025 and returning $366 million to shareholders for the full year. The company maintains a strong balance sheet with a net leverage ratio of 1.0 times and $164 million in cash , positioning it for future inorganic growth.
- Victory Capital Holdings, Inc. reported Total Client Assets of $316.6 billion as of December 31, 2025.
- Total Assets Under Management (AUM) for the company stood at $313.8 billion as of December 31, 2025.
- For the fourth quarter of 2025, the company experienced long-term AUM net outflows of $2,089 million.
- Victory Capital is scheduled to report its fourth-quarter 2025 financial results on February 4, 2026, and will host a conference call to discuss these results on February 5, 2026.
- Victory Capital Holdings reported Total Client Assets of $316.6 billion and Total Assets Under Management (AUM) of $313.8 billion as of December 31, 2025.
- For the fourth quarter of 2025, the company experienced long-term AUM net outflows of $2.1 billion.
- Victory Capital is scheduled to report its fourth-quarter 2025 financial results on February 4, 2026, and will host a conference call on February 5, 2026.
- Victory Capital Holdings, Inc. reported Total Client Assets of $317.7 billion and Total Assets Under Management (AUM) of $314.8 billion as of November 30, 2025.
- These figures represent an increase from Total Client Assets of $315.8 billion and Total AUM of $313.0 billion reported as of October 31, 2025.
- For the month of November 2025, the company's average Total Client Assets were $315.2 billion, and average Total AUM was $312.4 billion.
- Victory Capital Holdings reported Total Client Assets of $317.7 billion as of November 30, 2025.
- Total Assets Under Management (AUM) reached $314.8 billion as of the same date.
- From October 31, 2025, to November 30, 2025, Total Client Assets increased from $315.8 billion to $317.7 billion.
Quarterly earnings call transcripts for Victory Capital Holdings.
Ask Fintool AI Agent
Get instant answers from SEC filings, earnings calls & more