Earnings summaries and quarterly performance for ARROWHEAD PHARMACEUTICALS.
Executive leadership at ARROWHEAD PHARMACEUTICALS.
Board of directors at ARROWHEAD PHARMACEUTICALS.
Research analysts who have asked questions during ARROWHEAD PHARMACEUTICALS earnings calls.
Edward Tenthoff
Piper Sandler Companies
7 questions for ARWR
Andrea Newkirk
Goldman Sachs
6 questions for ARWR
Jason Gerberry
Bank of America Merrill Lynch
6 questions for ARWR
Luca Issi
RBC Capital Markets
6 questions for ARWR
Prakhar Agrawal
Cantor Fitzgerald
6 questions for ARWR
Joseph Thome
TD Cowen
5 questions for ARWR
Patrick Trucchio
H.C. Wainwright & Co.
5 questions for ARWR
Madison El-Saadi
B. Riley
4 questions for ARWR
Mani Foroohar
Leerink Partners
4 questions for ARWR
Maury Raycroft
Jefferies
4 questions for ARWR
Mike Ulz
Morgan Stanley
4 questions for ARWR
Brendan Smith
Stifel, Nicolaus & Company, Incorporated
3 questions for ARWR
Maurice Raycroft
Jefferies Financial Group
3 questions for ARWR
Mayank Mamtani
B. Riley Securities
3 questions for ARWR
Cassie Chen
RBC Capital Markets
2 questions for ARWR
Emmanuel Walter
Leerink Partners
2 questions for ARWR
Gina Ahn
Bank of America
2 questions for ARWR
Michael Ulz
Morgan Stanley
2 questions for ARWR
Patrick Trujillo
H.C. Wainwright
2 questions for ARWR
William Pickering
Sanford C. Bernstein & Co.
2 questions for ARWR
Andrea Tan
Goldman Sachs
1 question for ARWR
Brian Swanson
Leerink Partners
1 question for ARWR
David Lebowitz
Citigroup Inc.
1 question for ARWR
Edward Tenthof
Piper Sandler
1 question for ARWR
Eliana Merle
UBS
1 question for ARWR
Eliana Merrill
UBS
1 question for ARWR
Ellie Merle
UBS Group AG
1 question for ARWR
Farzin Haque
Jefferies
1 question for ARWR
Jasmine Fels
UBS
1 question for ARWR
Madison Elsaadi
B. Riley Securities
1 question for ARWR
Mani Furuhar
Leerink Partners
1 question for ARWR
Mary Kate Davis
Bank of America
1 question for ARWR
Recent press releases and 8-K filings for ARWR.
- Arrowhead Pharmaceuticals received FDA approval for Redemplo on November 18, 2025, for familial chylomicronemia syndrome (FCS), and subsequently launched it independently in the U.S., with over 100 prescriptions received to date. Approvals were also secured in Canada and China in January 2026.
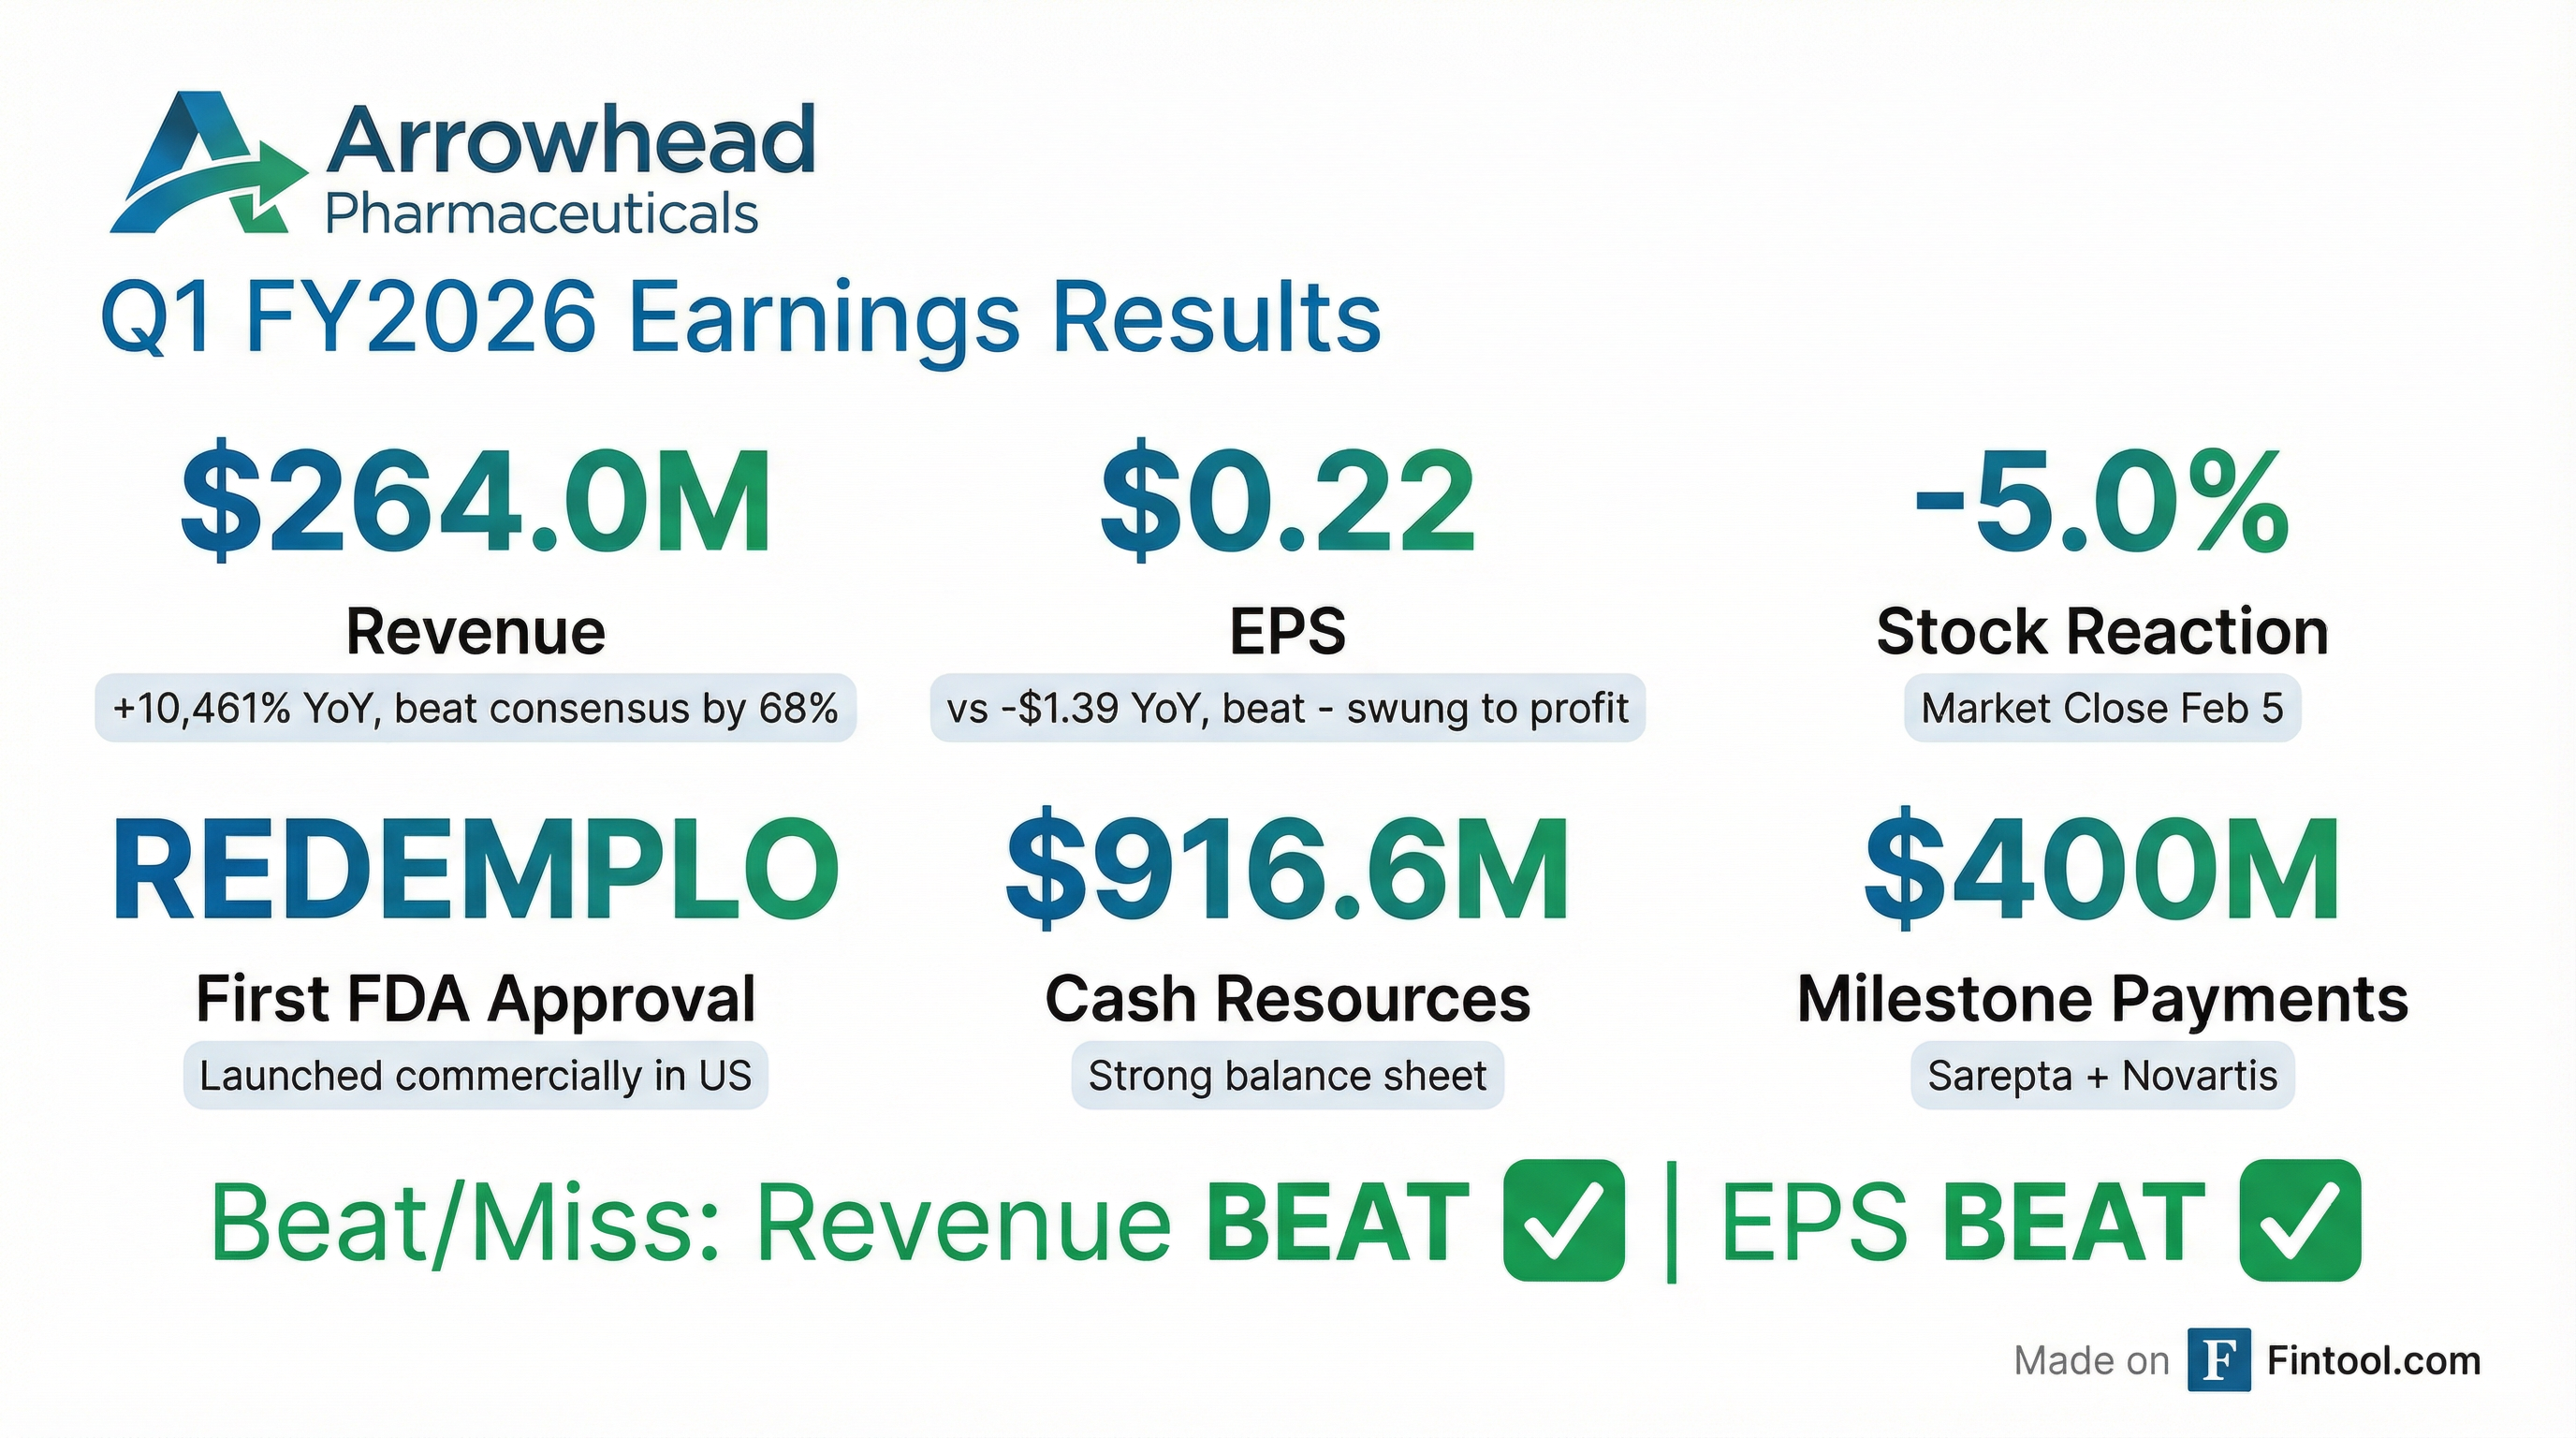
- For the quarter ended December 31, 2025 (Q1 2026), the company reported net income of $30.8 million and revenue of $264 million, primarily driven by licensing and collaboration agreements with Sarepta and Novartis.
- The company significantly strengthened its balance sheet with $1.33 billion in gross proceeds from transactions, including a $200 million upfront payment from Novartis, a $200 million milestone from Sarepta, and $930 million from concurrent public offerings of convertible senior notes and common stock.
- Key pipeline advancements include the initiation of a Phase 1/2 clinical trial for ARO-MAPT targeting Alzheimer's Disease, with interim healthy volunteer data expected in 2026, and Plozasiran receiving Breakthrough Therapy Designation for severe hypertriglyceridemia (SHTG), with Phase III data expected in Q3 2026.
- Arrowhead Pharmaceuticals reported net income of $30.8 million and revenue of $264 million for its fiscal Q1 2026, ended December 31, 2025, with $917 million in cash and investments.
- The company received FDA approval for Redemplo on November 18, 2025, for familial chylomicronemia syndrome (FCS) and has since recorded its first commercial sales, with over 100 prescriptions received.
- Interim Phase I/II data for ARO-INHBE in obesity showed approximately twofold better weight loss and threefold reduction in total, visceral, and liver fat when combined with Tirzepatide in obese patients with Type II diabetes.
- The company expects top-line data in Q3 2026 from the Phase III SHASTA-III and SHASTA-IV studies of Plozasiran for severe hypertriglyceridemia (SHTG), which is considered a potential $3-$4 billion commercial opportunity.
- Other pipeline updates include the initiation of a Phase I/II study for ARO-DimerPA for mixed hyperlipidemia, with interim data expected in the second half of 2026, and early data for ARO-MAPT in tauopathies also anticipated in 2026.
- Arrowhead Pharmaceuticals reported a net income of $30.8 million and revenue of $264 million for the quarter ended December 31, 2025, primarily driven by licensing collaborations.
- The company launched REDEMPLO in the U.S. following FDA approval on November 18, 2025, for familial chylomicronemia syndrome (FCS), with over 100 prescriptions received to date.
- Arrowhead significantly strengthened its financial position with $1.33 billion in gross proceeds from recent transactions, including a $200 million upfront payment from Novartis, a $200 million milestone from Sarepta, and $930 million from concurrent public offerings of convertible senior notes and common stock.
- Upcoming pipeline milestones include Q3 2026 top-line data for the phase III SHASTA-3 and SHASTA-4 studies of plozasiran in SHTG, and interim clinical data for ARO-MAPT in healthy volunteers in 2026.
- Arrowhead Pharmaceuticals reported strong fiscal Q1 2026 financial results for the period ended December 31, 2025, with revenue of $264,033 thousand and net income of $30,811 thousand.
- The company achieved a major milestone with U.S. FDA approval for REDEMPLO® (plozasiran) on November 18, 2025, marking its first FDA-approved medicine, and subsequently launched it independently in the U.S., receiving over 100 prescriptions to date. REDEMPLO also secured regulatory approvals in China and Canada.
- Arrowhead significantly strengthened its financial position and pipeline through public offerings totaling $930,000,000 and strategic partnerships, including a $200 million milestone payment from Sarepta Therapeutics and a $200 million upfront payment from Novartis for a global licensing and collaboration agreement.
- The R&D pipeline advanced with the initiation of new Phase 1/2a clinical trials for ARO-DIMER-PA and ARO-MAPT, and positive interim clinical data for obesity candidates ARO-INHBE and ARO-ALK7, with plozasiran also receiving FDA Breakthrough Therapy designation for severe hypertriglyceridemia.
- Arrowhead Pharmaceuticals reported fiscal 2026 first-quarter revenue of $264.033 million and net income attributable to Arrowhead Pharmaceuticals, Inc. of $30.811 million, or $0.22 diluted net income per share, for the quarter ended December 31, 2025.
- The company achieved a major milestone with the U.S. FDA approval and launch of REDEMPLO® (plozasiran) on November 18, 2025, for familial chylomicronemia syndrome, marking its transition to a commercial-stage company with over 100 initial prescriptions.
- Arrowhead significantly improved its financial position by closing public offerings with gross proceeds totaling $930 million and receiving a $200 million milestone payment from Sarepta Therapeutics.
- A global licensing and collaboration agreement with Novartis for ARO-SNCA was finalized, including a $200 million upfront payment and potential milestones up to $2 billion.
- The company advanced its pipeline by initiating Phase 1/2a clinical trials for ARO-DIMER-PA and ARO-MAPT, and reported encouraging early results from its obesity programs, ARO-INHBE and ARO-ALK7.
- Arrowhead Pharmaceuticals, Inc. has issued $700,000,000 aggregate principal amount of 0.00% Convertible Senior Notes due 2032.
- The Notes, issued on January 12, 2026, will mature on January 15, 2032, and do not bear regular interest.
- The Company has the option to redeem the Notes on or after January 16, 2029, provided certain stock price conditions are met.
- Noteholders can require the Company to repurchase their Notes upon the occurrence of a "Fundamental Change", which includes specific corporate events or de-listing.
- Arrowhead Pharmaceuticals reported a market capitalization of approximately $9 billion and significant financial resources, including $920 million in cash and investments as of its last filing, supplemented by $400 million from Sarepta and Novartis, and $930 million from recent offerings.
- The company commercially launched Rudemplo (formerly Plozasiran) in late November 2025 in the US, Canada, and China for familial chylomicronemia syndrome (FCS), with phase 3 data for the broader severe hypertriglyceridemia (SHTG) market expected in Q3 2026 and a launch in 2027.
- Arrowhead is progressing a diverse pipeline, including Zodasiran for HoFH (expected launch 2028), ARO-Dimer-PA for mixed hyperlipidemia with initial clinical data anticipated by the end of Q3 2026, and obesity candidates ARO-INHBE and ARO-ALK7 with additional data throughout 2026.
- The first wholly owned CNS candidate, ARO-MAPT, targeting Alzheimer's and tauopathies, is in a Phase 1/2 study, with initial readouts expected by the end of Q3 2026, which could validate the broader CNS platform.
- Arrowhead Pharmaceuticals launched Rudemplo (formerly Plozasiran) in November 2025 in the US, Canada, and China for familial chylomicronemia syndrome (FCS). Phase 3 studies for its expansion into the severe hypertriglyceridemia (SHTG) market are expected to read out in Q3 2026, with a launch planned for 2027.
- The company maintains a strong financial position with approximately $920 million in cash and investments, augmented by $200 million from Sarepta, $200 million from Novartis, and $930 million from recent offerings.
- Promising early data for obesity candidates ARO-INHBE and ARO-ALK7 showed doubled weight loss in obese diabetic patients when ARO-INHBE was combined with tirzepatide. The company plans to initiate Phase 2B studies and intends to keep these programs wholly owned.
- Upcoming clinical milestones include initial readouts for the CNS candidate ARO-MAPT by the end of Q3 2026 and the first clinical readout for ARO-Dimer-PA in H2 2026.
- Arrowhead Pharmaceuticals (ARWR) reported a market capitalization of approximately $9 billion with 136 million shares outstanding as of Friday, January 9, 2026. The company has substantial financial resources, including ~$920 million in cash and investments from its last filing, an additional $200 million from Sarepta (invoiced), $200 million from Novartis (received), and $930 million from recent offerings, with another $50 million expected from Sarepta in February 2026.
- The company's first RNAi-based medicine, Rudemplo (formerly Plozasiran), was launched in the US, Canada, and China towards the end of November 2025 for familial chylomicronemia syndrome (FCS). Rudemplo is priced at $60,000 for FCS patients and is expected to be priced similarly for severe hypertriglyceridemia (SHTG), a market estimated at 3 to 3.5 million people in the US.
- Key upcoming milestones in 2026 include Phase 3 readout for Rudemplo in SHTG in Q3 2026 with an SNDA filing in Q4 2026. Initial clinical data for ARO-Dimer-PA, a novel dual-targeting therapy for mixed hyperlipidemia, is expected towards the end of Q3 2026, following dosing initiation in January 2026.
- Early data from obesity candidates ARO-INHBE and ARO-ALK7 show promising results, with ARO-INHBE demonstrating a 15.6% reduction in visceral fat at week 24 and doubling weight loss when combined with tirzepatide in obese diabetic patients.
- Initial readouts for ARO-MAPT, the first wholly-owned CNS candidate for Alzheimer's and tauopathies, are also anticipated towards the end of Q3 2026.
- Arrowhead Pharmaceuticals priced upsized offerings on January 7, 2026, including $625,000,000 aggregate principal amount of 0.00% convertible senior notes due 2032.
- The company also priced an equity offering of 3,100,776 shares of common stock at $64.50 per share and pre-funded warrants for up to 1,550,387 shares at $64.499 per warrant.
- Underwriters fully exercised their option to purchase an additional 456,116 shares of common stock on January 8, 2026, with the equity offering expected to generate approximately $216.6 million in net proceeds.
- The convertible notes have an initial conversion price of approximately $87.07 per share, representing a 35.0% premium over the common stock offering price.
Fintool News
In-depth analysis and coverage of ARROWHEAD PHARMACEUTICALS.

Quarterly earnings call transcripts for ARROWHEAD PHARMACEUTICALS.
Ask Fintool AI Agent
Get instant answers from SEC filings, earnings calls & more