Earnings summaries and quarterly performance for HUBBELL.
Executive leadership at HUBBELL.
Gerben Bakker
Chairman, President and Chief Executive Officer
Gregory Gumbs
President, Utility Solutions Segment
Joseph Capozzoli
Senior Vice President and Chief Financial Officer (effective January 1, 2026)
Katherine Lane
Senior Vice President, General Counsel and Secretary
Mark Mikes
President, Electrical Solutions Segment
William Sperry
Executive Vice President, Chief Financial Officer
Board of directors at HUBBELL.
Anthony Guzzi
Lead Independent Director
Bonnie Lind
Director
Carlos Cardoso
Director
Debra Dial
Director
Edward Baine
Director
Garrick Rochow
Director
Jennifer Pollino
Director
John Malloy
Director
Neal Keating
Director
Rhett Hernandez
Director
Research analysts who have asked questions during HUBBELL earnings calls.
Christopher Snyder
Morgan Stanley
10 questions for HUBB
Julian Mitchell
Barclays Investment Bank
10 questions for HUBB
Jeffrey Sprague
Vertical Research Partners
9 questions for HUBB
Nigel Coe
Wolfe Research, LLC
9 questions for HUBB
Brett Linzey
Mizuho Securities
6 questions for HUBB
Christopher Glynn
Oppenheimer & Co. Inc.
6 questions for HUBB
Tommy Moll
Stephens Inc.
6 questions for HUBB
Chad Dillard
AllianceBernstein
5 questions for HUBB
Joseph O'Dea
Wells Fargo & Company
5 questions for HUBB
C. Stephen Tusa
JPMorgan Chase & Co.
4 questions for HUBB
Joe O'Dea
Wells Fargo
3 questions for HUBB
Scott Graham
Seaport Research Partners
3 questions for HUBB
Steve Tusa
JPMorgan Chase & Co.
3 questions for HUBB
Thomas Moll
Stephens Inc.
3 questions for HUBB
Alexander Virgo
Bank of America Merrill Lynch
2 questions for HUBB
Nicole DeBlase
BofA Securities
2 questions for HUBB
Stephen Tusa
J.P. Morgan
2 questions for HUBB
John O'Dea
Wells Fargo & Company
1 question for HUBB
Joseph O'Dea
Wells Fargo
1 question for HUBB
Patrick Baumann
JPMorgan Chase & Co.
1 question for HUBB
Peter Costa
Mizuho Financial Group
1 question for HUBB
Recent press releases and 8-K filings for HUBB.
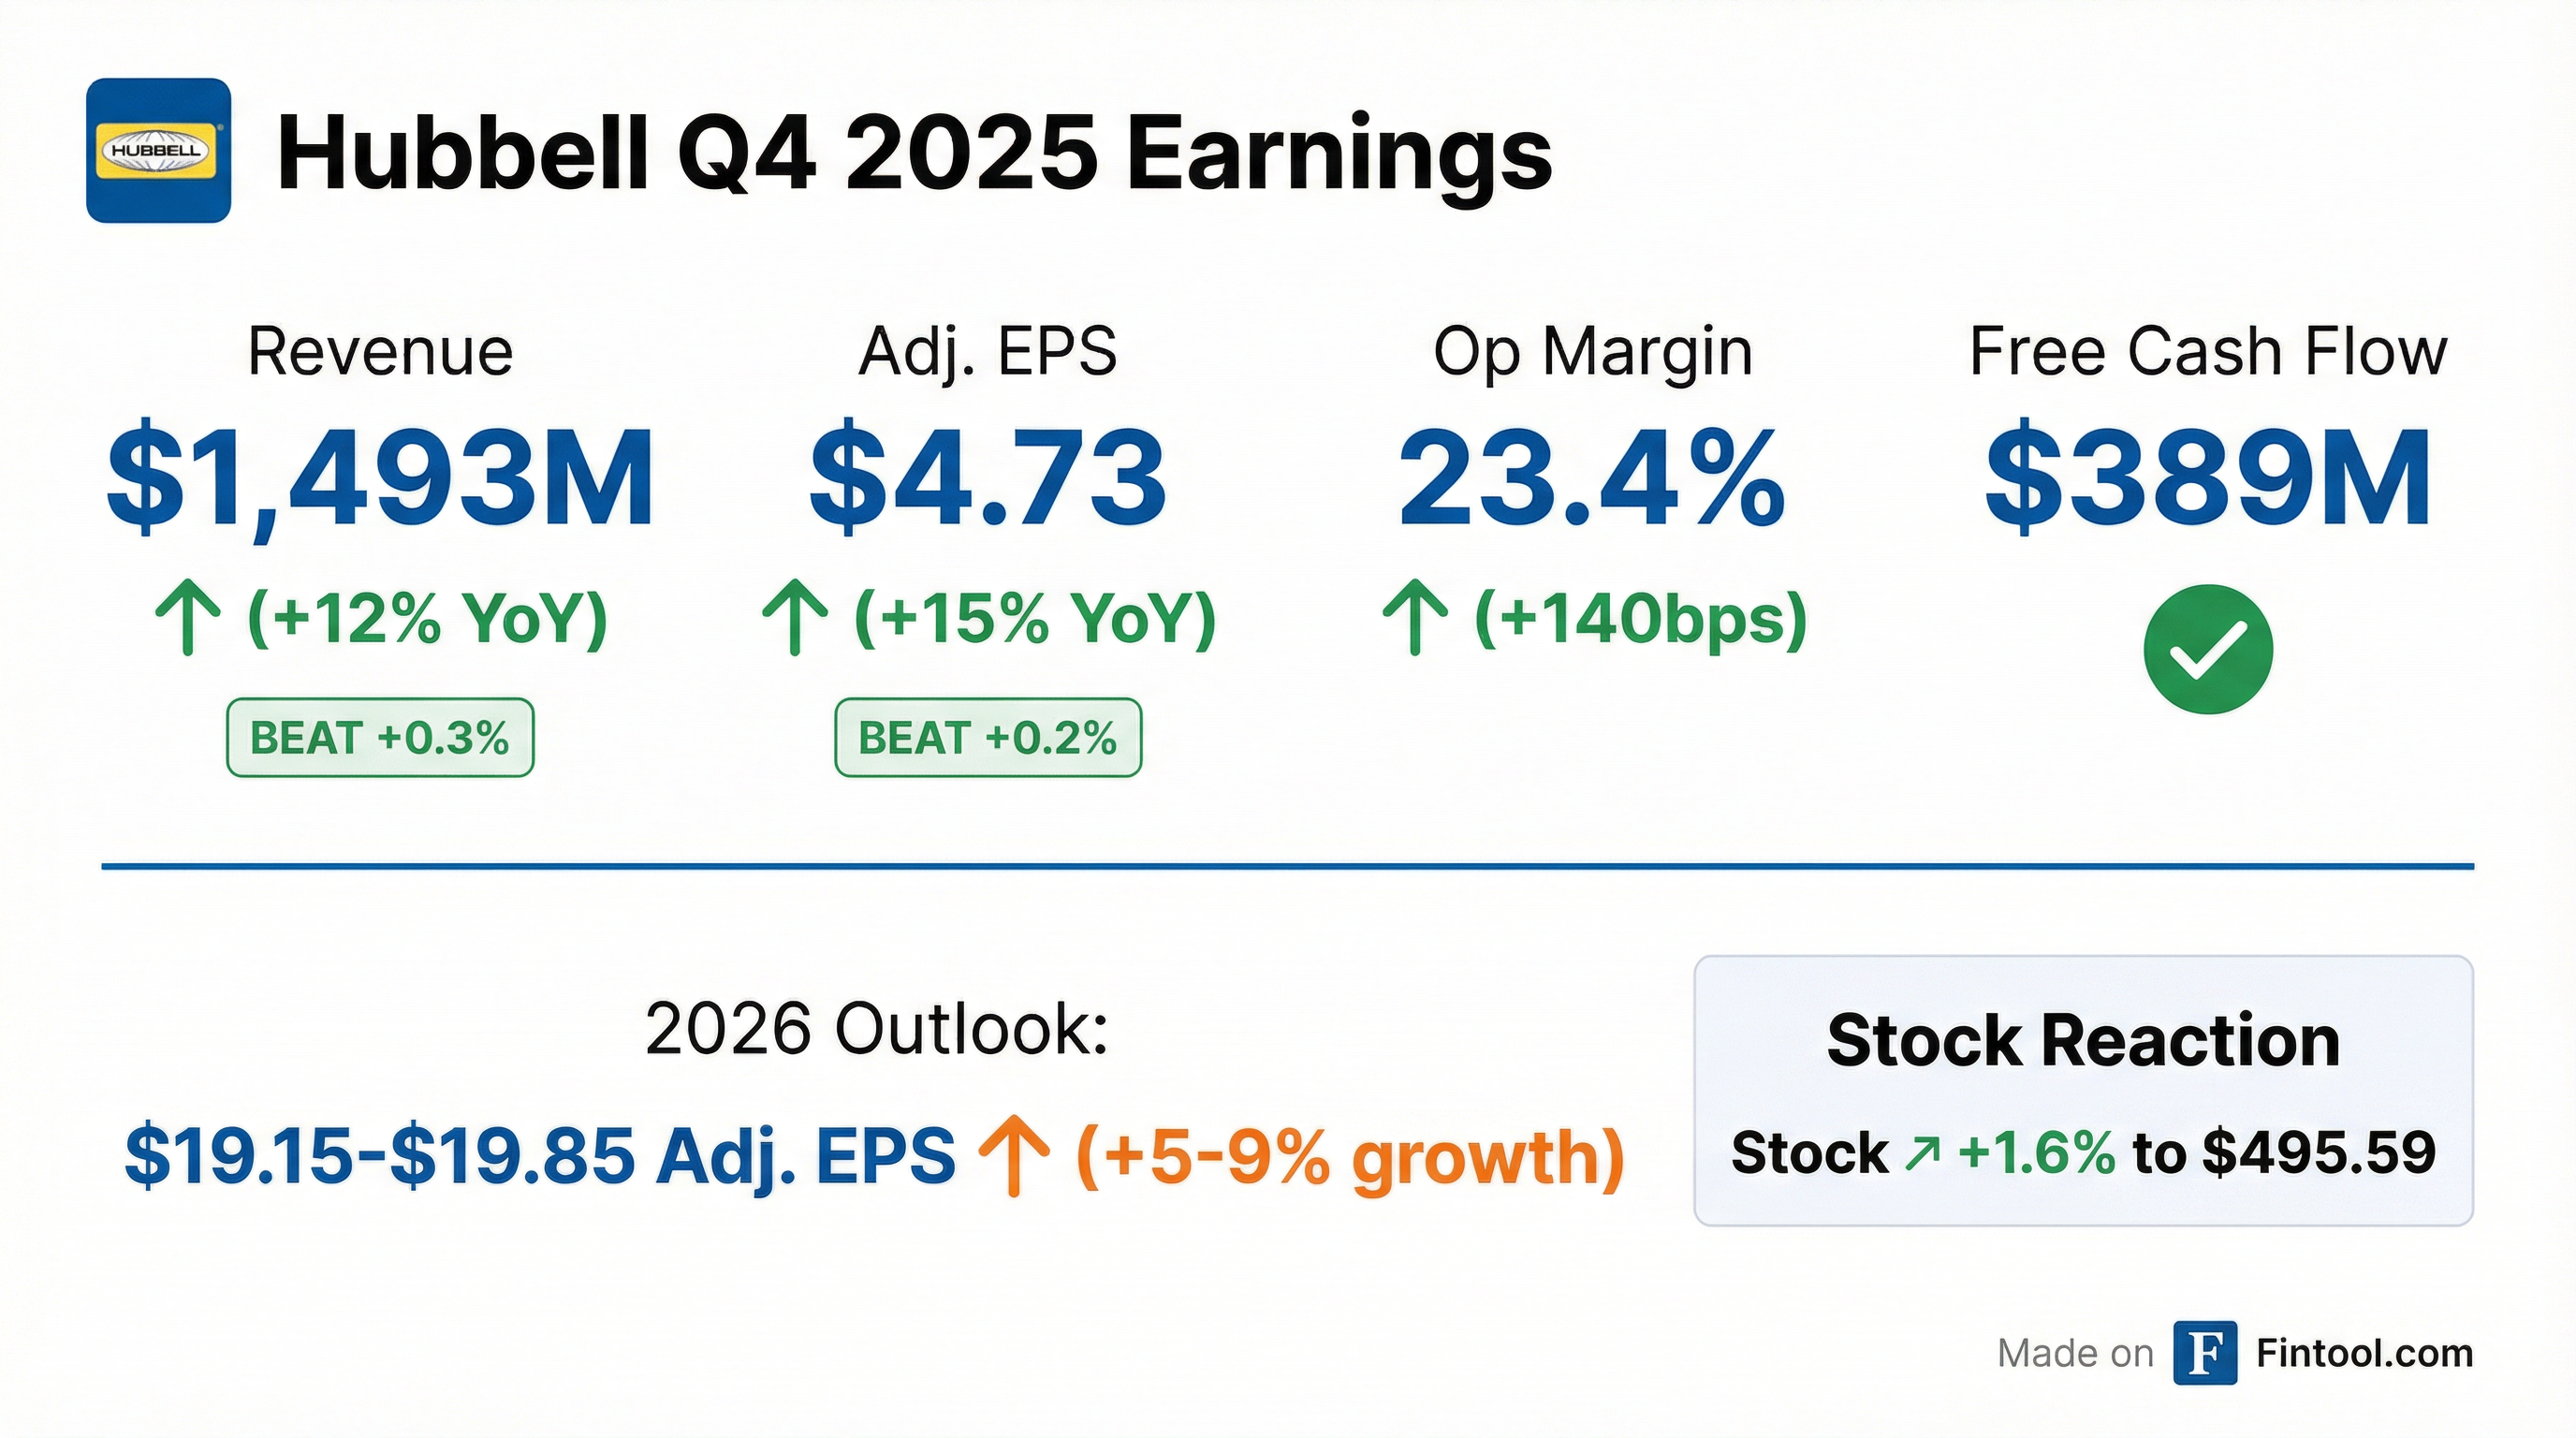
- Hubbell delivered 4Q25 net sales of $1.49 billion (+12% Y/Y), adjusted operating profit of $349 million (+19% Y/Y), adjusted diluted EPS of $4.73 (+15% Y/Y), and free cash flow of $389 million.
- For FY25, net sales were $5.84 billion (+4% Y/Y), adjusted operating profit was $1.33 billion (+7% Y/Y), adjusted EPS was $18.21 (+10% Y/Y), and free cash flow was $875 million (90% conversion).
- The company forecasts 2026 sales growth of 7–9% (5–7% organic), adjusted EPS of $19.15–$19.85, and >90% free cash flow conversion on adjusted income.
- Q4 net sales of $1.493 billion, up 12% YoY, driven by 9% organic growth and 3% from acquisitions.
- Q4 adjusted operating profit of $349 million (+19% YoY) and adjusted EPS of $4.73 (+15% YoY); adjusted operating margin expanded 140 bps.
- Utility Solutions Q4 sales of $936 million (+10%; organic +7%) with grid infrastructure organic growth of 12%; Electrical Solutions Q4 organic sales growth of 13% led by 60% data center growth—both segments saw margin expansion.
- FY 2025 free cash flow of $875 million (15% margin) and 19% ROIC; net debt/EBITDA of 1.3× at year-end.
- 2026 guidance: 7–9% total sales growth, $19.15–$19.85 adjusted EPS, ~90% free cash flow conversion; 5–7% organic growth and continued margin expansion.
- Q4 highlights: 12% total sales growth, 19% adjusted operating profit growth, 15% adjusted EPS growth, driven by 9% organic growth.
- Segment performance: Utility Solutions net sales of $936 M (+10%, organic +7%) with 20% adj. op profit growth and 200 bps margin expansion ; Electrical Solutions net sales of $557 M (+13% organic) with 18% adj. op profit growth and 60 bps margin expansion.
- Cash flow & leverage: Q4 free cash flow of $389 M; full-year 2025 free cash flow $875 M (90% conversion); net debt/EBITDA of 1.3x exiting the year.
- 2026 outlook: 7–9% total sales growth, $19.15–$19.85 adj. EPS, ~90% free cash flow conversion, and continued margin expansion.
- Strong Q4 sales of $1.493 billion (+12% YoY) driven by 9% organic growth, with adjusted operating profit of $349 million (+19%) and 140 bps margin expansion; adjusted EPS of $4.73 (+15%).
- Utility Solutions segment Q4 sales of $936 million (+10% YoY, 7% organic), with grid infrastructure up 12% organically; adjusted operating profit of $235 million (+20%) and 200 bps margin expansion.
- Electrical Solutions segment Q4 sales of $557 million, with 13% organic growth led by >60% data center expansion; adjusted operating profit of $114 million (+18%) and 60 bps margin expansion.
- Full-year 2025 free cash flow of $875 million (15% margin), ROIC of 19%, and net debt/EBITDA of 1.3×; expects $900 million–$1 billion free cash flow in 2026.
- Q4 diluted EPS of $4.19; adjusted diluted EPS of $4.73 (up 15% y/y)
- Q4 net sales up 12% (organic +9%; acquisitions +3%)
- Q4 operating margin of 20.9%; adjusted operating margin of 23.4% (up 140 bps y/y)
- FY 2025 diluted EPS of $16.54; adjusted diluted EPS of $18.21 (up 10% y/y)
- FY 2026 guidance: GAAP EPS $17.30–$18.00; adjusted EPS $19.15–$19.85
- In Q4, net sales rose 12% (organic +9%; M&A +3%) to $1.493 billion, GAAP diluted EPS was $4.19 and adjusted EPS $4.73 (up 15% y/y), and adjusted operating margin expanded 140 bps to 23.4%.
- For FY 2025, net sales grew 4% to $5.845 billion, GAAP diluted EPS was $16.54 and adjusted EPS $18.21 (up 10% y/y).
- FY 2026 outlook calls for net sales growth of 7–9% (organic 5–7%), GAAP diluted EPS of $17.30–18.00 and adjusted EPS $19.15–19.85.
- On November 14, 2025, Hubbell completed a public offering of $400 million aggregate principal amount of 4.800% Senior Notes due 2035.
- Net proceeds of $392.0 million are expected to be used, together with cash on hand, to redeem in full $400 million of existing 3.350% Senior Notes due 2026, with redemption set for December 1, 2025.
- The Notes are unsecured, unsubordinated obligations under the Base Indenture (dated September 15, 1995), bear interest at 4.800% per annum payable semi-annually on May 15 and November 15, and mature on November 15, 2035.
- The Notes are redeemable at the company’s option and include a change-of-control provision allowing holders to require the company to repurchase the Notes at 101% of principal plus accrued interest.
- Hubbell Inc. priced a $400 million offering of 4.80% senior notes due 2035 on October 30, 2025
- The offering is expected to close November 14, 2025, and net proceeds, together with cash on hand, will fully redeem the company’s 3.350% notes due March 1, 2026
- BofA Securities, HSBC Securities and J.P. Morgan acted as joint book-running managers for the issuance
- Sales grew 4% to $1.5 billion, operating profit rose 4% to $358 million, adjusted EPS increased 12%, and free cash flow climbed 34%.
- Achieved strong high single-digit organic growth in Electrical Solutions and Grid Infrastructure; Grid Automation sales declined 18% but are forecast to normalize in Q4.
- Raised full-year 2025 adjusted EPS guidance to $18.10–18.30, driven by margin improvements and a lower tax rate.
- Completed acquisition of DMC Power in October, projected to add approximately $0.20 to adjusted EPS in 2026.
- Announced CFO Bill Sperry will retire at year-end, with Joe Capozzoli appointed as successor effective 2026.
- Q3 sales increased 4% to $1.5 billion, operating profit rose 4% to $358 million, adjusted EPS grew 12%, and free cash flow jumped 34% to $254 million.
- Organic growth was driven by high single-digit gains in Electrical Solutions and Grid Infrastructure, while Grid Automation declined 18%, with normalization expected in Q4.
- Full-year 2025 EPS guidance was raised to $18.10–$18.30 (previously $17.65–$18.15), underpinned by 3–4% organic growth and 50–100 bps of margin expansion.
- Closed the acquisition of DMC Power (adding ~$0.20 EPS accretion in 2026) and announced CFO Bill Sperry’s retirement, with Joe Capozzoli named successor effective 2026.
Quarterly earnings call transcripts for HUBBELL.
Ask Fintool AI Agent
Get instant answers from SEC filings, earnings calls & more