Earnings summaries and quarterly performance for JACOBS SOLUTIONS.
Research analysts who have asked questions during JACOBS SOLUTIONS earnings calls.
Andrew J. Wittmann
Robert W. Baird & Co.
8 questions for J
Sangita Jain
KeyBanc Capital Markets
7 questions for J
Michael Dudas
Vertical Research Partners
6 questions for J
Sabahat Khan
RBC Capital Markets
6 questions for J
Steven Fisher
UBS
6 questions for J
Andy Kaplowitz
Citigroup Inc.
5 questions for J
Jamie Cook
Truist Securities
5 questions for J
Jerry Revich
Goldman Sachs Group Inc.
5 questions for J
Adam Bubes
Goldman Sachs Group, Inc.
3 questions for J
Chad Dillard
AllianceBernstein
3 questions for J
Andrew Kaplowitz
Citigroup
2 questions for J
Charles Albert Dillard
Bernstein
2 questions for J
Judah Aronovitz
UBS Group AG
2 questions for J
Kevin Wilson
Truist Securities
2 questions for J
Mike Dudas
Vertical Research Partners
2 questions for J
Jerry Revitch
Wells Fargo & Company
1 question for J
Natalia
Citi
1 question for J
Sangeetha Jain
KeyBanc Capital Markets
1 question for J
Recent press releases and 8-K filings for J.
- On February 24, 2026, Jacobs Solutions Inc. and its subsidiary entered into an underwriting agreement to issue $800 million of 4.750% Senior Notes due 2031 and $500 million of 5.375% Senior Notes due 2036, fully and unconditionally guaranteed by Jacobs Engineering Group Inc.
- The Company expects net proceeds of approximately $1,286 million after underwriting discounts and expenses, to be used for the cash consideration of a pending acquisition, repayment of revolving credit and term loan borrowings, and for general corporate purposes
- The offering is expected to close on March 3, 2026, subject to customary closing conditions, with securities issued under the existing base indenture (dated February 16, 2023) and a Third Supplemental Indenture effective at closing
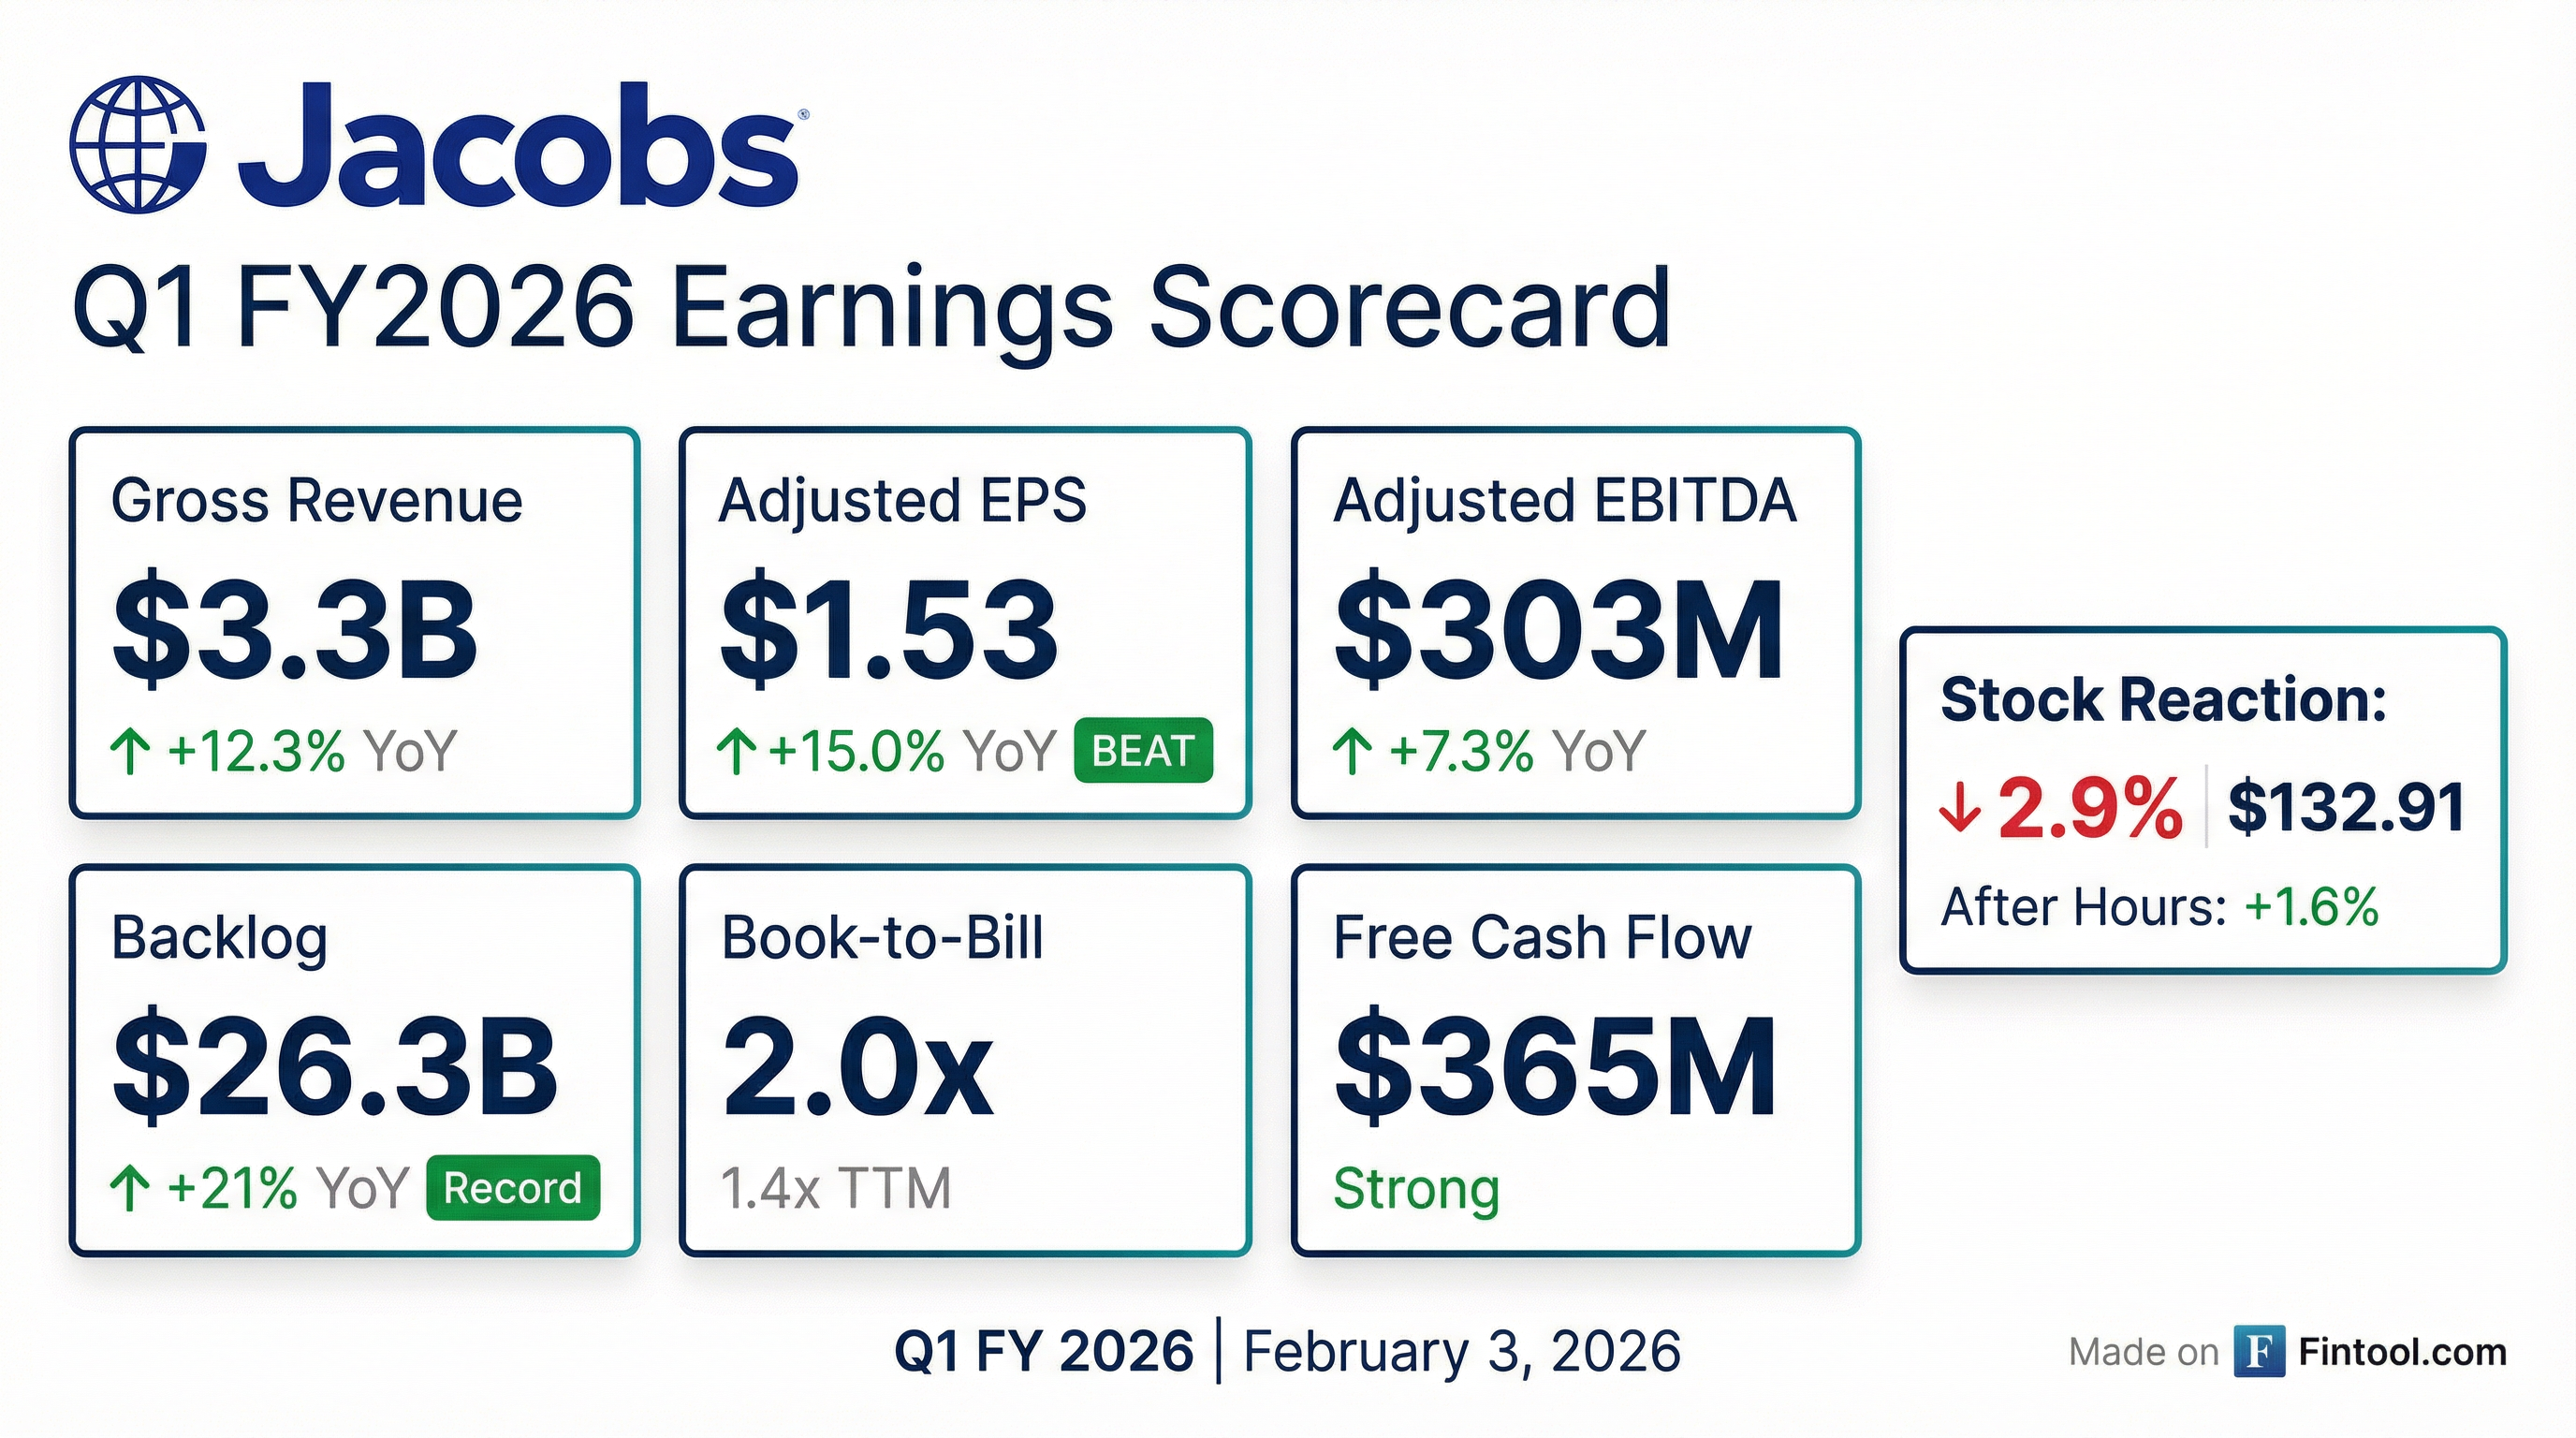
- Jacobs reported a trailing-12-month book-to-bill rising from 1.2 to 1.4, with Q1 at 2.0, and a record backlog split across critical infrastructure (50%), life sciences/advanced manufacturing (25%) and water/environmental (25%).
- The data center segment now represents 3–3.5% of revenues, nearly doubling over the past two years, and rises to ~10% when including utilities and chip-manufacturing work, supported by a growing pipeline.
- Jacobs has deployed 32+ AI-enabled platforms (e.g., Acuity, Engage AI) to drive client efficiencies and margin expansion, and has built a proprietary LLM, Jacobs AI, leveraging 40 years of project data.
- The company returned >100% of free cash flow in FY 2025 and is committed to ≥65% in FY 2026, raised its dividend 12.5%, is buying back stock aggressively, and targets 16%+ adj. EBITDA margin by FY 2029 via operating leverage and expanded global delivery.
- Jacobs reported a record backlog with a Q1 Book-to-Bill of 2.0 and a trailing-12-month ratio of 1.4; backlog mix is 50% critical infrastructure, 25% life sciences & advanced manufacturing and 25% water & environmental.
- Advanced facilities end markets are viewed as sustainable: data center revenue is 3–3.5% of total, nearly doubling over two years, and when combined with utilities and chip-manufacturing work, AI infrastructure accounts for ~10% of revenues.
- Digital transformation is driven by 32 AI-enabled platforms co-created with clients—boosting efficiency and multi-year contract stickiness—and Jacobs has built its own LLM (“Jacobs AI”) from 40 years of project data.
- Jacobs took full ownership of PA (now 2,000 digital specialists), where margins run 22% with 5%+ revenue growth; capital allocation prioritizes organic growth, returning >100% of free cash flow via buybacks (targeting ≥65%) and raising the dividend by 12.5%.
- The company targets 16%+ adjusted EBITDA margin by FY 2029, having expanded margins by 110 bps in FY 2025, with future gains driven by operating leverage, global delivery and improved commercial mix.
- Jacobs delivered a record backlog with trailing-12-month book-to-bill rising to 1.4x, underpinned by 50% critical infrastructure, 25% life sciences & advanced manufacturing, and 25% water & environmental end-market exposure, and saw a 2.0x book-to-bill in Q1.
- Advanced facilities markets remain sustainable, driven by life sciences, advanced manufacturing, and data centers, with data center revenue at 3–3.5% of total revenues—doubling over two years—and Jacobs’ scope spanning AI infrastructure from chip design through power and water systems.
- Jacobs acquired the remaining 35% of PA Consulting, integrating digital and science-based advisory into its platform and growing joint digital capabilities to 2,000 professionals to enhance organic cross-sell.
- The company reaffirmed its target of 16%+ adjusted EBITDA margin by FY2029, building on a 110 bp margin increase in FY2025 through operating leverage, global delivery, and improved commercial mix.
- Capital allocation priorities are organic growth investment, aggressive share repurchases (over 100% of FY2025 free cash flow; ≥65% committed in FY2026), and dividends (raised 12.5%), with near-term M&A focused on PA.
- Jacobs Solutions delivered 8.2% organic revenue growth in Q1 and hit a record book-to-bill of 2.0, prompting an upward revision to its full-year outlook.
- Q1 bookings were broad-based, with data centers accounting for 20% of the total and the remainder spread across water, semiconductors, and transportation, underpinning backlog growth.
- CFO guided FY2026 EBITDA margins to expand by 50–80 bps and raised free cash flow margin guidance from 7–8% to 7–8.5%, driven by operating leverage, global delivery, and mix improvements.
- The company is finalizing the acquisition of the remaining 35% stake in PA Consulting, aiming to deepen front-end advisory and defense/security offerings in core end-markets.
- Organic Q1 growth accelerated with 8.2% organic revenue increase and a record 2.0 book-to-bill, prompting a guidance raise for FY2026.
- AI and digital tools are enhancing project efficiency and margin expansion, supporting both top-line and bottom-line improvements.
- Q1 EBITDA margin was 13.4%, with FY2026 expected to improve by 50–80 bps driven by operating leverage and global delivery, targeting 16%+ by FY2029.
- FY2026 free cash flow margin guidance increased to 7%–8.5% from 7%–8%, with Q1 FCF ~$360 M and leverage at 0.8x, underpinning continued share buybacks.
- Planned acquisition of the remaining 35% stake in PA Consulting, complementing Jacobs’ end-market expertise, with PA expected to grow high single digits at 22% EBITDA margins.
- Jacobs delivered 8.2% organic top-line growth in Q1 and achieved an all-time high book-to-bill of 2.0, driving an upward revision to full-year revenue and margin guidance.
- Q1 backlog surged broad-based, with data center bookings accounting for ~20% of the uplift and the remainder evenly split across water, semiconductor and transportation sectors.
- FY26 EBITDA margin is expected to expand by 50–80 bps (Q1 at 13.4%), with a target of 16%+ by FY29; free cash flow margin guidance was raised to 7–8.5% for FY26 (up from 7–8%).
- Jacobs agreed to acquire the remaining 35% of PA Consulting, aiming to integrate early-stage advisory, digital and defense/security capabilities and capture cross-sell synergies, especially in the U.S. market.
- Key end markets include double-digit growth in U.S. power/infrastructure, high single-digit growth in water, and life sciences & advanced manufacturing representing ~25% of revenue with high single-digit growth powered by AI-enabled digital twin services.
- Jacobs, with PA Consulting and partners, won a four-year extension to lead the U.K. Department for Transport’s National Security Science and Research program, strengthening air, road and rail security.
- The consortium—also including QinetiQ, TNO, Iconal Technology, Cambridge University Technical Services and Prometheus Policing Services—will deliver science-led solutions to anticipate risks, respond to threats and safeguard critical transport infrastructure.
- Jacobs will apply its expertise in transport infrastructure, systems integration and resilience planning, while PA Consulting brings innovation in quantum, cyber and aviation security.
- Jacobs plans to acquire the remaining stake in PA Consulting by the end of its fiscal 2026 Q2, subject to customary closing conditions; both firms continue to operate independently until closing.
- Jacobs (NYSE: J) was awarded a role under the U.S. Missile Defense Agency’s Scalable Homeland Innovative Enterprise Layered Defense (SHIELD) IDIQ contract, which has a ceiling value of $151 billion.
- The contract focuses on developing and integrating advanced, scalable, software-enabled solutions across complex, mission-critical system environments.
- Jacobs’ core software mission capabilities include mission management, advanced data processing, cyber, artificial intelligence and machine learning, edge computing, modeling and simulation, and space engineering.
- The company generates approximately $12 billion in annual revenue and employs nearly 43,000 people.
- Jacobs was chosen by the Gulf Coast Protection District to lead engineering design of the Bolivar Roads Gate System, a central element of the Coastal Texas Project along the Texas Gulf Coast.
- The barrier will protect over 6 million residents and safeguard $800 billion in regional assets while maintaining operations on the Houston Ship Channel.
- Backed by nearly $1 billion in state funding, the Coastal Texas Project is a partnership with the U.S. Army Corps of Engineers and the Texas General Land Office.
- Jacobs brings expertise from more than 1,000 global resilience projects, with approximately $12 billion in annual revenue and 43,000 employees.
Fintool News
In-depth analysis and coverage of JACOBS SOLUTIONS.

Jacobs CEO Sees 'Early Innings' of AI Infrastructure Boom as Record Backlog Signals Multi-Year Growth

Jacobs Shareholders Approve All Proposals at 2026 Annual Meeting as $1.6B PA Consulting Acquisition Approaches Close

Jacobs Takes Full Control of PA Consulting in £3.05B Deal
Quarterly earnings call transcripts for JACOBS SOLUTIONS.
Ask Fintool AI Agent
Get instant answers from SEC filings, earnings calls & more