Earnings summaries and quarterly performance for AMERICAN TOWER CORP /MA/.
Executive leadership at AMERICAN TOWER CORP /MA/.
Steven O. Vondran
President and Chief Executive Officer
Bud Noel
Chief Operating Officer
Olivier Puech
Executive Vice President and President, International
Rich Rossi
Executive Vice President and President, U.S. Tower
Robert J. Meyer
Senior Vice President and Chief Accounting Officer
Rodney M. Smith
Executive Vice President, Chief Financial Officer and Treasurer
Ruth T. Dowling
Executive Vice President, Chief Administrative Officer, General Counsel and Secretary
Board of directors at AMERICAN TOWER CORP /MA/.
Bruce L. Tanner
Director
Craig Macnab
Director
Gene Reilly
Director
Grace D. Lieblein
Director
Kelly C. Chambliss
Director
Kenneth R. Frank
Director
Neville R. Ray
Director
Pamela D. A. Reeve
Chairperson of the Board
Rajesh Kalathur
Director
Robert D. Hormats
Director
Teresa H. Clarke
Director
Research analysts who have asked questions during AMERICAN TOWER CORP /MA/ earnings calls.
Ric Prentiss
Raymond James
6 questions for AMT
Michael Rollins
Citigroup
5 questions for AMT
Benjamin Swinburne
Morgan Stanley
4 questions for AMT
Eric Luebchow
Wells Fargo
4 questions for AMT
James Schneider
Goldman Sachs
4 questions for AMT
Richard Choe
JPMorgan Chase & Co.
4 questions for AMT
Batya Levi
UBS
3 questions for AMT
David Barden
Bank of America
3 questions for AMT
Michael Funk
Bank of America
3 questions for AMT
Nicholas Del Deo
MoffettNathanson
3 questions for AMT
Nick Del Deo
MoffettNathanson LLC
3 questions for AMT
Jim Schneider
Goldman Sachs
2 questions for AMT
Simon Flannery
Morgan Stanley
2 questions for AMT
Ari Klein
BMO Capital Markets
1 question for AMT
Brandon Nispel
KeyBanc Capital Markets
1 question for AMT
Jonathan Atkin
RBC Capital Markets
1 question for AMT
Matthew Niknam
Deutsche Bank
1 question for AMT
Mike Funk
Bank of America
1 question for AMT
Recent press releases and 8-K filings for AMT.
- Attributable AFFO per share grew 8% for the full year (including 13% in Q4), driven by robust leasing demand across tower and data center businesses.
- 2026 outlook calls for organic tenant billings growth of ~1% (or ~4% ex-DISH), property revenue up ~3% (or ~5% cash FX neutral), and adjusted EBITDA growth of ~2% (or ~5% ex-DISH and FX).
- AFFO per share expected to rise ~1% in 2026 (or ~5% ex-DISH, FX, and refinancing), alongside a ~5% dividend increase to ~$3.3 billion in cash distributions.
- Capital plan includes building ~2,000 new tower sites, deploying ~$1.9 billion in discretionary spend, and repurchasing $365 million of stock in Q4 2025 and $53 million YTD 2026.
- DISH default accounted for ~2% of 2025 property revenue, fully removed from 2026 growth run-rate, with legal action ongoing to recover unpaid obligations.
- Full-year 2025 attributable AFFO per share grew 8%, including 13% growth in Q4, driven by robust leasing demand across towers and data centers.
- Consolidated property revenue rose 4% (or 5% excluding non-cash straight-line and FX), with Organic Tenant Billings up 5% and data center revenue up 14%.
- DISH Network defaulted on its lease payments, representing 2% of consolidated property revenue and 4% of U.S. & Canada revenue; full recovery efforts are underway and DISH churn is excluded from 2026 organic growth.
- 2026 outlook calls for Organic Tenant Billings Growth of 1% (or 4% ex-DISH), property revenue growth of 3% (or 5% cash FX neutral), adjusted EBITDA growth of 2% (or 5% ex-DISH churn), and attributable AFFO per share growth of 1% (or 5% ex-DISH churn).
- Capital allocation includes a ~5% dividend increase to ~$3.3 billion, $1.9 billion of capital deployments (including ~2,000 new sites), and $1.6 billion remaining share repurchase authorization.
- For full-year 2025, property revenue grew ~4% y/y and adjusted EBITDA rose ~5%, driven by ~5% organic tenant billings growth and ~14% data center revenue growth; AFFO per share increased ~8%.
- DISH Networks defaulted on its lease obligations (≈2% of consolidated property revenue; ≈4% of U.S. & Canada revenue), removed from 2026 organic growth guidance; litigation to recover payments is ongoing.
- 2026 outlook: organic tenant billings growth ~1% (≈4% ex-DISH), property revenue ~3% (≈5% ex-DISH), cash-adjusted EBITDA ~2% (≈5% ex-DISH), and AFFO per share ~1% (≈5% ex-DISH); dividend +5% to $3.3 B and ~2,000 new tower builds planned.
- Operational efficiency initiatives have delivered 300 bps of global tower cash EBITDA margin expansion since 2022 (SG&A ~4.5% of revenue), with a target of an additional 200–300 bps over the next five years via cost, land and AI programs.
- Capital allocation: leverage reduced to 4.9×, repurchased $365 M of stock in Q4 (plus $53 M YTD) with $1.6 B remaining buyback authorization, and ~$1.9 B of discretionary CapEx focused on developed markets and CoreSite.
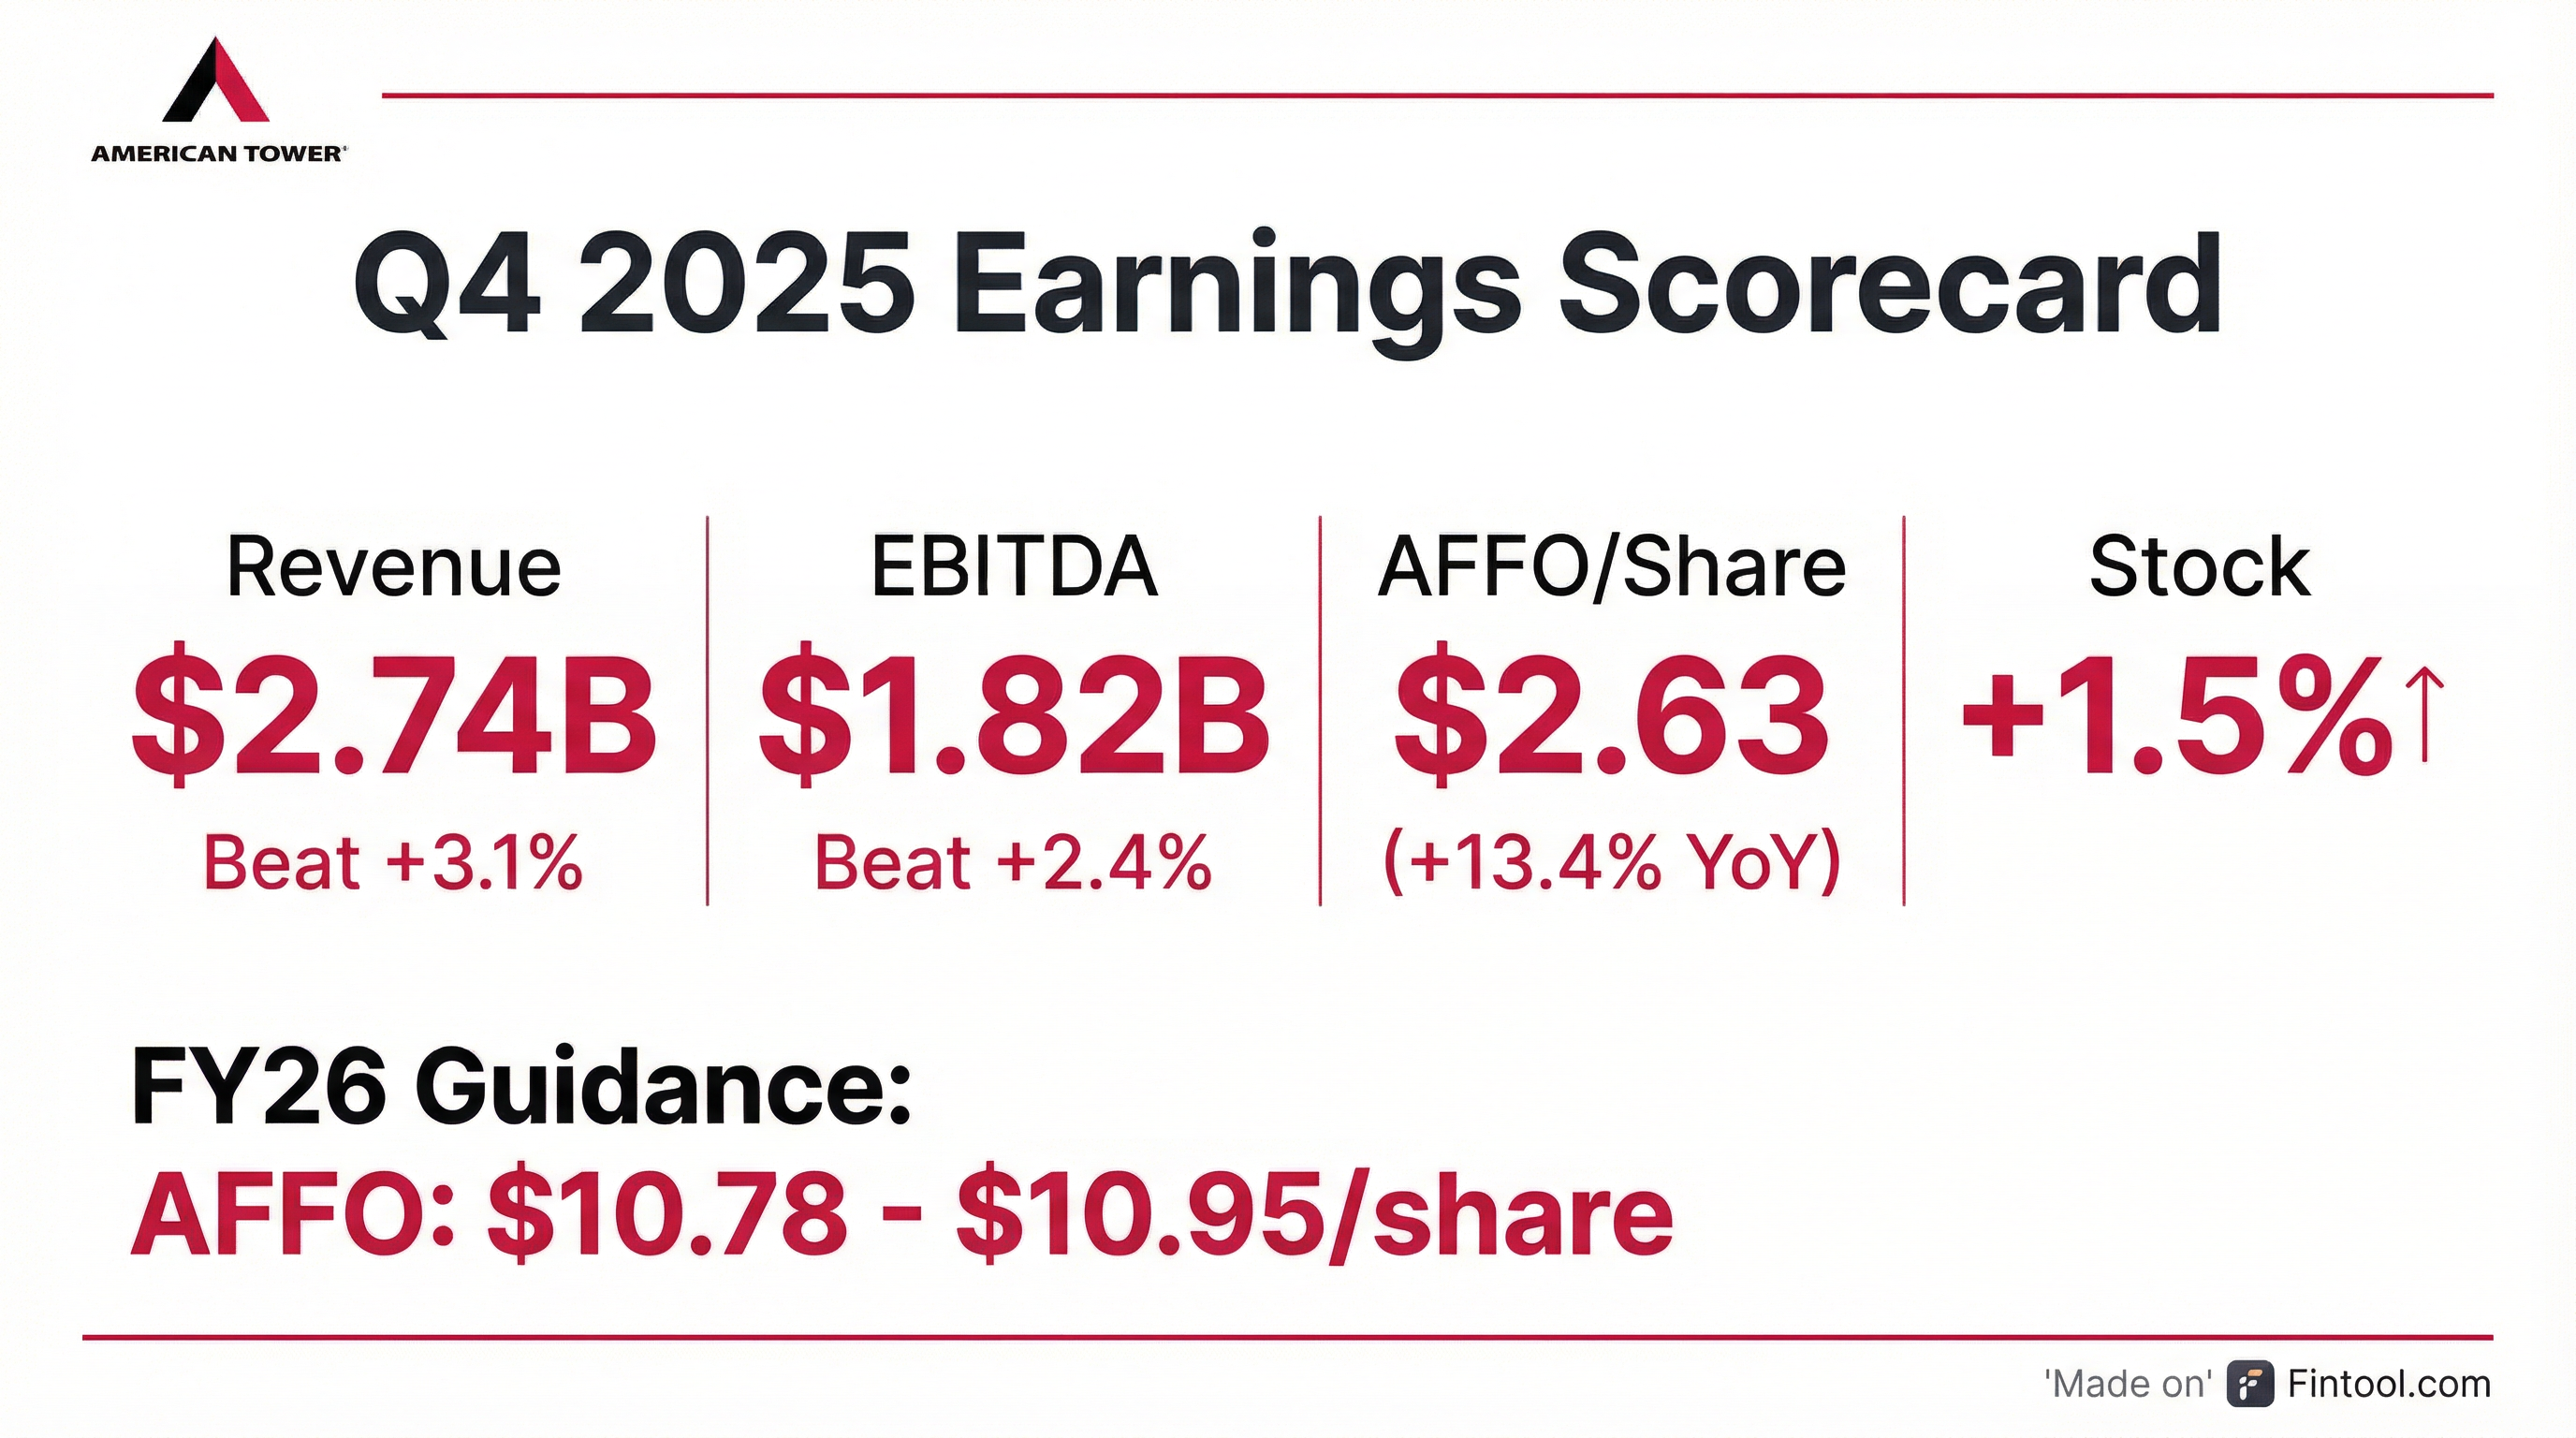
- Q4 2025 total revenue was $2.738 B, with adjusted EBITDA of $1.819 B and AFFO per share of $2.63
- FY 2025 results: property revenue increased 3.7% to $10.305 B, adjusted EBITDA grew 4.7% to $7.130 B, and AFFO per share rose 8.0% to $10.76
- 2026 guidance: organic tenant billings growth of ~4%, property revenue growth of ~2%, adjusted EBITDA expected to be roughly flat, and AFFO per share projected at $10.78–$10.95
- Balance sheet strength: net leverage at 4.9×, liquidity of $11.1 B, and 96% fixed-rate debt as of December 31, 2025
- Q4 2025 total revenue of $2,738 M, up 7.5%, Adjusted EBITDA of $1,819 M (+7.5%) and AFFO per share of $2.63 (+13.4%)
- Full Year 2025 revenue of $10,645 M, up 5.1%; Net income of $2,629 M, up 15.3%; AFFO (as adjusted) of $5,042 M, up 8.2%
- Declared $1.70 per share for Q4 and $6.80 for full year distributions, both +4.9% year-over-year
- Repurchased ~2 M shares for ~$365 M in Q4 (plus 312 K shares for $53 M post-quarter), with ~$1.6 B remaining under the buyback program
- 2026 outlook: Total property revenue of $10,440–$10,590 M (+2.0% at midpoint) and AFFO per share of $10.78–$10.95 (+1.0%)
- Q4 2025 total revenue rose 7.5% to $2,738 M, net income fell 32.0% to $837 M, adjusted EBITDA grew 7.5% to $1,819 M, and AFFO increased 13.1% to $1,230 M.
- Full Year 2025 total revenue rose 5.1% to $10,645 M, net income rose 15.3% to $2,629 M, adjusted EBITDA grew 4.7% to $7,130 M, and AFFO increased 2.2% to $5,042 M.
- As of December 31, 2025, liquidity totaled $11.1 B, including $1.5 B in cash and $9.6 B available under credit facilities; the company issued $850 M of 4.700% senior unsecured notes due 2032 to refinance revolving debt.
- 2026 Outlook: total property revenue of $10,440–$10,590 M, net income of $2,945–$3,025 M, adjusted EBITDA of $7,090–$7,160 M, AFFO of $5,035–$5,115 M, and AFFO per share of $10.78–$10.95.
- CoreSite’s Chicago data center campus now offers native 400 Gbps AWS Direct Connect, providing low-latency, high-bandwidth access to AWS at reduced cost.
- The 400G link supports performance-intensive workloads, including AI applications, GPU-optimized neoclouds, real-time threat analysis, and latency-sensitive financial trading.
- Customers can realize up to 70% savings on data replication and eliminate certain data egress fees through direct interconnection.
- This launch expands CoreSite’s 400G AWS Direct Connect offering to its Santa Clara (CA) and Reston (VA) campuses.
- Strategic pillars for 2026 include maximizing organic growth, disciplined cost management, selective CapEx in developed markets, and maintaining an investment-grade balance sheet to drive industry-leading AFFO per share growth.
- DISH litigation risk: DISH accounts for ~2% of global revenues (≈$200 million/year) with potential exposure net-present-valued at $1.5–2 billion; American Tower filed suit in late 2025 to enforce a 2021 MLA through 2036.
- US tower market outlook: mobile data usage has grown ~35% annually, and carriers are shifting from 5G coverage builds into quality and capacity densification—supporting mid-single-digit organic growth and laying groundwork for 6G deployments.
- Emerging-market trends: Latin America to see low growth in 2026–27 amid Brazilian churn and carrier bankruptcies, while Africa posts double-digit leasing growth offset by FX volatility; Mexico’s 5G investment remains on hold pending spectrum policy.
- CoreSite momentum: robust interconnection demand and record megawatt developments underpin expectations for upper single-digit to double-digit growth and position the business for edge computing synergies.
- Steve Vondran details four strategic pillars for 2026: maximize organic growth, disciplined cost management, focus discretionary CapEx on developed markets, and sustain an investment-grade balance sheet to drive industry-leading AFFO per share growth.
- Ongoing litigation with DISH represents 2% of global revenues (~$200 million annually) and is valued at $1.5–$2 billion in present-value risk.
- In the U.S., with initial 5G coverage largely complete, carriers are now prioritizing quality and capacity improvements—via site amendments and densification—supported by 35% annual mobile data growth over the past three years.
- The company is reallocating discretionary CapEx toward the U.S., Europe and CoreSite (targeting high single- to double-digit growth), while dynamically comparing stock buybacks versus investment returns to optimize capital deployment.
- Completed a registered public offering of $850.0 million aggregate principal amount of 4.700% senior unsecured notes due 2032, resulting in net proceeds of approximately $839.5 million.
- Intends to use the net proceeds to repay existing indebtedness under its $4.0 billion senior unsecured revolving credit facility.
- Notes mature on December 15, 2032 and bear interest at 4.700% per annum, payable semi-annually on June 15 and December 15, beginning June 15, 2026.
- Indenture covenants limit lien incurrences to an aggregate amount not exceeding 3.5× Adjusted EBITDA, include optional redemption with make-whole premiums, and require a 101% repurchase upon a Change of Control Triggering Event.
Quarterly earnings call transcripts for AMERICAN TOWER CORP /MA/.
Ask Fintool AI Agent
Get instant answers from SEC filings, earnings calls & more