Earnings summaries and quarterly performance for Avery Dennison.
Executive leadership at Avery Dennison.
Deon Stander
President & Chief Executive Officer
Danny Allouche
Senior Vice President & Chief Strategy and Corporate Development Officer
Francisco Melo
President, Solutions Group
Gregory Lovins
Senior Vice President & Chief Financial Officer
Ryan Yost
President, Materials Group
Board of directors at Avery Dennison.
Andres Lopez
Director
Bradley Alford
Director
David Flitman
Director
Francesca Reverberi
Director
Maria Fernanda Mejia
Director
Mitchell Butier
Chairman of the Board
Patrick Siewert
Lead Independent Director
Ward Dickson
Director
William Wagner
Director
Research analysts who have asked questions during Avery Dennison earnings calls.
George Staphos
Bank of America
8 questions for AVY
Jeffrey Zekauskas
JPMorgan Chase & Co.
8 questions for AVY
John McNulty
BMO Capital Markets
8 questions for AVY
Michael Roxland
Truist Securities
8 questions for AVY
Anthony Pettinari
Citigroup Inc.
7 questions for AVY
Ghansham Panjabi
Robert W. Baird & Co.
7 questions for AVY
John Dunigan
Jefferies
6 questions for AVY
Joshua Spector
UBS
4 questions for AVY
Matthew Roberts
Raymond James
4 questions for AVY
Matt Roberts
Raymond James Financial
4 questions for AVY
Josh Spector
UBS Group
3 questions for AVY
Michael Leithead
Barclays
3 questions for AVY
Bryan Burgmeier
Citigroup Inc.
1 question for AVY
Chris Perrella
UBS
1 question for AVY
Recent press releases and 8-K filings for AVY.
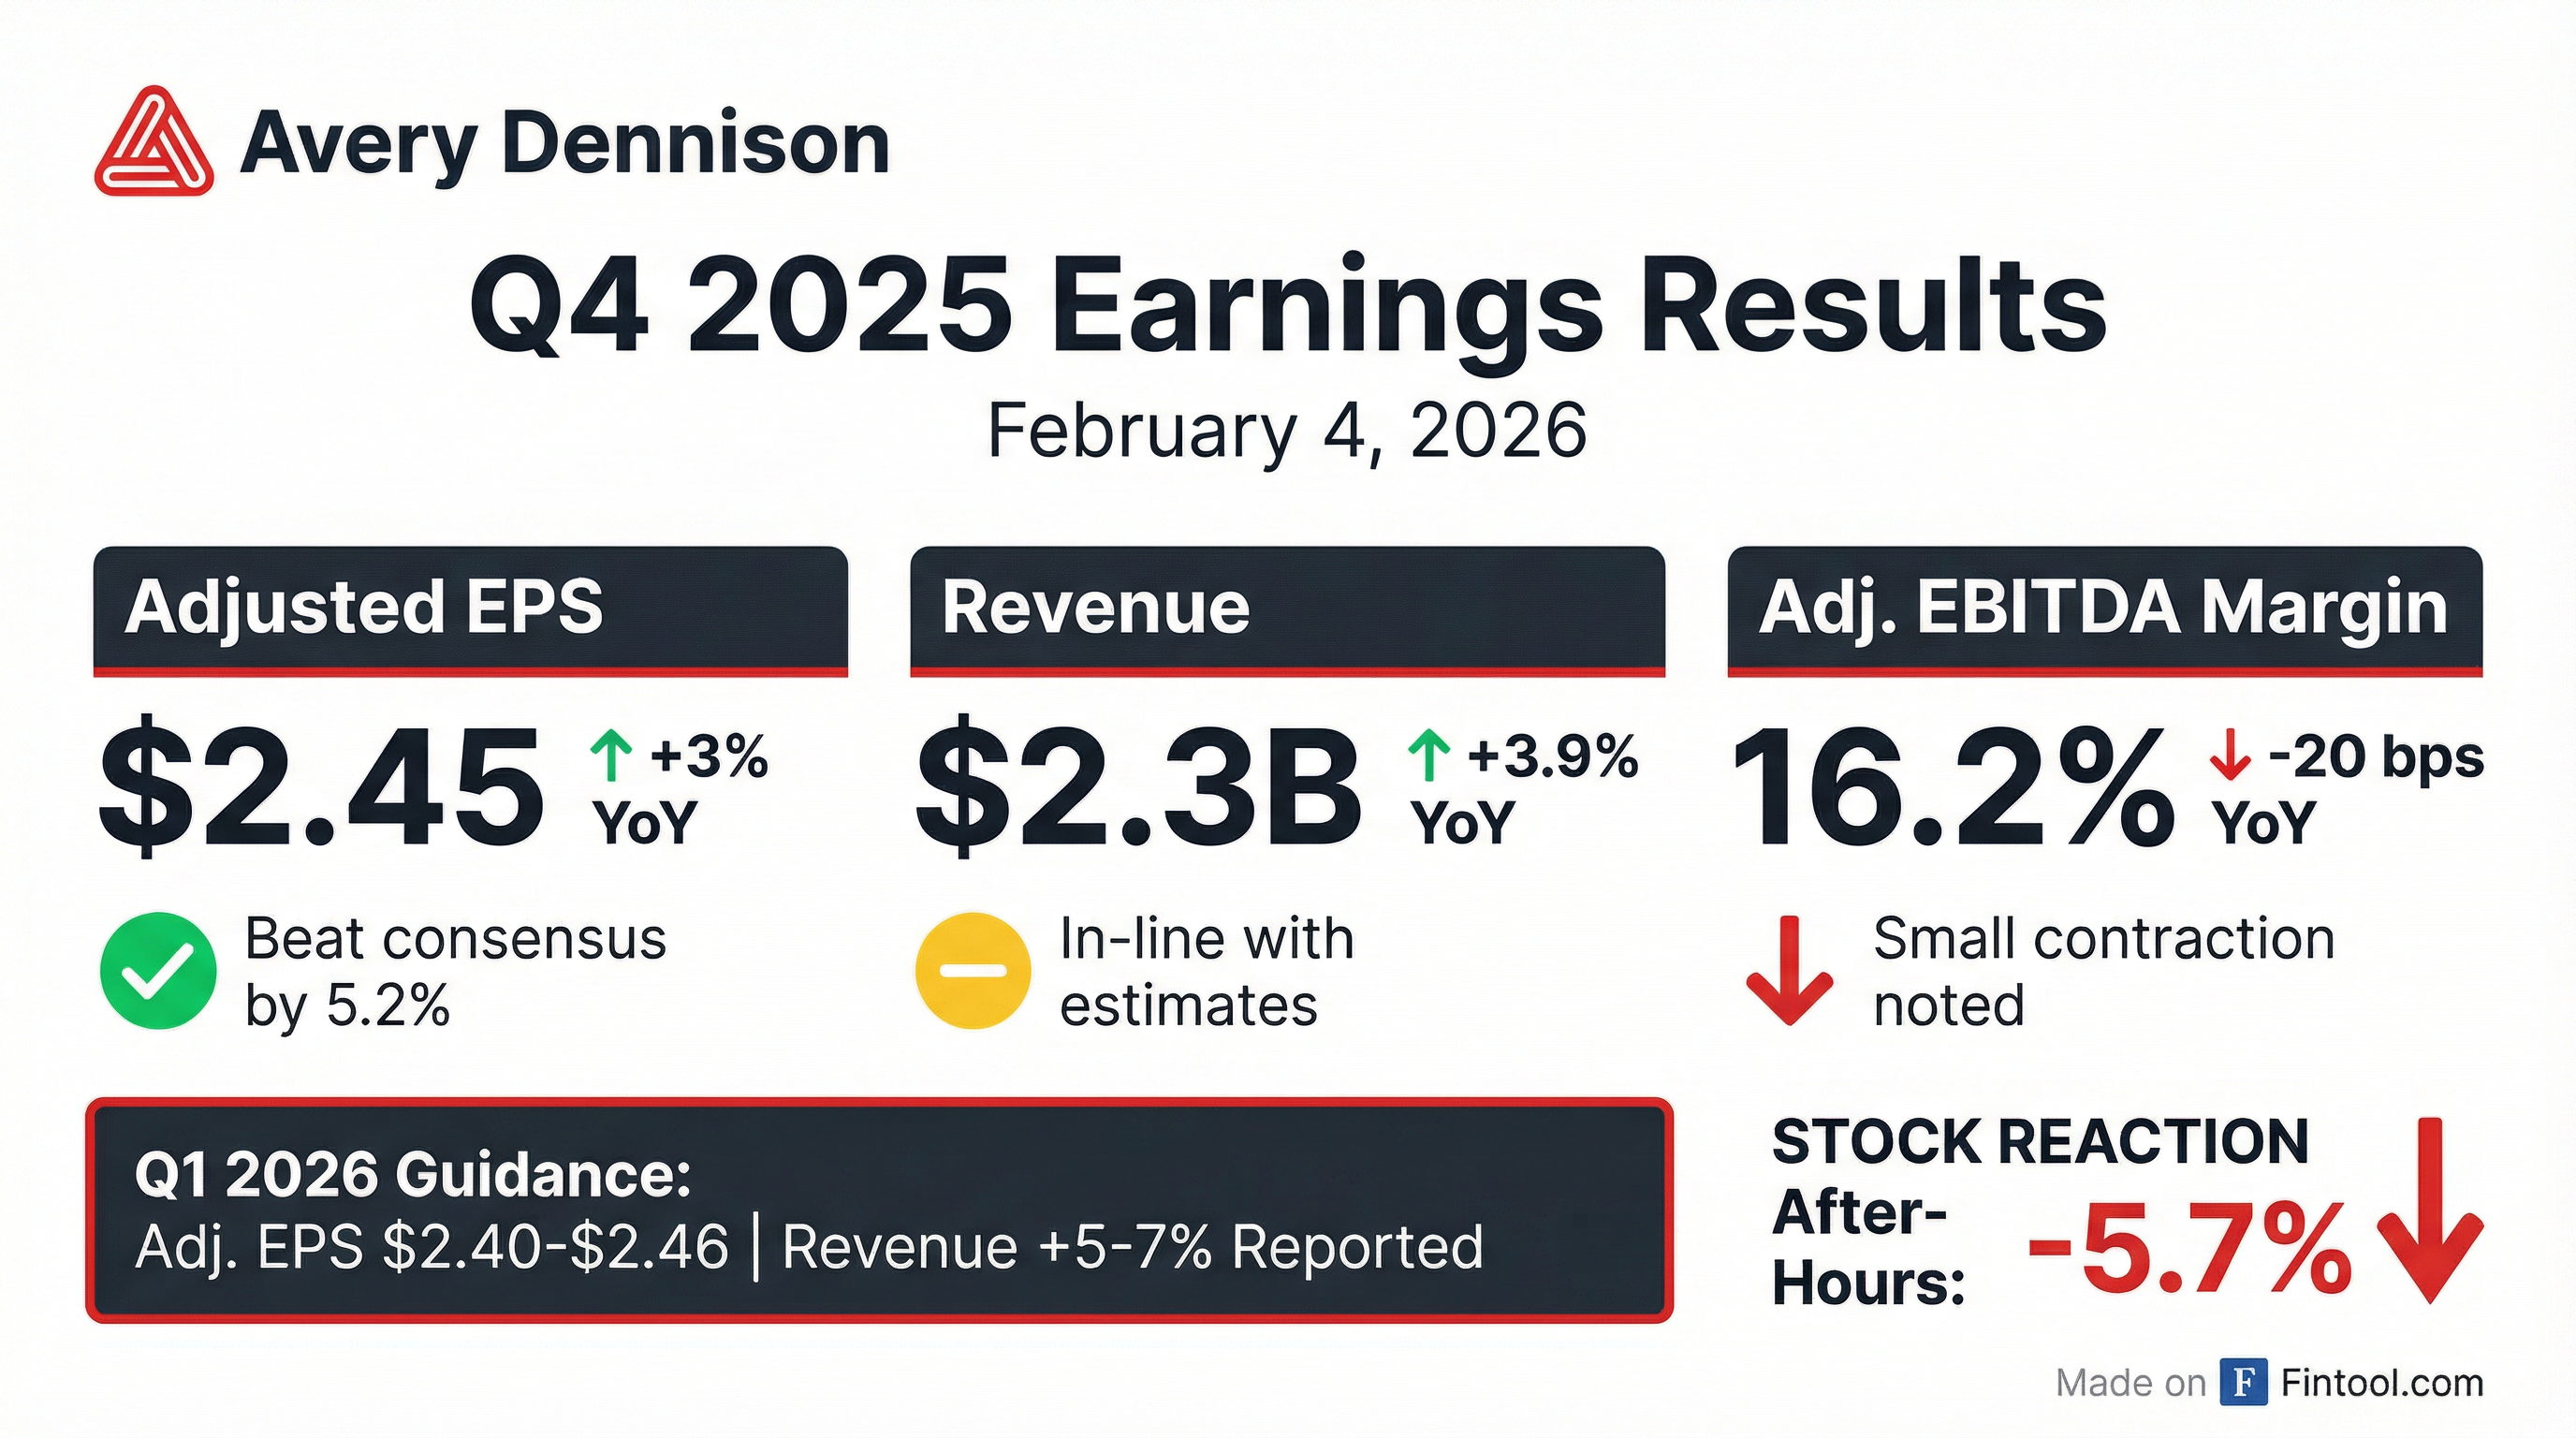
- Avery Dennison reported FY 2025 adjusted EPS of $9.53, up 1%, and Q4 adjusted EPS of $2.45, up 3% year over year.
- FY 2025 net sales were $8.9 billion, with organic sales growth of 0.2%; Q4 net sales were $2.3 billion, organic down 0.2%.
- High-value categories expanded to approximately 45% of sales, driving mid-single-digit organic growth in 2025.
- Generated $707 million of adjusted free cash flow with 103% conversion and returned $861 million to shareholders via buybacks and dividends.
- Maintained net debt to adjusted EBITDA of 2.4× and issued Q1 2026 adjusted EPS guidance of $2.40–$2.46.
- Delivered full-year 2025 adjusted EPS of $9.53 and $707 million of adjusted free cash flow, with an adjusted EBITDA margin of 16.4%.
- Q4 Materials Group sales rose 5%, with adjusted EBITDA margin at 16.6%, while Solutions Group sales increased 1.5% and margin reached 17.8%; enterprise-wide Intelligent Labels grew mid-single digits in the quarter.
- For Q1 2026, guides reported sales growth of 5–7% (organic 0–2%) and adjusted EPS of $2.40–$2.46, implying ~6% EPS growth at the midpoint.
- Outlook includes a $0.25 EPS benefit from currency and lower share count, $50 million of restructuring savings, normalization of temporary savings, targets ~100% free cash flow conversion, and ~$260 million in capital spending.
- Avery Dennison delivered Q4 adjusted EPS of $2.45, up 3% year-over-year, with reported sales up 3.9% and organic sales flat versus prior year.
- For full-year 2025, adjusted EPS totaled $9.53, adjusted free cash flow reached $707 million, and adjusted EBITDA margin was 16.4%.
- In Q4, Materials Group organic sales declined ~1% (adjusted EBITDA margin 16.6%), while Solutions Group organic sales rose 1.3% (adjusted EBITDA margin 17.8%).
- Management forecasts Q1 2026 reported sales growth of 5%–7% (organic 0%–2%) and adjusted EPS of $2.40–$2.46, implying ~6% earnings growth year-over-year.
- Avery Dennison achieved Q4 adj. EPS of $2.45, up 3% year-over-year, on net sales of $2.3 billion with organic sales down 0.2%.
- Full-year 2025 adj. EPS was $9.53, up 1%, on net sales of $8.9 billion and organic sales growth of 0.2%.
- Generated adj. free cash flow of $303 million in Q4 (FY $707 million, 103% conversion) and returned $191 million to shareholders in Q4 via share repurchases and dividends ($861 million for FY).
- Provided Q1 2026 guidance for adj. EPS of $2.40–$2.46, with expected reported sales growth of 5–7% and organic growth of 0–2%.
- In Q4 2025, the company delivered adjusted EPS of $2.45 (up 3% YoY), reported sales up 3.9% (organic flat), adjusted EBITDA margin of 16.2%, and generated $303 million of free cash flow, bringing full-year free cash flow to $707 million
- Materials Group Q4 sales rose 5% (organic slight decline), with high-value categories at 38% of portfolio and an adjusted EBITDA margin of 16.6%; Solutions Group sales grew 1.5%, with high-value categories at 60% and margin of 17.8%
- Enterprise-wide Intelligent Labels sales grew mid-single digits in Q4, driven by food, logistics & industrial (high-teens growth), while apparel & retail recovered to low-single-digit growth
- Q1 2026 guidance: adjusted EPS of $2.40–$2.46 (≈6% YoY growth at midpoint) on 0–2% organic sales growth, with no assumed macro tailwinds
- Delivered 4Q25 adjusted EPS of $2.45, up 3%, on net sales of $2.3 billion, up 3.9% versus prior year
- Achieved FY25 adjusted EPS of $9.53, up 1%, on net sales of $8.9 billion, up 1.1% versus prior year
- Generated $707 million in adjusted free cash flow and returned $861 million to shareholders in 2025 through dividends and share repurchases
- Provided Q1 2026 guidance for reported EPS of $2.27–$2.33 and adjusted EPS of $2.40–$2.46
- FY25 net sales of $8.9 billion (+1%), Reported EPS of $8.79 and Adjusted EPS of $9.53 (+1%).
- 4Q25 net sales of $2.3 billion (+4%), Reported EPS of $2.15 and Adjusted EPS of $2.45 (+3%).
- Returned $861 million to shareholders in 2025, including $572 million in share repurchases (3.2 million shares).
- Provided 1Q26 adjusted EPS guidance of $2.40–$2.46.
- Market projected to grow from $1.66 billion in 2024 to $3.15 billion by 2029 at a 13.7% CAGR (2024–2029).
- Near‐term expansion to $1.89 billion in 2025 at a 14.1% CAGR, driven by RFID adoption for shipment verification and asset tracking.
- Surge fueled by e-commerce and logistics demand—RFID tunnel readers enhance real-time tracking and reduce errors; U.S. e-commerce sales rose 5.3% year-over-year in August 2025.
- Key market participants include Avery Dennison alongside Honeywell, Zebra, Brady, Turck, and Clustag; North America leads with Asia-Pacific as the fastest-growing region.
- Delivered adjusted EPS of $2.37 (up 2% YoY) and reported sales of +1.5% YoY (organic flat); adjusted EBITDA margin was 16.5% and free cash flow nearly $270 million; quarter-end net debt/EBITDA was 2.2×.
- Materials Group organic sales declined 2%, with high-value and base categories down low single digits; segment adjusted EBITDA margin rose 50 bps to 17.5%.
- Solutions Group organic sales grew 4%, led by high-value categories up high single digits (Vestcom and Embelex each >10% growth) and apparel Intelligent Labels mid-single digit growth; enterprise-wide IL sales were up ~3%.
- Ongoing trade policy headwinds—particularly tariffs—continued to pressure base apparel and general retail volumes, though impacts mitigated by strategic sourcing and pricing; management expects Q4 sales and EPS growth amid gradual normalization.
- Strengthened strategic position by announcing a major RFID partnership with Walmart for fresh grocery, expanded Kroger collaboration, repurchased ~$454 million of stock YTD, increased dividend by 7%, and closed $390 million Tailor Adhesives bolt-on acquisition.
- Delivered adjusted EPS of $2.37, up 2% and above midpoint, on net sales of $2.2 billion
- Expanded adjusted EBITDA margin by 10 bps to 16.5%, and generated $269 million of adjusted free cash flow
- Completed the $390 million Taylor Adhesives acquisition and returned cash through $450 million of share repurchases and $215 million of dividends YTD
- Issued Q4 guidance for adjusted EPS of $2.35–$2.45, with reported sales growth expected at 5–7%, including a ~2% currency tailwind
Quarterly earnings call transcripts for Avery Dennison.
Ask Fintool AI Agent
Get instant answers from SEC filings, earnings calls & more