Earnings summaries and quarterly performance for BADGER METER.
Executive leadership at BADGER METER.
Kenneth C. Bockhorst
Chairman, President and Chief Executive Officer
Kimberly K. Stoll
Vice President – Sales and Marketing
Richard Htwe
Vice President – Global Operations
Robert A. Wrocklage
Senior Vice President – Chief Financial Officer
Sheryl L. Hopkins
Vice President – Human Resources
William R. A. Bergum
Vice President – General Counsel and Secretary
Board of directors at BADGER METER.
Research analysts who have asked questions during BADGER METER earnings calls.
Robert Mason
Robert W. Baird & Co.
9 questions for BMI
Scott Graham
Seaport Research Partners
9 questions for BMI
Andrew Krill
Deutsche Bank
8 questions for BMI
Jeffrey Reive
RBC Capital Markets
7 questions for BMI
Nathan Jones
Stifel, Nicolaus & Company, Incorporated
6 questions for BMI
Bobby Zolper
Raymond James
4 questions for BMI
Michael Fairbanks
J.P. Morgan Chase & Co.
4 questions for BMI
James
Jefferies
2 questions for BMI
Nathan Jones
Stifel
2 questions for BMI
Adam Farley
Stifel Financial Corp.
1 question for BMI
Tate Sullivan
Maxim Group
1 question for BMI
Recent press releases and 8-K filings for BMI.
- Badger Meter delivered strong financial results in Q4 2025, with total sales of $221 million, an 8% year-over-year increase, and consolidated EPS of $1.14, a 10% year-over-year increase. For the full year 2025, sales surpassed $900 million, growing 11%, with operating profit margins expanding to 20%.
- The company was awarded a significant Advanced Metering Infrastructure (AMI) project for the Puerto Rico Aqueduct and Sewer Authority (PRASA), covering 1.6 million service connections, with product shipments expected in 2026 and more meaningful revenue contributions in the second half of the year. This project is equivalent in scope and scale to 8 Orlandos.
- Badger Meter expects a lower growth rate in the first half of 2026 and a higher growth rate in the second half of 2026 due to project pacing, while maintaining its long-term outlook of high single-digit sales growth over the next five years.
- The SmartCover acquisition contributed $40 million in sales in 2025 and is on track for earnings accretion in 2026. Software revenue now exceeds $74 million, representing 8% of sales, and has grown at a 28% compounded annual growth rate over the past five years.
- The company increased its dividend for the 33rd consecutive year and opportunistically repurchased $15 million in shares during Q4 2025.
- Badger Meter achieved record financial results for Q4 and full year 2025, with Q4 2025 total sales of $221 million (an increase of 8% year-over-year) and consolidated EPS of $1.14 (a 10% year-over-year increase). Full year 2025 sales grew 11% to over $900 million.
- The company was awarded the PRASA AMI project, a significant global deployment, with product shipments and more meaningful revenue contributions expected in the second half of 2026. This project is not anticipated to be additive to the company's long-term high single-digit sales growth outlook.
- Badger Meter anticipates lower growth rates in the first half of 2026 and higher growth rates in the second half, attributed to project pacing and the commencement of awarded projects, including PRASA. The company maintains its conviction for high single-digit sales growth over a five-year horizon.
- Dan Weltzien assumed the role of Chief Financial Officer on January 1, 2026, and Bob Wrocklage was appointed Executive Vice President, North America Municipal Utility.
- Badger Meter delivered record sales, profitability, and cash flow for the full year 2025, with Q4 2025 total sales of $221 million, an 8% increase year-over-year, and full-year 2025 sales surpassing $900 million with 11% growth.
- Consolidated EPS for Q4 2025 was $1.14, representing a 10% year-over-year increase, and operating profit margins expanded 90 basis points to 20% for the full year 2025.
- The company announced the award of the PRASA AMI project, which will include E-Series ultrasonic meters, ORION cellular AMI radios, and BEACON SaaS across Puerto Rico, representing approximately 1.6 million service connections. Product shipments for this project are expected to begin in 2026, with more meaningful revenue contributions in the second half of 2026.
- Badger Meter anticipates lower growth in the first half of 2026 and higher growth in the second half of 2026 due to project pacing, while maintaining its long-term high single-digit sales growth outlook over a five-year forward period.
- Dan Weltzien became the new CFO on January 1, 2026, and Bob Wrocklage transitioned to Executive Vice President, North America Municipal Utility. In Q4 2025, the company repurchased $15 million in shares and increased its dividend for the 33rd consecutive year.
- Badger Meter reported Q4 2025 sales of $220.7 million, an 8% increase year-over-year, and full year 2025 sales of $916.7 million, up 11% year-over-year.
- Q4 2025 EPS grew 10% to $1.14, contributing to a 13% improvement in full year 2025 EPS.
- The company achieved a Q4 operating profit margin of 19.5%, an increase of 40 basis points, and a full year operating profit margin of 20.0%, up 90 basis points.
- Record free cash flow of $170 million was generated in FY 2025, marking a 19% increase year-over-year.
- The company secured the PRASA award, its largest Advanced Metering Infrastructure (AMI) project to date, with deployment anticipated to begin in 2H 2026.
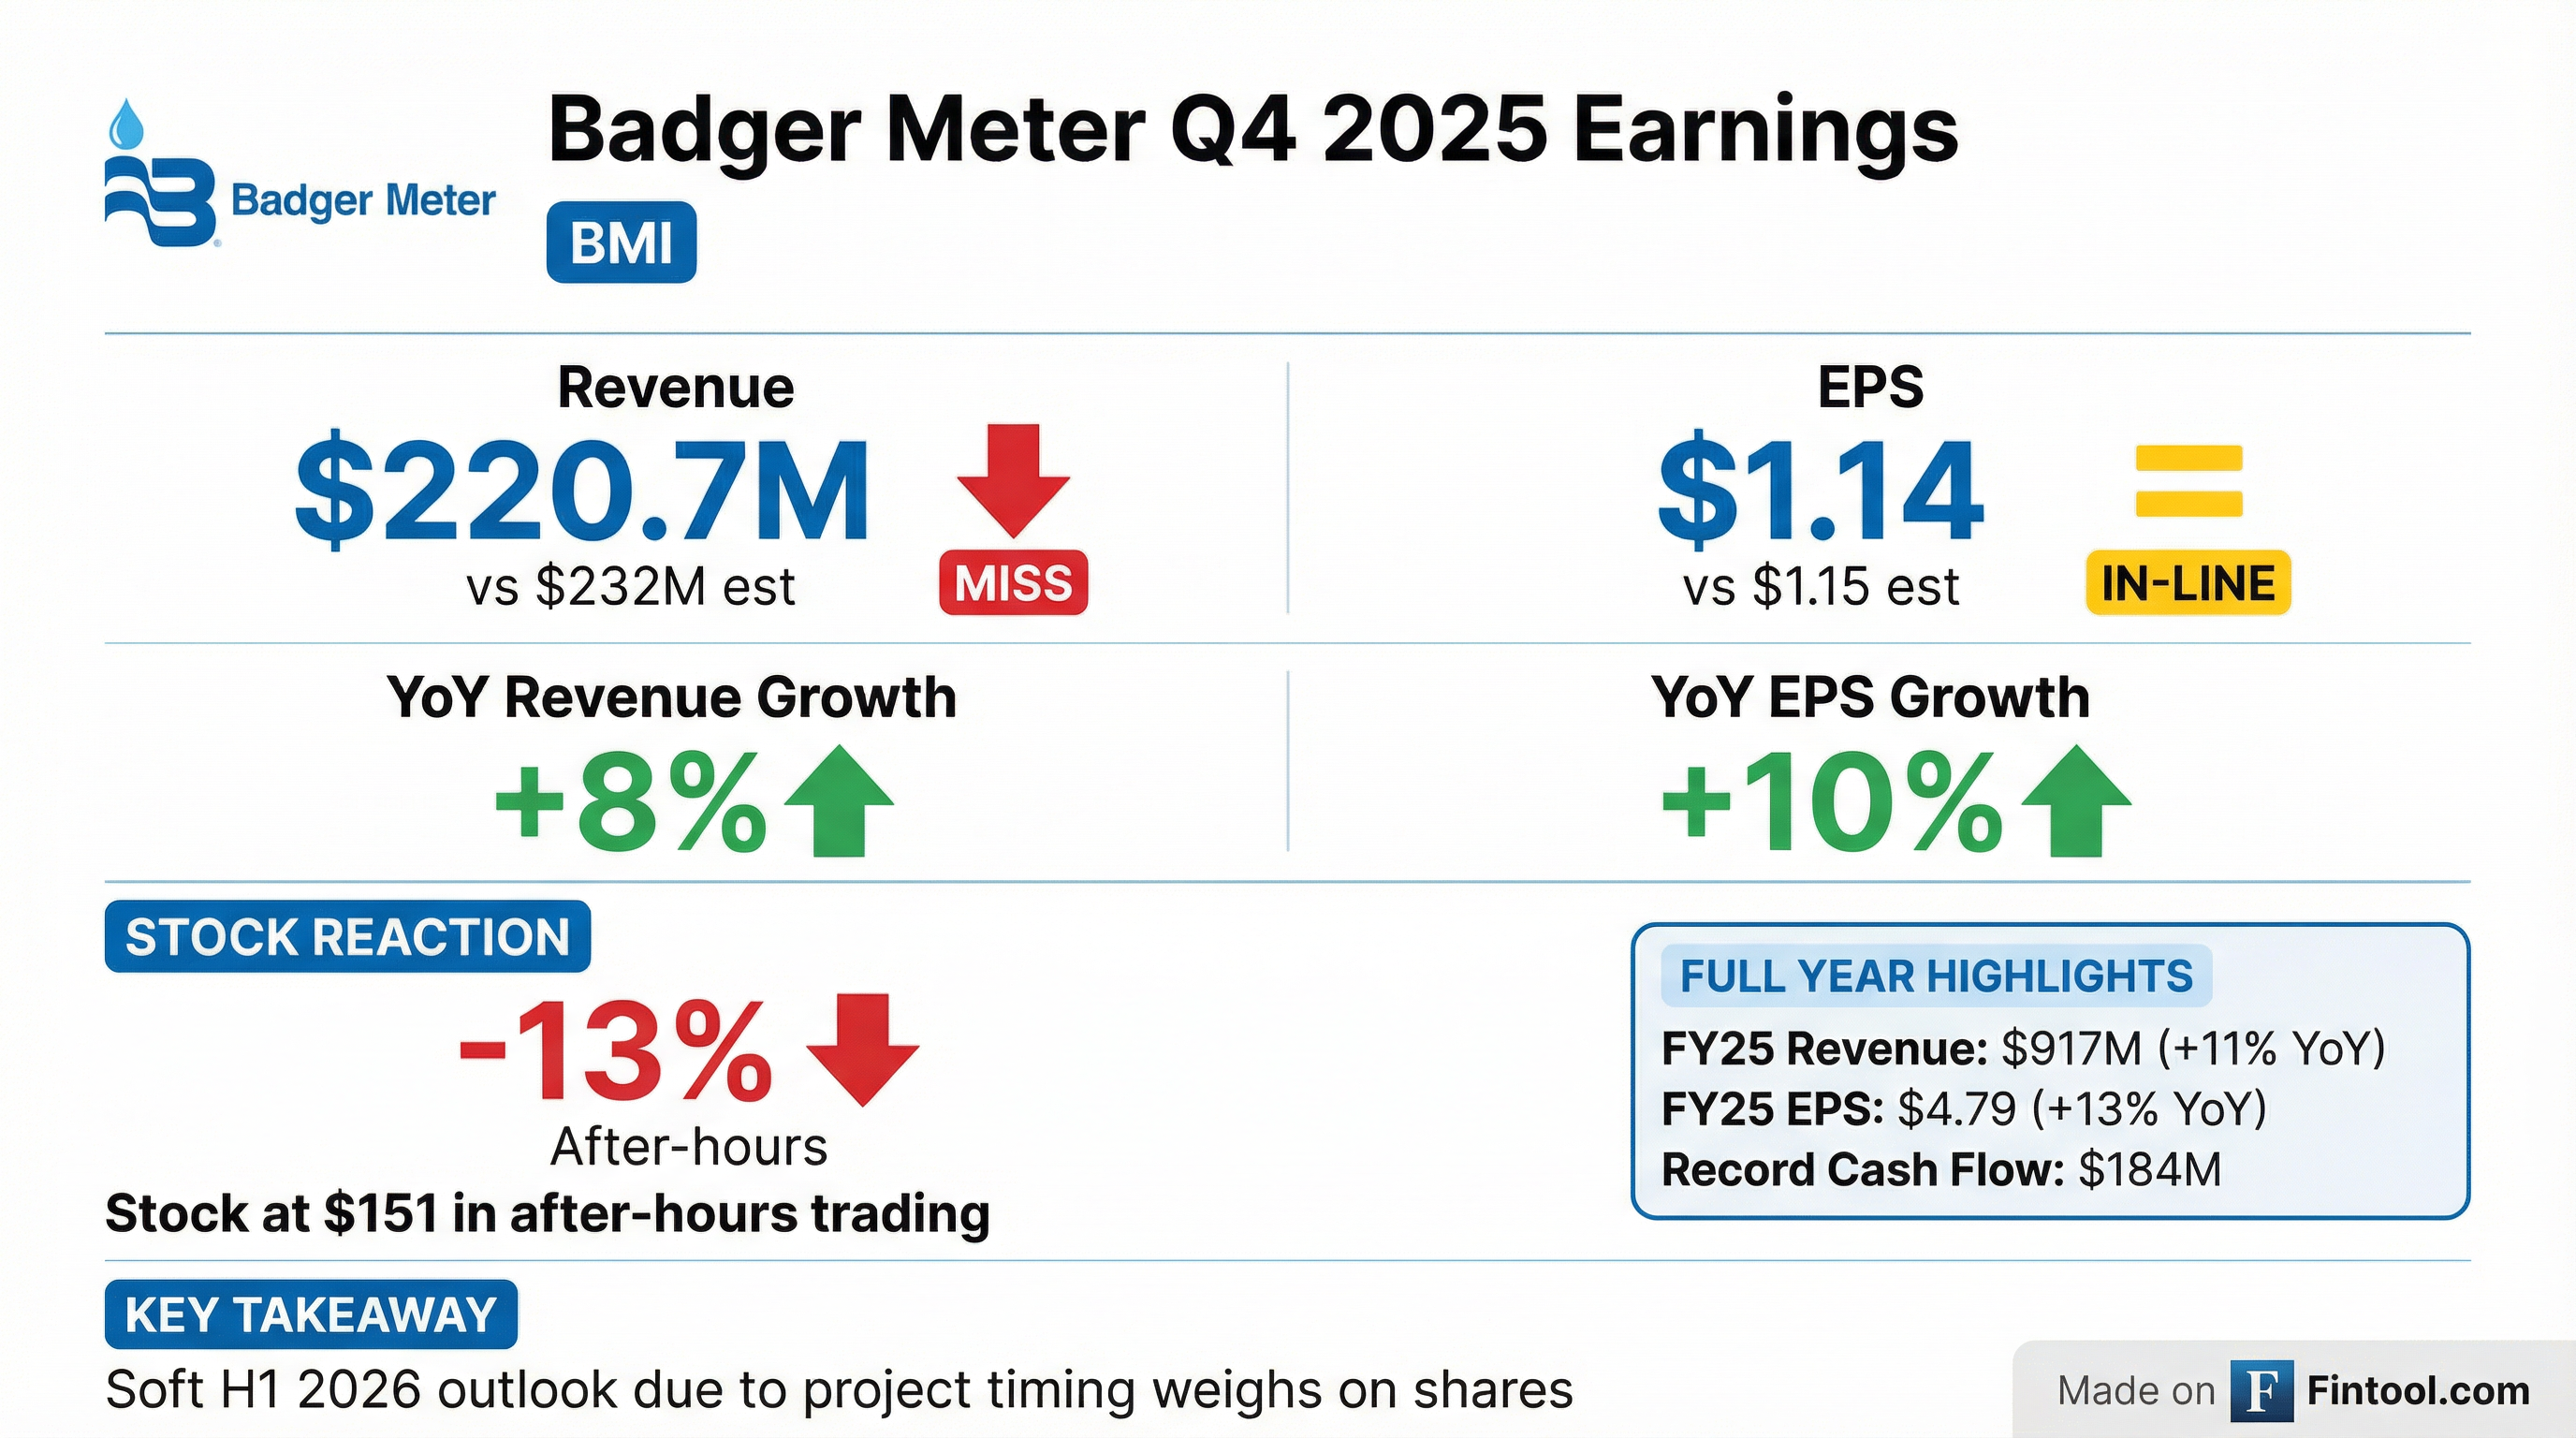
- Badger Meter reported Q4 2025 sales of approximately $220.7–$221 million, contributing to record fiscal 2025 revenue of $916.7 million and full-year EPS of $4.79. Despite the record annual revenue, the Q4 revenue missed Street estimates, causing shares to plunge and hit a new 52-week low in after-hours trading.
- Profitability materially improved in 2025, with gross margin expanding 180 basis points to 42.1% and operating margin rising to 19.5%, driven by higher-margin offerings and a 27% increase in SaaS revenue to roughly $74 million.
- The company entered 2026 with a debt-free balance sheet and strong liquidity, declared a $0.40 quarterly dividend, and guided for high single-digit revenue growth for 2026.
- Dan Weltzien became CFO on January 1, 2026.
- Badger Meter reported record full year 2025 sales of $916.7 million, an 11% increase over the prior year, and diluted EPS of $4.79, up 13% from 2024.
- For the fourth quarter of 2025, total sales reached $220.7 million, an 8% increase year-over-year, with diluted EPS growing 10% to $1.14.
- The company achieved record cash provided by operations of $183.7 million for the full year 2025.
- Key strategic developments in 2025 included the acquisition of SmartCover in early 2025, which contributed approximately $40.0 million in sales, and the selection of Badger Meter's advanced metering infrastructure (AMI) solutions for a large project with the Puerto Rico Aqueduct and Sewer Authority (PRASA).
- Badger Meter anticipates achieving high single-digit sales growth, year-over-year operating profit margin expansion, and free cash flow conversion exceeding 100% of earnings over a forward five-year time horizon.
- Badger Meter's Board of Directors declared a regular quarterly cash dividend of $0.40 per share, payable on December 5, 2025, to shareholders of record on November 21, 2025.
- The Board approved a new share repurchase authorization for up to $75 million of the company's common stock, valid through November 30, 2028.
- This new authorization replaces a prior one, under which the company purchased approximately $15 million (82,448 shares) during the fourth quarter of 2025.
- The company's CEO, Kenneth C. Bockhorst, highlighted the company's strong balance sheet and consistent dividend growth for 33 consecutive years, stating that the expanded repurchase authorization provides flexibility for opportunistic buybacks.
- Badger Meter (BMI) reported Q3 2025 total sales of $236 million, marking a 13% year-over-year increase, with base sales growing 8%.
- Operating earnings rose 13% to $46.1 million, resulting in an operating margin of 19.6%. Gross margins expanded 50 basis points to 40.7%, leading the company to raise its normalized gross margin range to 39% to 42%.
- Consolidated EPS increased 10% year-over-year to $1.19, and the company achieved record free cash flow of $48.2 million.
- The company expressed confidence in achieving an average top-line growth rate of high single digits organically over the next five years and highlighted its approximately $200 million net cash position.
- Badger Meter reported total sales of $235.7 million in Q3 2025, marking a 13.1% increase year-over-year, with Base sales of $224.5 million growing 8%.
- Earnings Per Share (EPS) for Q3 2025 reached $1.19 per share, reflecting a 10.2% growth compared to the prior year.
- The company's operating profit margin expanded by 10 basis points to 19.6%, and the Base operating profit margin saw a significant increase of 120 basis points to 20.7%.
- Record free cash flow of $48.2 million was generated in Q3 2025, an increase of 14.8% year-over-year.
- Badger Meter reported Q3 2025 sales of $236 million, representing a 13% increase year-over-year, with underlying growth driven by higher ultrasonic meter unit volumes, increased Beacon SaaS, and water quality product sales.
- Operating earnings grew 13% year-over-year to $46.1 million, and operating margins expanded to 19.6%.
- Gross margins expanded 50 basis points to 40.7%, leading the company to increase its normalized gross margin range from 38-40% to 39% to 42%.
- Diluted EPS increased 10% year-over-year to $1.19, and the company achieved record free cash flow of $48.2 million.
- The company remains confident in an average top-line organic growth rate of high single digits over the coming five-year time horizon, while noting that the fourth quarter typically has fewer operating days due to utility holiday schedules.
Quarterly earnings call transcripts for BADGER METER.
Ask Fintool AI Agent
Get instant answers from SEC filings, earnings calls & more