Earnings summaries and quarterly performance for CDW.
Executive leadership at CDW.
Christine Leahy
Chair, President and Chief Executive Officer
Albert Miralles
Chief Financial Officer and Executive Vice President, Enterprise Business Operations
Elizabeth Connelly
Chief Commercial Officer and Executive Vice President
Frederick Kulevich
Chief Legal Officer, Executive Vice President, Risk and Compliance, and Corporate Secretary
Katherine Sanderson
Chief Human Resources Officer and Executive Vice President, Coworker Success
Mukesh Kumar
Chief Services and Solutions Officer
Sona Chawla
Chief Growth and Innovation Officer and Executive Vice President
Board of directors at CDW.
Anthony Foxx
Director
David Nelms
Director
Donna Zarcone
Director
James Bell
Lead Independent Director
Joseph Swedish
Director
Kelly Grier
Director
Lynda Clarizio
Director
Marc Jones
Director
Sanjay Mehrotra
Director
Virginia Addicott
Director
Research analysts who have asked questions during CDW earnings calls.
Amit Daryanani
Evercore
8 questions for CDW
Keith Housum
Northcoast Research
8 questions for CDW
David Vogt
UBS Group AG
7 questions for CDW
Erik Woodring
Morgan Stanley
7 questions for CDW
Samik Chatterjee
JPMorgan Chase & Co.
6 questions for CDW
Ruplu Bhattacharya
Bank of America
5 questions for CDW
Harry Read
Redburn Atlantic
4 questions for CDW
Adam Tindle
Raymond James
3 questions for CDW
Adam Tindall
Raymond James
2 questions for CDW
Asiya Merchant
Citigroup Global Markets Inc.
2 questions for CDW
Dong Wang
Nomura Instinet
1 question for CDW
George Wang
Barclays PLC
1 question for CDW
Harry Reid
Redburn
1 question for CDW
Matthew Sheerin
Stifel
1 question for CDW
Maya Neuman
Morgan Stanley
1 question for CDW
Recent press releases and 8-K filings for CDW.
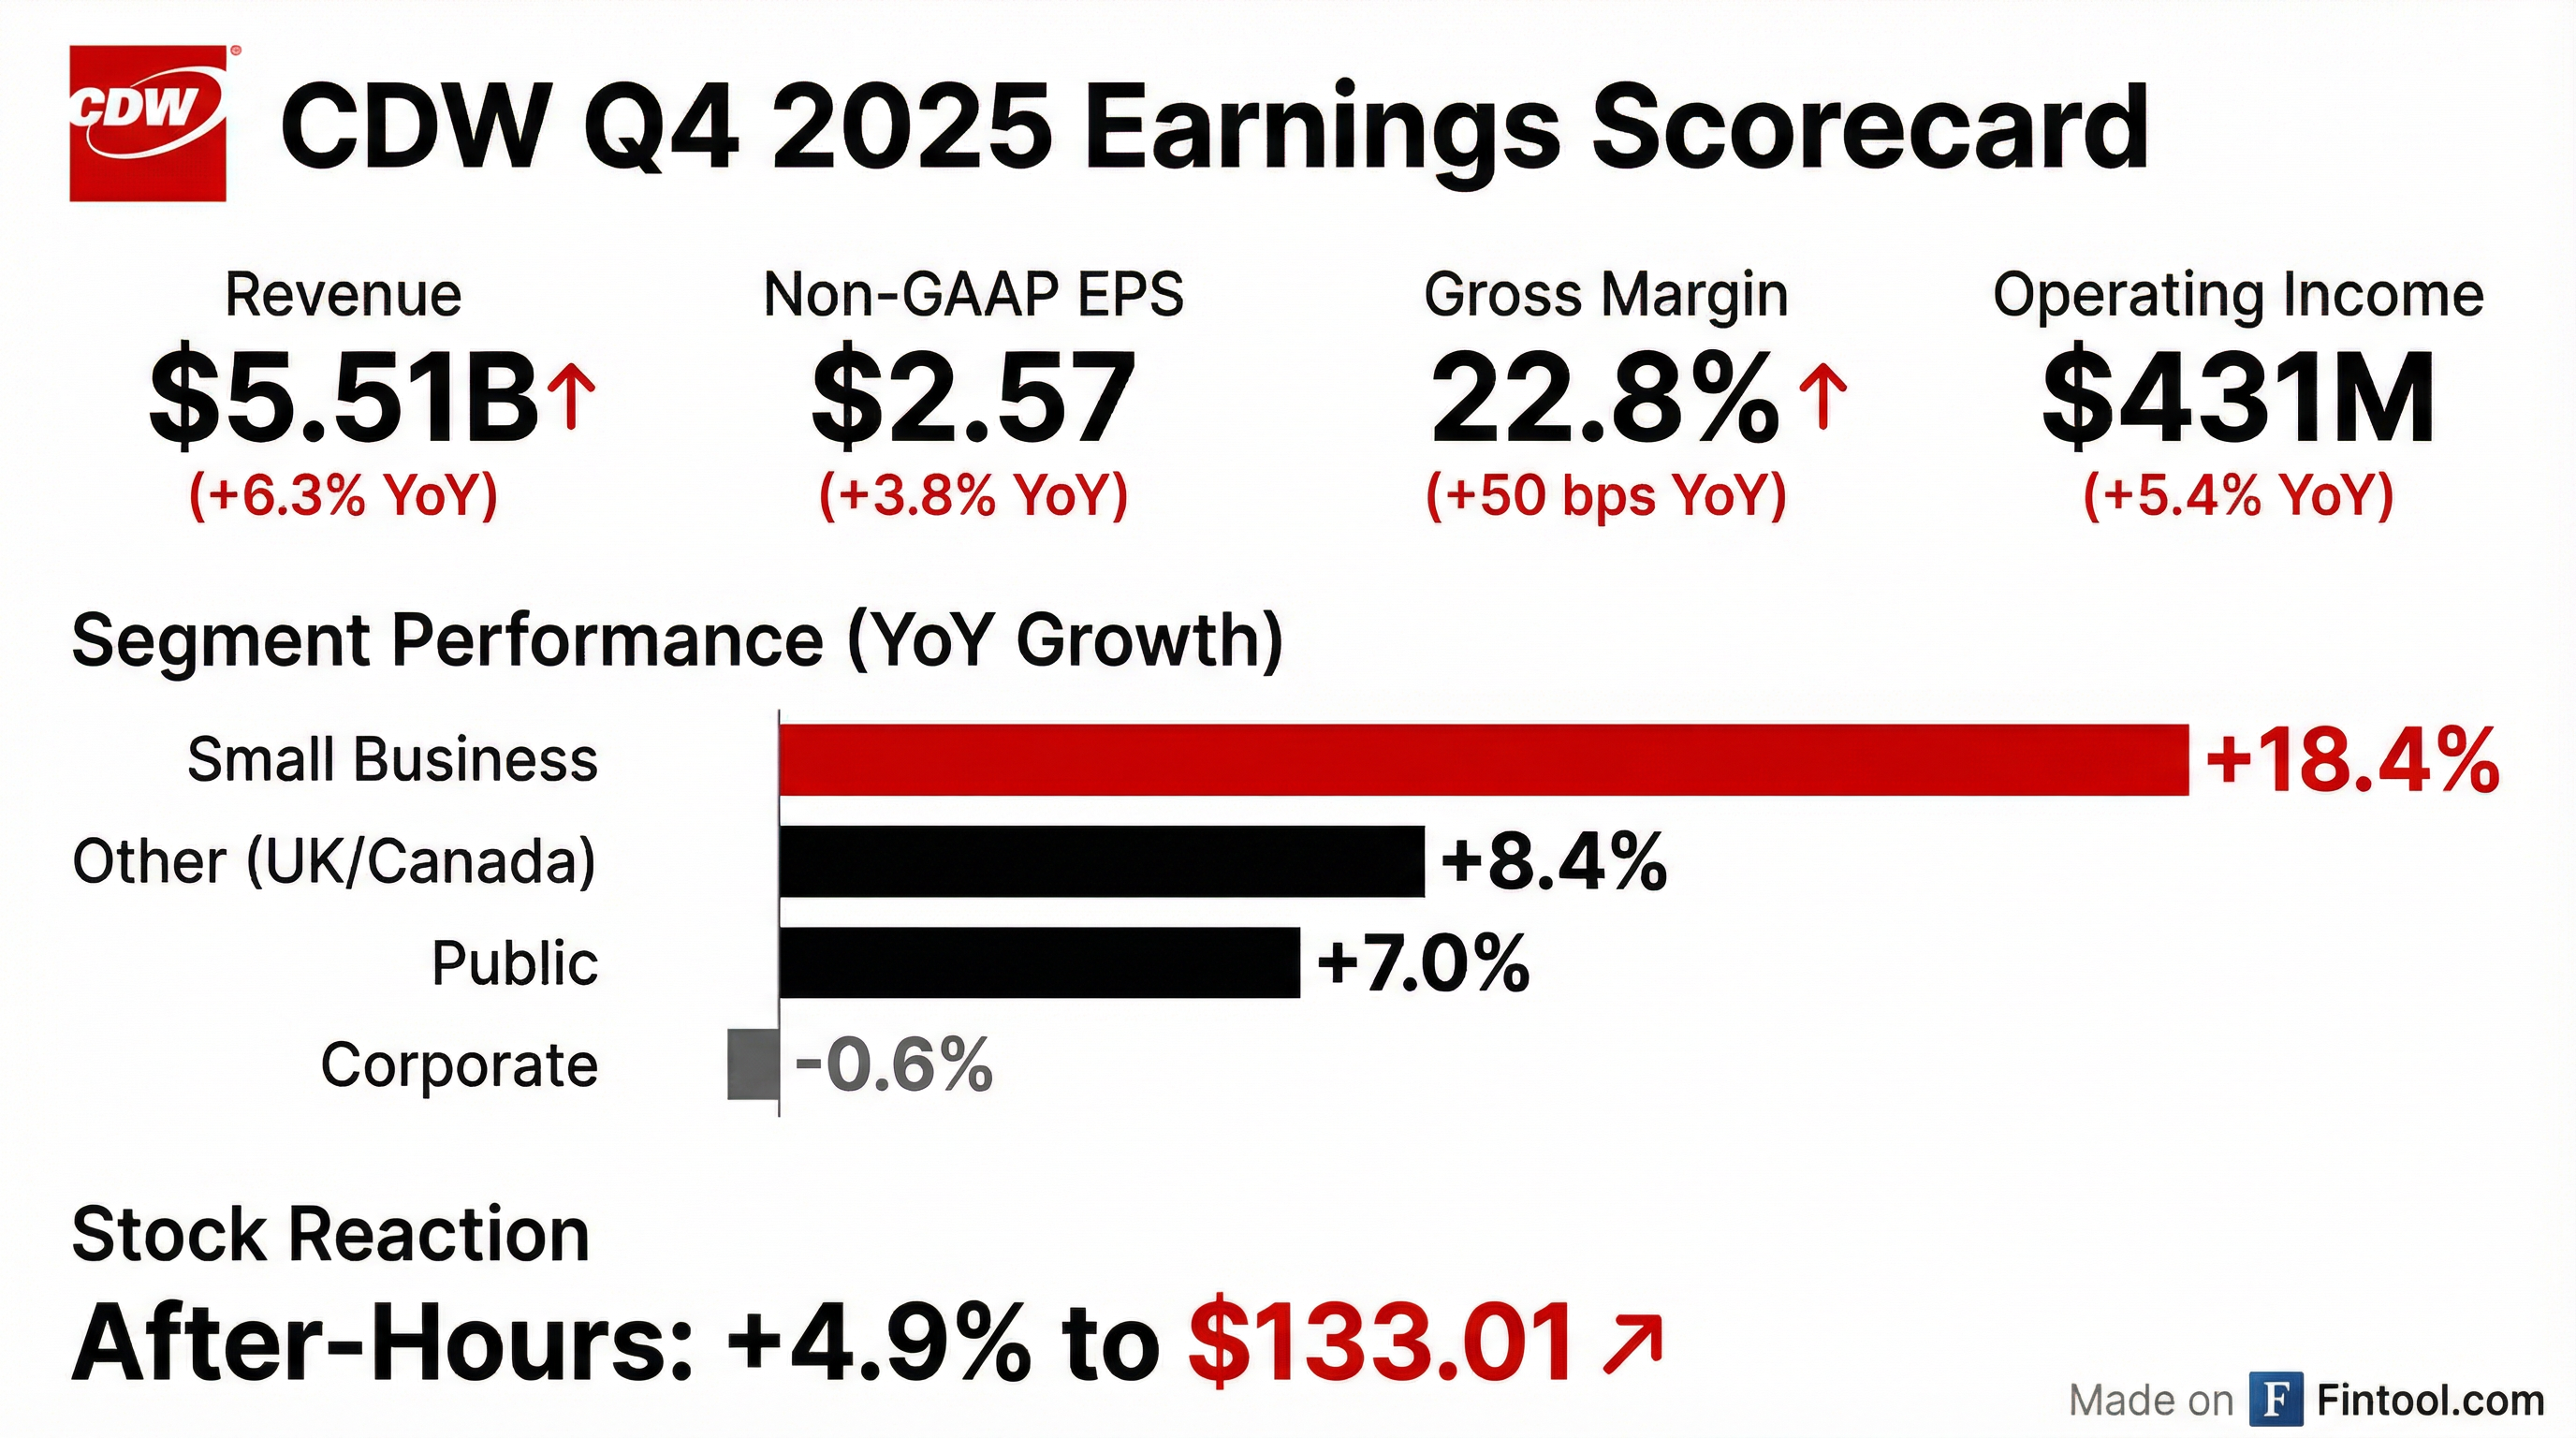
- Net sales of $5.51 billion, up 6.3% YoY (ADS +4.6%, constant currency +4.3%).
- Non-GAAP operating income of $502 million, up 0.6%, and non-GAAP EPS of $2.57, up 3.8%.
- Full-year free cash flow of $1.09 billion, adjusted FCF of $1.09 billion, with ~90% of adjusted FCF returned to shareholders and $680 million remaining on the buyback authorization.
- Raised annual dividend by 1% to $2.52/share, target payout ~25% of non-GAAP net income; net leverage at 2.4x at year-end.
- 2026 outlook: target U.S. IT spend growth plus 200–300 bps premium, low single-digit gross profit growth, and mid single-digit non-GAAP EPS growth.
- CDW delivered $5.5 billion in net sales (up 5%), $1.25 billion in gross profit (up 9%), $503 million in non-GAAP operating income (up 1%), and $2.57 non-GAAP EPS (up 4%) in Q4 2025.
- For full-year 2025, net sales exceeded $22 billion (up 7%), gross profit neared $5 billion (up 6%), non-GAAP operating income was almost $2 billion (up 3%), and non-GAAP EPS hit a record $10.02 (up 5%); adjusted free cash flow was $1.1 billion, with nearly $1 billion returned to shareholders.
- Growth was led by higher-margin offerings: cloud and professional and managed services drove strong double-digit gross profit gains, software revenue rose 12%, security and services increased mid-single digits, and hardware grew 2% in the quarter.
- Looking to 2026, CDW targets low-single-digit gross profit growth, mid-single-digit non-GAAP EPS growth, and plans to return 50–75% of adjusted free cash flow to shareholders; the annual dividend was increased ~1% to $2.52, and net leverage stood at 2.4× at year-end.
- Q4 2025 gross profit was $1.3 billion, up 8.6% year-over-year, and gross margin was 22.8%, a 50 bp increase from Q4 2024.
- Performance included a $50 million pull-forward in net sales driven by memory-related price increases and supply-chain concerns.
- The annual dividend was raised by 1% to $2.52, targeting a 25% payout ratio, and net leverage ended the quarter at 2.4×.
- For FY 2026, CDW expects low-single-digit gross profit growth, mid-single-digit non-GAAP EPS growth, and to outperform the IT market by 200–300 bps.
- For Q4, net sales were $5.5 billion (up 5%), gross profit $1.25 billion (up 9%), non-GAAP operating income $503 million (up 1%), and EPS $2.57 (up 4%).
- Full-year 2025 net sales exceeded $22 billion (up 7%), gross profit nearly $5 billion (up 6%), non-GAAP operating income ~$2 billion (up 3%), and record EPS $10.02 (up 5%).
- High-growth categories drove performance: cloud, software, and professional managed services saw strong double-digit growth and accounted for about half of Q4 gross profit expansion, while security and hardware also grew.
- Generated $1.1 billion in adjusted free cash flow; returned nearly $1 billion to shareholders via dividends and share repurchases, raised the annual dividend ~1% to $2.52, and completed a tuck-in acquisition of Lexicon Tech Solutions assets.
- For 2026, expects the U.S. IT market to grow low single digits with 200–300 bps outperformance, full-year gross profit and non-GAAP EPS to grow in low/mid-single digits, and Q1 gross profit and EPS both mid-single-digit higher year-over-year.
- CDW’s Q4 net sales grew 6.3% year-over-year to $5.511 billion; full-year 2025 net sales rose 6.8% to $22.424 billion.
- Q4 GAAP net income was $279.5 million (+5.8%) with diluted EPS of $2.14 (+8.8%); FY 2025 GAAP net income was $1,066.6 million with diluted EPS of $8.08.
- The Board declared a $0.63 per share quarterly cash dividend, payable March 10, 2026 to holders of record on February 25, 2026.
- $0.630 per share dividend declared, payable March 10, 2026, to shareholders of record as of February 25, 2026.
- Dividend has grown fifteen-fold since the June 2013 IPO, marking 12 consecutive years of increases.
- CDW has returned approximately $8.1 billion to stockholders through dividends and share repurchases.
- $685 million remains available under the current share repurchase program as of December 31, 2025.
- Fourth quarter net sales were $5,511 million (up 6.3% YoY) and full-year net sales were $22,424 million (up 6.8% YoY)
- Q4 net income was $279.5 million (up 5.8%) with diluted EPS of $2.14 (up 8.8%); full-year net income was $1,066.6 million (down 1.0%) with EPS of $8.08 (up 1.3%)
- Board declared a quarterly cash dividend of $0.630 per share, payable March 10, 2026 (record Feb 25, 2026)
- Generated strong cash flow enabling $982 million returned to shareholders via dividends and share repurchases in 2025
- For 2026, aims to exceed U.S. IT market growth by 200–300 basis points, leveraging AI solutions and a diversified customer base
- Ivo secured $55M in a Series B funding round led by Blackbird, with participation from Costanoa Ventures, Uncork Capital, Fika Ventures, GD1, and Icehouse Ventures.
- Since its last funding, Ivo’s annual recurring revenue grew by 500%, total customers increased by 134%, and Fortune 500 adoption rose by 250%.
- Ivo’s AI-powered contract intelligence platform, including Ivo Review and Ivo Intelligence, automates workflows and helps customers save 75% of manual review time while unlocking insights across agreements.
- The new capital will support product development and scaling across Ivo’s enterprise client base, which includes Uber, Shopify, Atlassian, Reddit, Canva, and CDW.
- On December 17, 2025, CDW LLC closed a new five-year senior unsecured credit facility totaling $2,884.5 million, including a $634.5 million term loan and a $2,250 million revolving facility to refinance prior debt and support general corporate purposes.
- The facility bears interest at either an alternate base rate + 0.125% or SOFR + 1.125% for USD borrowings, includes a 4.00:1.00 maximum leverage covenant (expandable to 4.50:1.00 post-qualified acquisition), and matures on the fifth anniversary of the effective date.
- On December 19, 2025, CDW extended its Compensation Protection Agreements with four Named Executive Officers through January 1, 2029, incorporating updated severance metrics and target bonus calculations.
- Net sales rose 4% to $5.74 billion in Q3 2025, driven by strong demand for IT solutions including hardware, software, and services.
- Net income was $291 million, down year-over-year due to higher selling and administrative expenses, resulting in an 8% decline in operating income.
- Basic EPS decreased to $2.22 (diluted EPS $2.21) from $2.37 (diluted $2.34) a year ago.
- Quarterly dividend increased 1% to $0.63 per share, payable December 10, 2025, to shareholders of record November 25, 2025.
- Operating margin fell to 7.7% from 8.7%, while free cash flow margin held steady at 5.2%.
Quarterly earnings call transcripts for CDW.
Ask Fintool AI Agent
Get instant answers from SEC filings, earnings calls & more