Earnings summaries and quarterly performance for MMC.
Executive leadership at MMC.
John Doyle
President and Chief Executive Officer
Carmen Fernandez
Chief People Officer
Dean Klisura
President and Chief Executive Officer, Guy Carpenter
John Jones
Chief Marketing and Communications Officer
Katherine Brennan
General Counsel
Mark McGivney
Chief Financial Officer
Martin South
President and Chief Executive Officer, Marsh
Nicholas Studer
Chief Executive Officer, Oliver Wyman Group
Patrick Tomlinson
President and Chief Executive Officer, Mercer
Paul Beswick
Chief Information & Operations Officer
Board of directors at MMC.
Anthony Anderson
Director
Bruce Broussard
Director
Deborah Hopkins
Director
H. Edward Hanway
Independent Chair of the Board
Jan Siegmund
Director
Jane Lute
Director
Judith Hartmann
Director
Lloyd Yates
Director
Morton Schapiro
Director
Steven Mills
Director
Tamara Ingram
Director
Research analysts who have asked questions during MMC earnings calls.
Alex Scott
Barclays PLC
6 questions for MMC
David Motemaden
Evercore ISI
6 questions for MMC
C. Gregory Peters
Raymond James
5 questions for MMC
Elyse Greenspan
Wells Fargo
5 questions for MMC
Michael Zaremski
BMO Capital Markets
5 questions for MMC
Jimmy Bhullar
JPMorgan Chase & Co.
4 questions for MMC
Meyer Shields
Keefe, Bruyette & Woods
4 questions for MMC
Brian Meredith
UBS
3 questions for MMC
Jamminder Bhullar
JPMorgan Chase & Co.
3 questions for MMC
Charles Peters
Raymond James
2 questions for MMC
Mike Zaremski
BMO Capital Markets
2 questions for MMC
Rob Cox
Goldman Sachs
2 questions for MMC
Robert Cox
The Goldman Sachs Group, Inc.
2 questions for MMC
Andrew Kligerman
TD Cowen
1 question for MMC
Grace Carter
BofA Securities
1 question for MMC
Jon Paul Newsome
Piper Sandler & Co.
1 question for MMC
Recent press releases and 8-K filings for MMC.
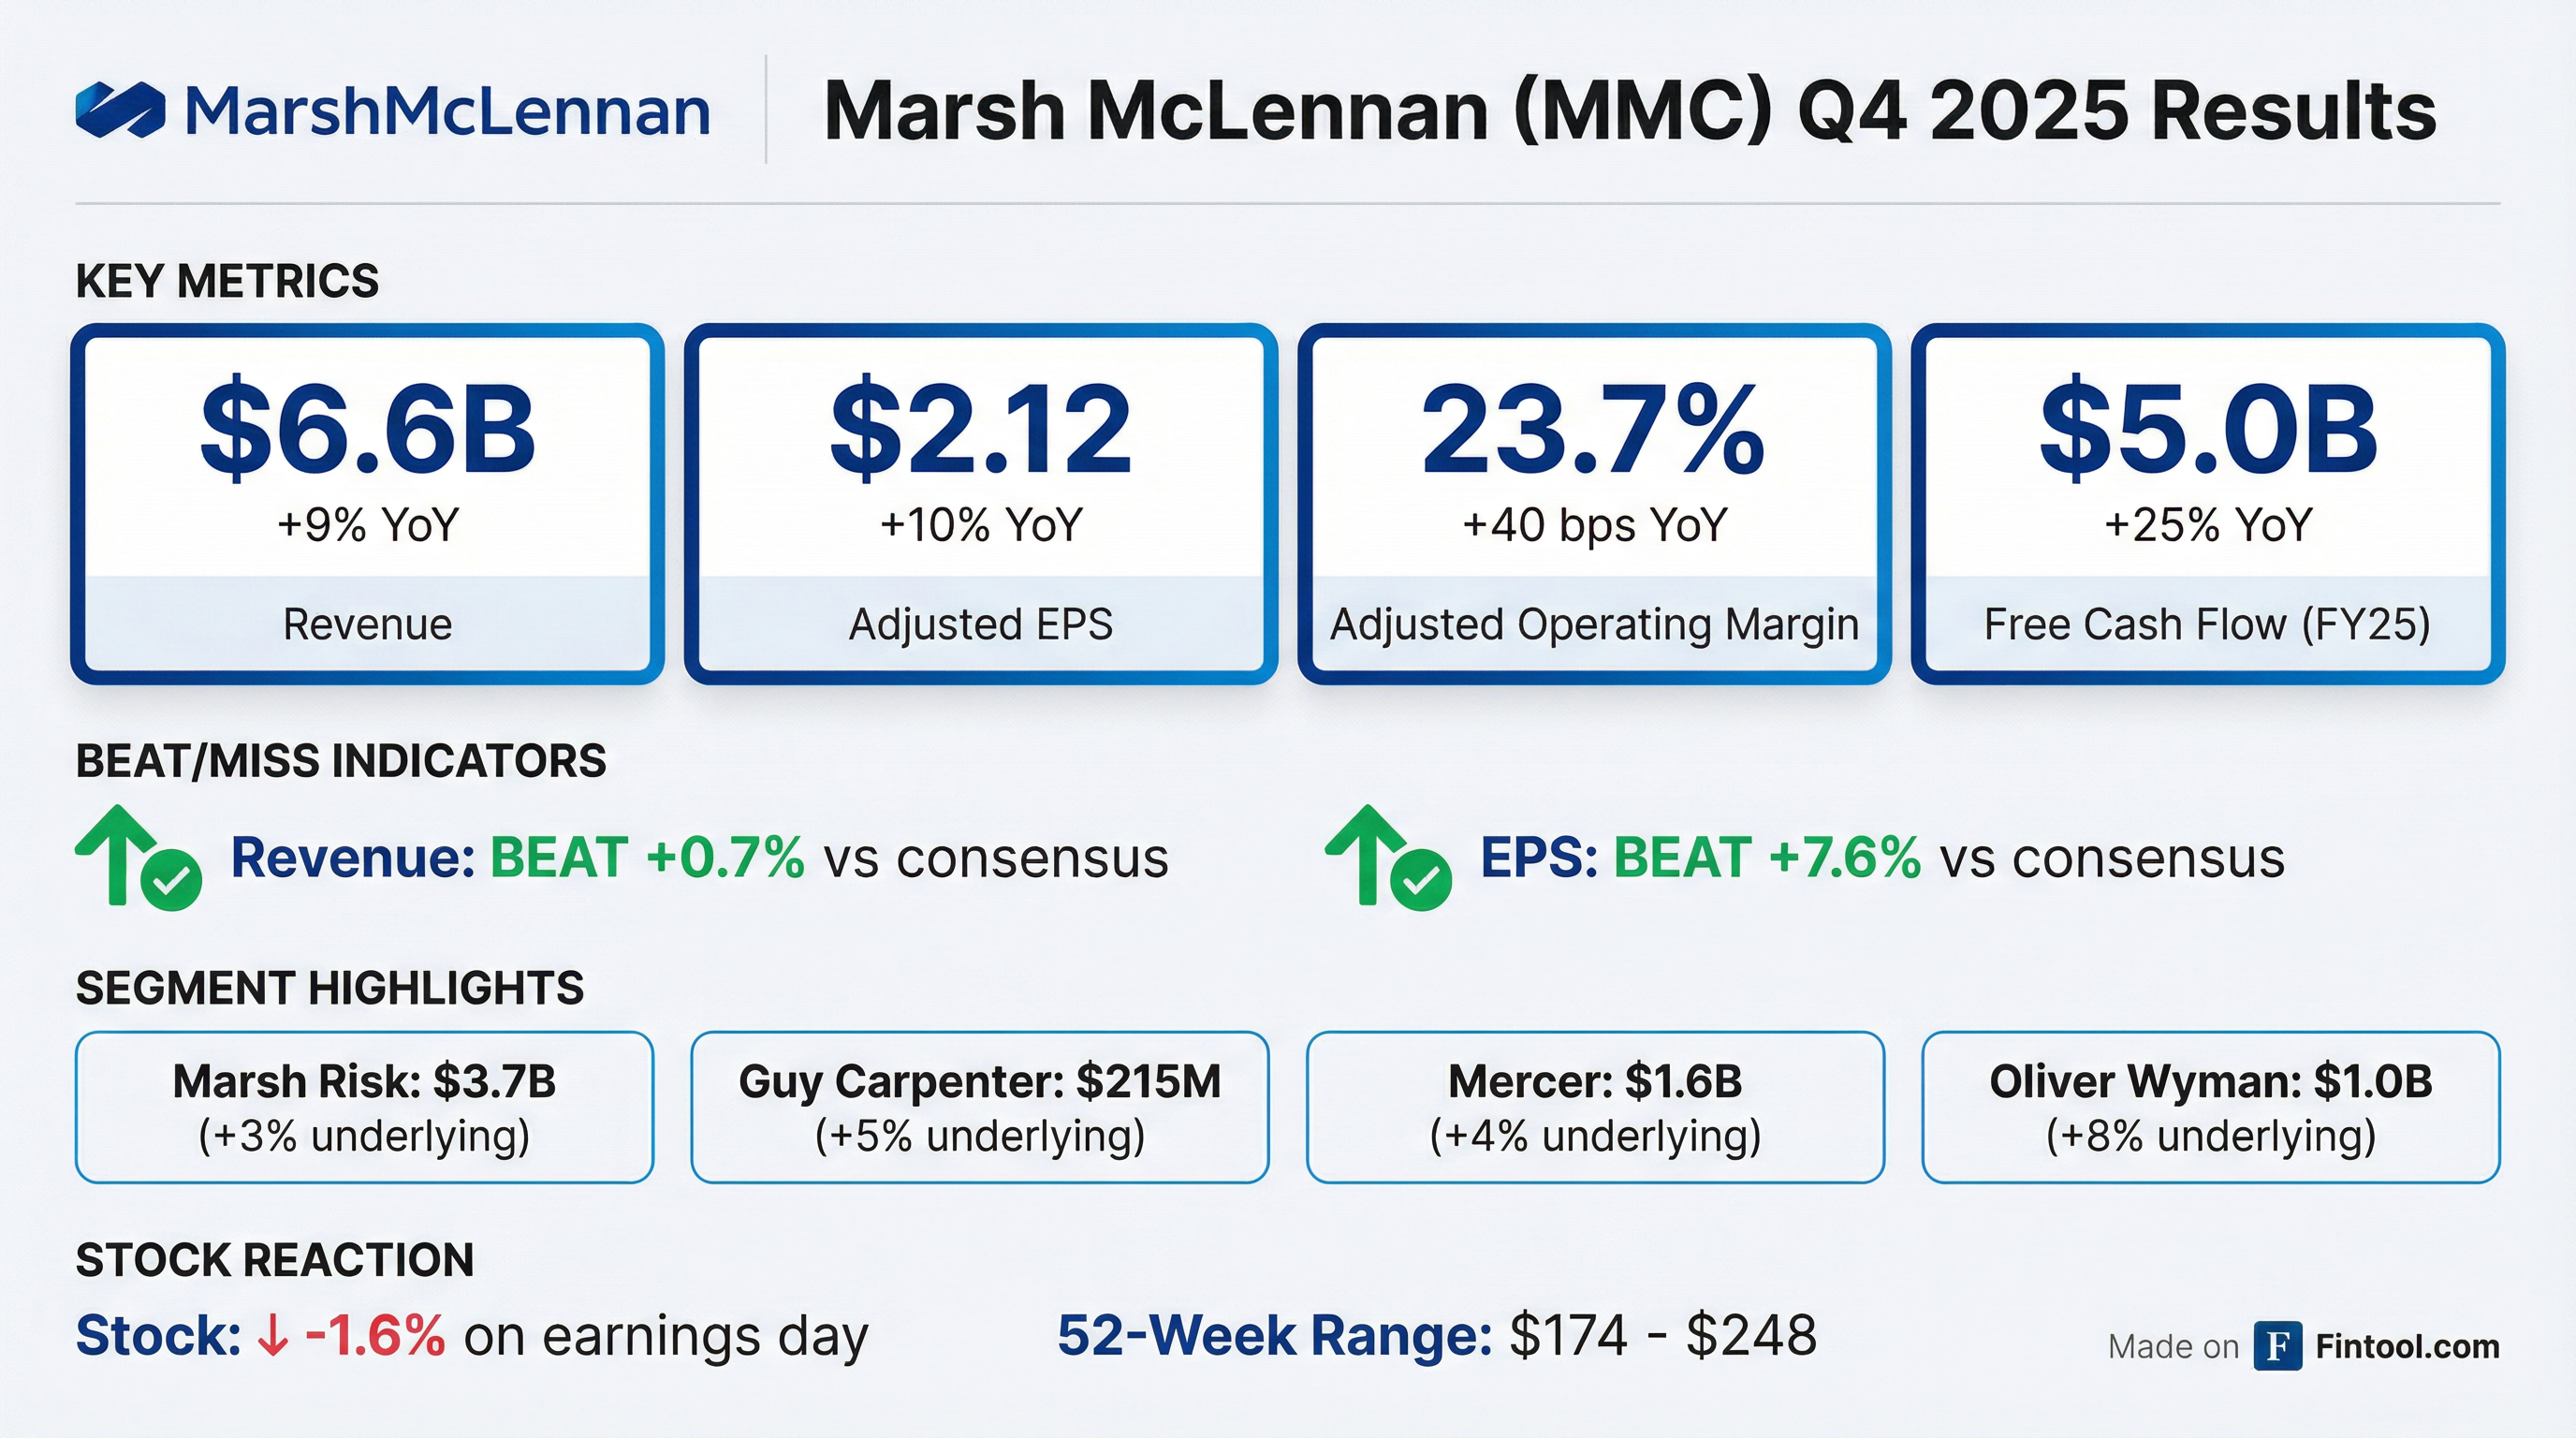
- Q4 consolidated revenue was $6.6 billion, up 9% YoY (4% underlying); adjusted operating income was $1.6 billion (+12%) and adjusted EPS was $2.12, a 10% increase
- In 2025, free cash flow reached $5 billion, enabling $850 million of acquisitions, a 10% dividend hike, and a record $2 billion in share repurchases
- For 2026, management expects underlying revenue growth similar to 2025 levels, with further margin expansion and solid adjusted EPS growth
- Initiated the Thrive program to enhance efficiency and invest in AI-driven solutions, and rebranded under the Marsh name with ticker MRSH
- Q4 consolidated revenue increased 9% to $6.6 B (underlying +4%); adjusted operating income rose 12% to $1.6 B; adjusted EPS was $2.12 (+10%). For FY 2025, total revenue was $27 B (+10%), adjusted operating income $7.3 B (+11%), and adjusted EPS $9.75 (+9%).
- By segment, Risk & Insurance Services Q4 revenue was $4.0 B (+9% / +2% underlying) and consulting revenue $2.6 B (+8% / +5% underlying). Marsh Risk underlying growth was 3%, and Mercer’s assets under management reached $692 B.
- Strong cash generation: 2025 free cash flow of $5.0 B; Q4 ending cash balance of $2.7 B; Q4 share repurchases of $1.0 B (full-year repurchases $2.0 B); targeting $5 B of capital deployment in 2026.
- Outlook for 2026: expects similar underlying revenue growth to 2025 (~4%), continued margin expansion, and solid adjusted EPS growth.
- Strong Q4 performance: Consolidated revenue of $6.6 B (+9% YoY; +4% underlying) and adjusted operating income of $1.6 B (+12%); adjusted EPS of $2.12 (+10%).
- Full-year results: 2025 revenue rose 10% to $27 B (4% underlying), adjusted operating income up 11% to $7.3 B, and adjusted EPS up 9% to $9.75.
- Robust capital generation: Free cash flow grew 25% to $5 B; deployed ~$850 M in acquisitions, raised quarterly dividend 10%, and repurchased $2 B of shares.
- Segment growth: Q4 underlying revenue: Risk & Insurance +2% (Marsh Risk +3%), Consulting +5%; Mercer AUM reached $692 B (+12% YoY).
- 2026 outlook: Projected underlying revenue growth similar to 2025, further margin expansion, solid EPS growth, and planned capital deployment of $5 B.
- Mercer UK’s Workplace Savings master trusts will make an initial £350 million commitment to the new Schroders Mercer Private Assets Growth Long-Term Asset Fund (LTAF) in its first year.
- The LTAF is slated to launch in Q1 2026, pending FCA approval, and will target private equity and infrastructure equity while holding listed equities to meet liquidity needs.
- The vehicle underpins trustee goals to allocate at least 10% of default pension assets to private markets by 2030, with a minimum 5% invested in the UK.
- Produced first gold at the Bayan Khundii mine on September 14 and expects to reach 85,000 oz/year nameplate capacity by end-2025.
- EM sold 342 oz gold at US$3,805/oz and 96 oz silver at US$44/oz during Q3 2025.
- Announced a 22% increase in Measured & Indicated Mo resources to 333 Mlbs and a 90% increase in Inferred Mo to 300 Mlbs for Zuun Mod, plus similar gains in Cu resources.
- Entered an option to acquire up to 80% of the Tereg Uul copper-gold prospect and completed a 6:1 share consolidation on September 2.
- Reported a net loss of $2.75 M in Q3 2025 versus $1.69 M in Q3 2024, driven by higher exploration and administrative expenses.
- Revenues of $2.18 billion and net income of $42 million ($0.11 per share) in Q3 2025
- Bookings of $951 million with a book-to-bill ratio of 141%
- Operating cash flow of $352 million and free cash flow of $245 million
- Appointed Jose Bayardo, President & COO, to the Board, increasing its size by one
- Q4 2025 guidance: revenues down 5–7% YoY and Adjusted EBITDA of $230 million–$260 million
- Shares dropped over 8% to 52-week lows despite Q3 revenue growth of 11.5% and adjusted earnings above consensus.
- The decline occurred amid broad market weakness (S&P 500 down 0.63%, Dow down 0.65%) and marked MMC’s second consecutive day of losses.
- Strategic initiatives include the Thrive program (targeting $400 million in savings over three years with $500 million in related charges), a rebrand to “Marsh,” and deployment of AI tools Len AI and ADA.
- Persistent headwinds stem from declining P&C insurance pricing, intense competition in insurance/reinsurance, and competitor hiring practice concerns.
- Q3 revenue of $6.4 billion (+11% YoY; +4% underlying) and adjusted EPS of $1.85 (+11%); adjusted operating margin expanded 30 bps to 22.7%.
- Announced rebrand to Marsh (ticker MRSH) effective January and launched Business and Client Services (BCS) under the Thrive program, targeting $400 million in savings (with ~$500 million of charges) over three years.
- Underlying Q3 segment growth: Marsh +4%, Guy Carpenter +5%, Mercer +3%, Oliver Wyman +8%.
- Returned capital via $400 million of share repurchases in Q3; full-year 2025 capital deployment expected at $4.5 billion across dividends, acquisitions, and buybacks.
- Consolidated revenue rose 11% YoY to $6.4 billion; adjusted operating income grew 13% to $1.4 billion, and adjusted EPS increased 11% to $1.85
- Risk & Insurance Services revenue climbed 13% to $3.9 billion, while the consulting segment expanded through acquisitions of Mercer and Oliver Wyman
- The company will consolidate its four businesses under the Marsh brand by 2027 to strengthen its global market position
- Consolidated revenue was $6.4 billion, up 11% on a GAAP basis and 4% on an underlying basis year-over-year.
- GAAP operating income rose 6% to $1.2 billion, while adjusted operating income increased 13% to $1.4 billion.
- GAAP EPS of $1.51, with adjusted EPS up 11% to $1.85.
- Repurchased approximately 1.9 million shares for $400 million in the quarter.
- Announced rebranding to “Marsh” effective January 2026 and NYSE ticker change to MRSH.
Quarterly earnings call transcripts for MMC.
Ask Fintool AI Agent
Get instant answers from SEC filings, earnings calls & more