Earnings summaries and quarterly performance for NAPCO SECURITY TECHNOLOGIES.
Executive leadership at NAPCO SECURITY TECHNOLOGIES.
Richard Soloway
Chairman and Chief Executive Officer
Andrew Vuono
Chief Financial Officer
Kevin Buchel
President, Chief Operating Officer and Treasurer
Michael Carrieri
Executive Vice President of Engineering and Chief Technology Officer
Stephen Spinelli
Senior Vice President of Sales
Board of directors at NAPCO SECURITY TECHNOLOGIES.
Research analysts who have asked questions during NAPCO SECURITY TECHNOLOGIES earnings calls.
Jeremy Hamblin
Craig-Hallum Capital Group LLC
7 questions for NSSC
Lance Vitanza
TD Cowen
6 questions for NSSC
James Ricchiuti
Needham & Company, LLC
5 questions for NSSC
Matt Summerville
D.A. Davidson & Co.
5 questions for NSSC
Jaeson Schmidt
Lake Street Capital Markets
3 questions for NSSC
Peter Costa
Mizuho Financial Group
3 questions for NSSC
Jim Ricchiuti
Needham & Company
2 questions for NSSC
Rajiv Sharma
B. Riley Securities
2 questions for NSSC
Jason Smith
Lake Street Capital Markets
1 question for NSSC
Recent press releases and 8-K filings for NSSC.
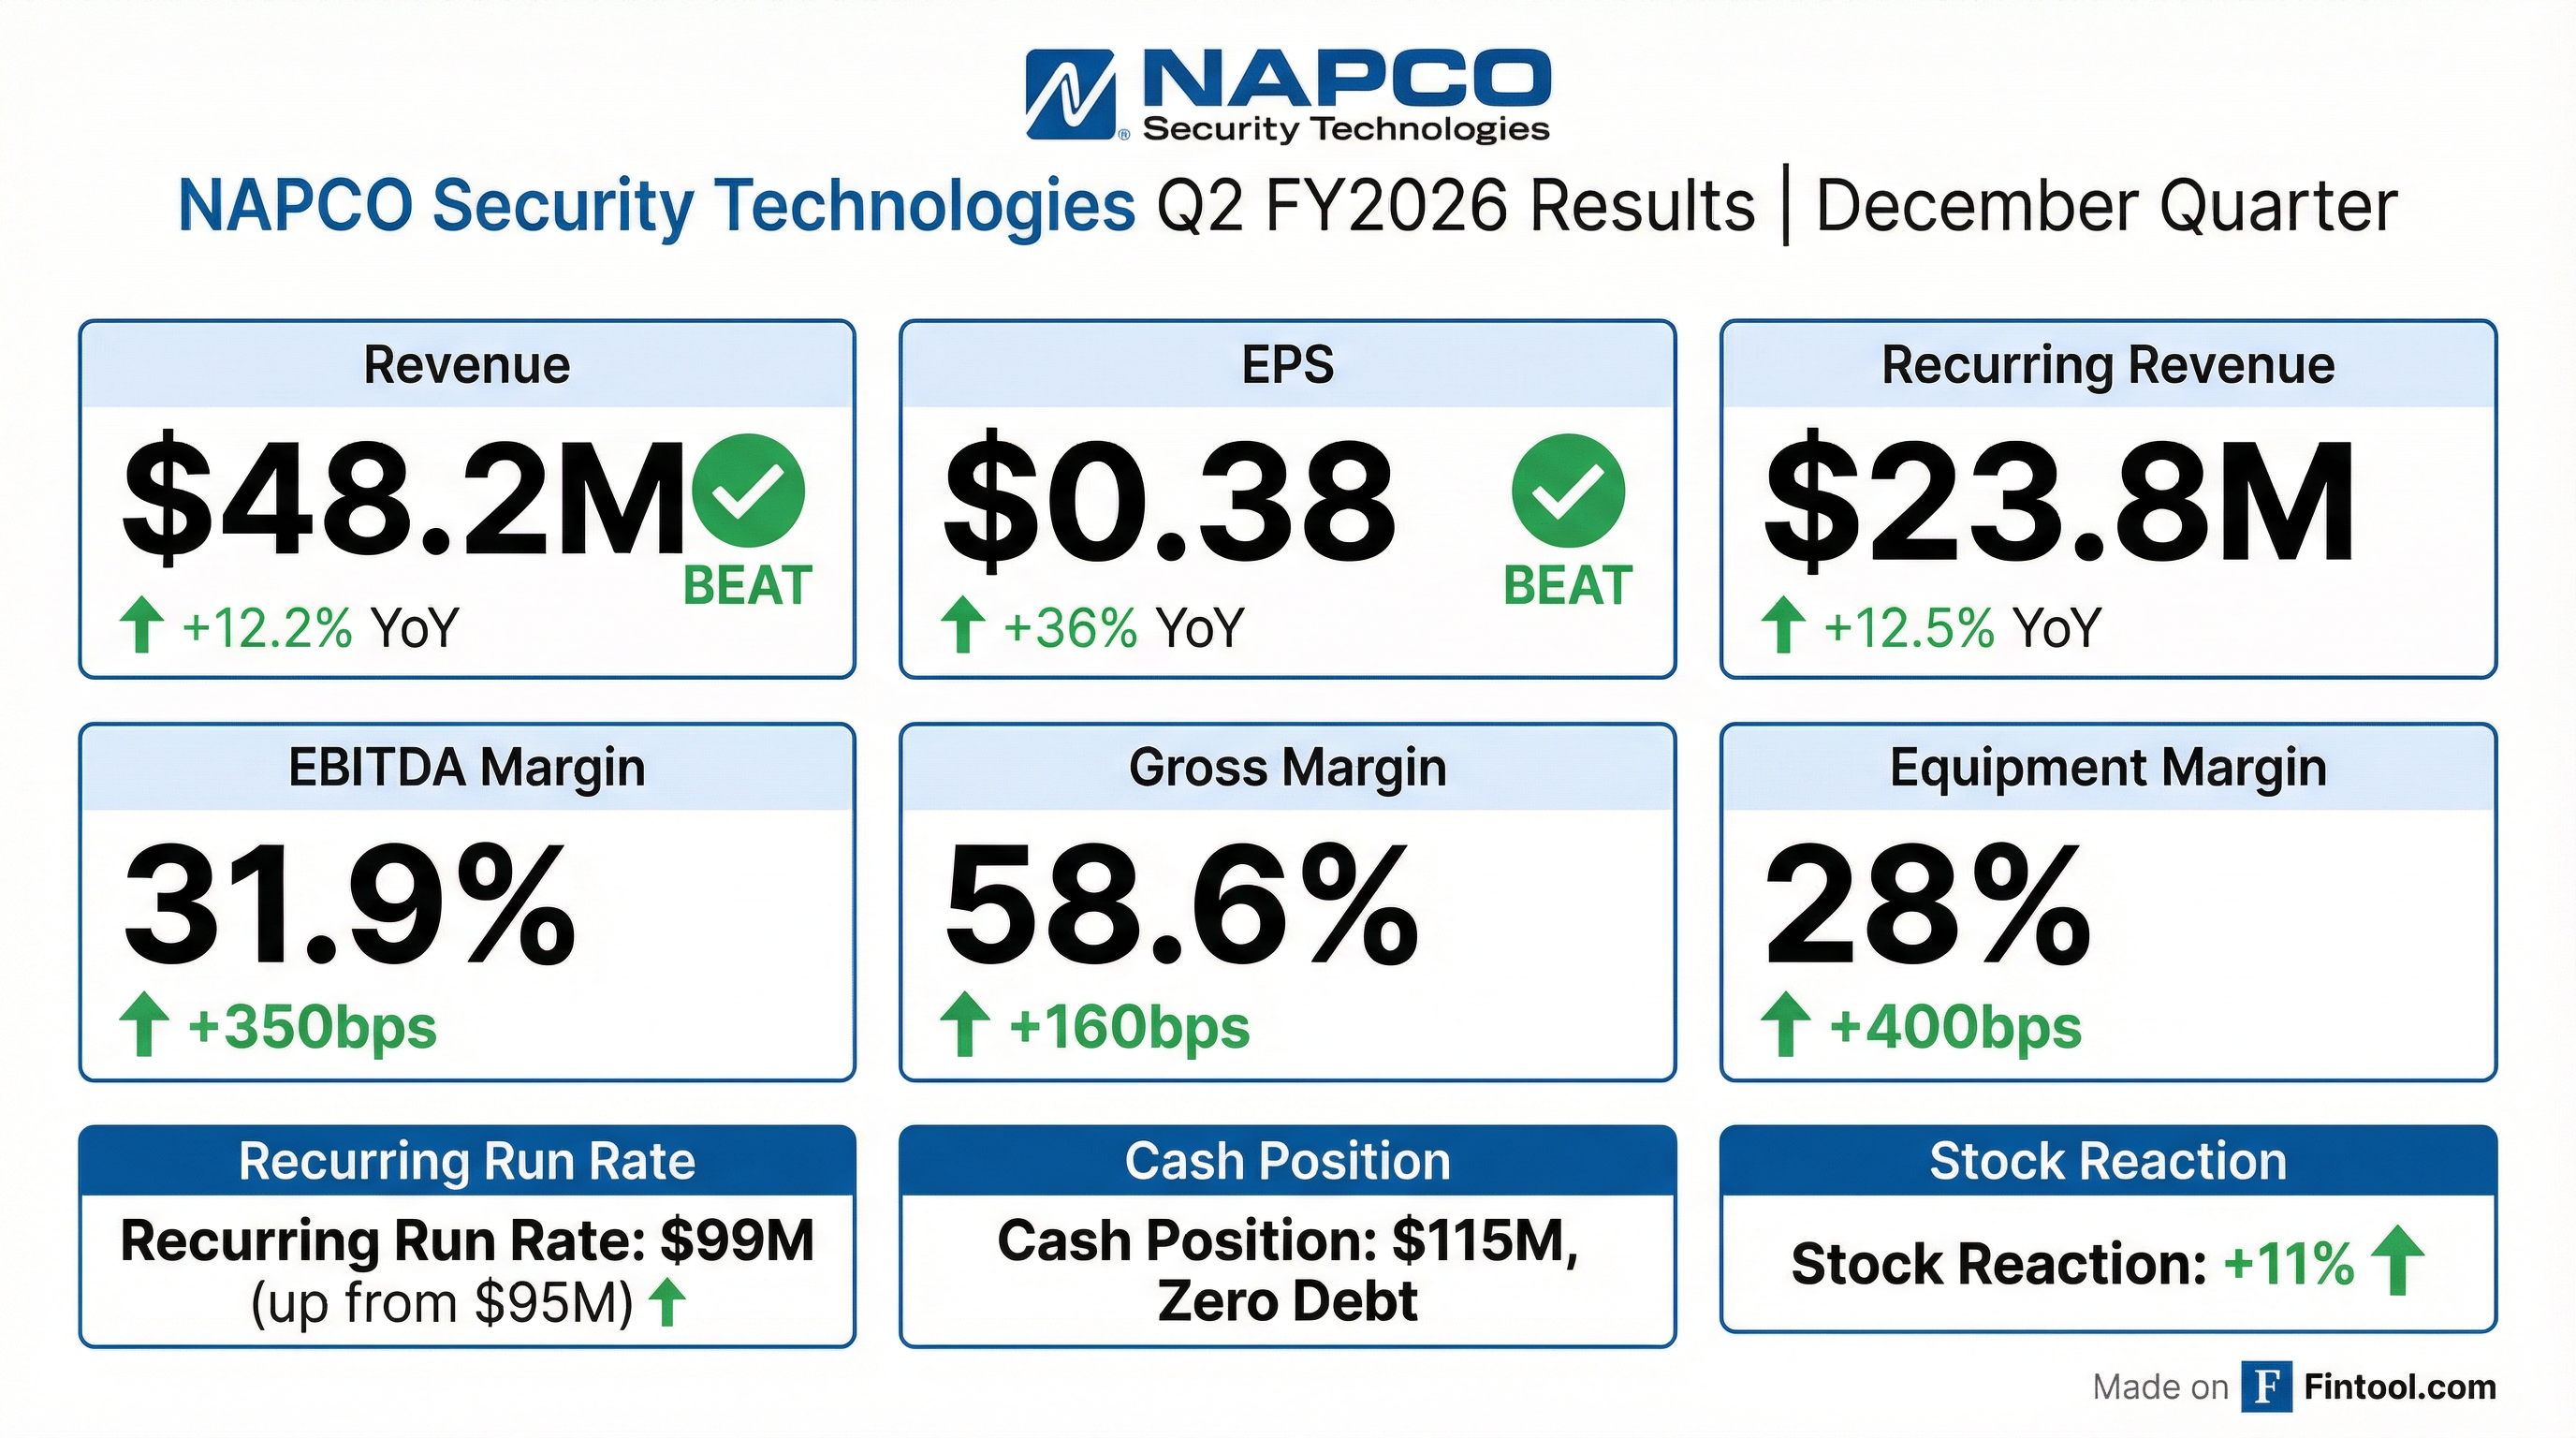
- NAPCO Security Technologies, Inc. reported record Q2 Net revenues of $48.2 million, a 12.2% year-over-year increase for the three months ended December 31, 2025.
- Diluted EPS increased to $0.38 in Q2 2026, up from $0.28 in the prior fiscal year quarter.
- Recurring service revenue (RSR) increased by 12.5% year-over-year to $23.8 million, achieving a 90.2% gross margin.
- The Board declared a quarterly dividend of $0.15 per share, representing a 7% increase from the last quarter.
- Joseph Pipczynski was appointed as the Company’s Chief Revenue Officer on January 29, 2026.
- NSSC reported record Q2 2026 total revenue of $48.2 million, an increase of 12.2% year-over-year, driven by 12% growth in equipment revenue and 12.5% growth in recurring revenue.
- Profitability significantly improved, with Q2 2026 operating income increasing 32% to $14.8 million, net income rising 29% to $13.5 million, and Adjusted EBITDA growing 26% to $15.3 million.
- The company's recurring service revenue achieved a prospective annual run rate of approximately $99 million based on January 2026 revenues, up from $95 million last quarter, and maintained a strong 90.2% gross margin.
- NSSC's balance sheet remains strong with $115 million in cash and marketable securities as of December 31, 2025, and no debt, leading the board to approve a 7% increase in the quarterly dividend to $0.15 per share.
- NAPCO Security Technologies (NSSC) reported record Q2 2026 revenue of $48.2 million, an increase of 12.2% year-over-year, with net income rising 29% to $13.5 million, or $0.38 per diluted share.
- Both recurring monthly service revenue and equipment revenue demonstrated strong growth in Q2 2026, increasing 12.5% to $23.8 million and 12% to $24.3 million, respectively. The annualized run rate for recurring service revenue reached approximately $99 million based on January 2026.
- The company maintains a strong financial position with $115.4 million in cash and marketable securities and no debt as of December 2025. Free cash flow for the quarter increased 17.4% to $14.5 million.
- NSSC appointed Joseph Paczynski as Chief Revenue Officer to accelerate revenue growth and announced an increase in the quarterly dividend to $0.15 per share.
- NAPCO Security Technologies (NSSC) reported a record Q2 2026 revenue of $48.2 million, a 12.2% increase year-over-year, with both equipment revenue and recurring revenue growing by 12% and 12.5%, respectively.
- The prospective annual run rate for recurring service revenue reached approximately $99 million based on January 2026 figures, contributing to significant profitability gains including a 32% increase in operating income to $14.8 million and a 29% rise in net income to $13.5 million.
- The company maintains a strong balance sheet with $115 million in cash and marketable securities and no debt as of December 31, 2025, and increased its quarterly dividend by 7% to $0.15 per share.
- NSSC appointed Joseph Paczynski as Chief Revenue Officer to accelerate growth and continues to focus on strategic areas such as school security and expanding recurring service revenue through new offerings like the MVP cloud-based access control platform.
- NAPCO Security Technologies reported record Q2 net revenues of $48.2 million, a 12.2% year-over-year increase, driven by 12.0% growth in equipment revenue and 12.5% growth in recurring service revenue (RSR).
- Diluted EPS increased to $0.38 from $0.28 in the prior fiscal year quarter, representing a 35.7% year-over-year increase, while net income grew 29% to a Q2 record of $13.5 million.
- The company's gross profit margin for Q2 2026 was 58.6%, up from 57.0% in the prior year, with RSR maintaining a 90.2% gross margin and a prospective annual run rate of approximately $99 million.
- The Board declared a quarterly dividend of $0.15 per share, marking a 7% increase from the last quarter.
- Joseph Pipczynski was appointed as Chief Revenue Officer, effective January 29, 2026.
- NAPCO Security Technologies, Inc. reported record Q1 Net revenues of $49.2 million, an 11.7% year-over-year increase for the first quarter of fiscal 2026.
- Diluted EPS increased to $0.34 from $0.30 in the prior fiscal year quarter, with net income rising 8.8% year-over-year to a Q1 record of $12.2 million.
- Recurring service revenue (RSR) grew 11.1% year-over-year to $23.4 million with a 90% gross margin, and had a prospective annual run rate of approximately $95 million based on October 2025 recurring service revenues.
- The Board of Directors declared a quarterly dividend of $0.14 per share, payable on January 2, 2026, to shareholders of record on December 12, 2025.
- NAPCO Security Technologies reported record Q1 Fiscal 2026 revenue of $49.2 million, an 11.7% increase compared to the prior year period.
- Recurring monthly service revenue grew 11.6% to $23.5 million with a gross margin of 90.3%, while equipment revenue increased 11.8% to $25.6 million with a gross margin of 25.7%.
- Net income for the quarter increased 8.8% to $12.2 million, or $0.34 per diluted share, and adjusted EBITDA rose 21.1% to $14.9 million.
- The company ended the quarter with $105.8 million in cash and cash equivalents and no debt as of September 30, 2025, and declared a quarterly dividend of $0.14 per share.
- NAPCO Security Technologies, Inc. reported record Q1 Fiscal 2026 net revenues of $49.2 million, an 11.7% year-over-year increase, with equipment revenue up 12.3% to $25.7 million and recurring service revenue (RSR) up 11.1% to $23.4 million.
- The company achieved a gross profit margin of 56.6% and diluted EPS of $0.34 for the quarter.
- RSR, which constitutes 48% of total revenue, maintained a 90% gross margin and has a prospective annual run rate of approximately $95 million based on October 2025 recurring service revenues.
- Net income increased 8.8% year-over-year to $12.2 million, and Adjusted EBITDA reached $14.9 million, representing a 30.4% margin.
- The Board declared a quarterly dividend of $0.14 per share, payable on January 2, 2026.
- NAPCO Security Technologies reported a 14% decrease in net income to $11.6 million or $0.33 per diluted share for Q4 2025, and a 13% decrease to $43.4 million or $1.19 per diluted share for fiscal year 2025. Net sales for Q4 2025 increased 0.8% to $50.7 million, while full fiscal year 2025 net sales decreased 3.8% to $181.6 million.
- Recurring monthly service revenue continued strong growth, increasing 10% in Q4 2025 to $22.4 million and 14% for the full fiscal year to $86.3 million, with the run rate reaching $94 million. This segment maintained a strong gross margin of 91%.
- The company implemented two pricing increases totaling 13.5% (an 8.5% increase to offset tariffs and a standard annual 5% increase), with full benefits expected in fiscal Q1 2026, and anticipates double-digit equipment sales growth in fiscal 2026.
- NAPCO maintained a strong financial position with $99.1 million in cash and no debt as of June 2025. During fiscal 2025, the company returned nearly $50 million to shareholders through $13.6 million in dividends and $36.8 million in stock repurchases.
- Q3 net sales declined 10.8% to $44.0 million while recurring service revenue grew 10.6% to $21.6 million (49% of total revenue, with a prospective annual run rate of $89 million)
- Net income fell ~23% to ~$10 M with diluted EPS of $0.28 and adjusted EBITDA reached $13.2 M (30% margin)
- Gross profit margin improved to 57.2% from 53.8% year-over-year
- Shareholder returns totaled $46 M, including a quarterly dividend of $0.14 per share (payable July 3, 2025; record date June 12, 2025) and $18.8 M in stock repurchases
- Equipment sales declined 24.8% to $22.4 million due to inventory reductions and project timing at key distributors
- Ended Q3 debt-free with approximately $90 M in cash, cash equivalents, and investments
- Launched new cloud-based access control platforms (MVP Access, MVP EZ) and next-generation StarLink radio products (FireMax II, BlackMax II) to drive service revenue growth
Quarterly earnings call transcripts for NAPCO SECURITY TECHNOLOGIES.
Ask Fintool AI Agent
Get instant answers from SEC filings, earnings calls & more