Earnings summaries and quarterly performance for PTC.
Executive leadership at PTC.
Board of directors at PTC.
Amar Hanspal
Director
Corinna Lathan
Director
James Lico
Director
Janice Chaffin
Chair of the Board
Mark Benjamin
Director
Michal Katz
Director
Paul Lacy
Director
Robert Bernshteyn
Director
Robert Schechter
Director
Trac Pham
Director
Research analysts who have asked questions during PTC earnings calls.
Jason Celino
KeyBanc Capital Markets
8 questions for PTC
Jay Vleeschhouwer
Griffin Securities, Inc.
8 questions for PTC
Tyler Radke
Citigroup Inc.
7 questions for PTC
Ken Wong
Oppenheimer & Co. Inc.
6 questions for PTC
Adam Borg
Stifel Financial Corp.
5 questions for PTC
Joshua Tilton
Wolfe Research
5 questions for PTC
Nay Soe Naing
Berenberg Capital Markets LLC
5 questions for PTC
Blair Abernethy
Rosenblatt Securities Inc.
4 questions for PTC
Daniel Jester
BMO Capital Markets
4 questions for PTC
Saket Kalia
Barclays Capital
4 questions for PTC
Clarke Jeffries
Piper Sandler & Co.
3 questions for PTC
Joe Vruwink
Baird
3 questions for PTC
Matthew Hedberg
RBC Capital Markets
3 questions for PTC
Siti Panigrahi
Mizuho Securities
3 questions for PTC
Andrew Obin
Bank of America
2 questions for PTC
Hoi-Fung Wong
Oppenheimer & Co. Inc.
2 questions for PTC
Matt Hedberg
RBC
2 questions for PTC
Sitikantha Panigrahi
Mizuho
2 questions for PTC
Yun Kim
Loop Capital Markets
2 questions for PTC
Blair Abernathy
Rosenblatt Securities
1 question for PTC
C. Stephen Tusa
JPMorgan Chase & Co.
1 question for PTC
Joseph Vruwink
Baird
1 question for PTC
Recent press releases and 8-K filings for PTC.
- Jen D’Errico appointed CFO, joining PTC to drive growth, financial discipline, and investor engagement.
- Constant currency ARR was $2.341 B, up 9% YoY (excluding Kepware/ThingWorx), and free cash flow grew 13% to $267 M in Q1.
- $200 M of common stock repurchased in Q1 under a $2 B authorization, with ~$1.1–1.3 B total buybacks planned in fiscal 2026, reducing fully diluted shares to ~119 M.
- Fiscal 2026 outlook raised: revenue $2.675–2.940 B, non-GAAP EPS $6.69–9.15, and ARR growth of 7.5–9.5% (excluding divested units).
- Jen DiRico joined PTC as CFO, marking her first earnings call in the role.
- In Q1 FY26, constant currency ARR grew 9% (8.4% including Kepware and ThingWorx) and free cash flow rose 13% YoY; record deferred ARR under contract supports durability, and the divestiture of Kepware and ThingWorx remains on track to close by April 1.
- PTC continues embedding AI across its portfolio, launching Codebeamer AI in December and Windchill AI Parts Rationalization in January to enhance product lifecycle workflows.
- Fiscal 2026 guidance was raised: revenue to $2.675 billion–$2.94 billion and non-GAAP EPS to $6.69–$9.15; Q2 free cash flow is guided at $310 million–$315 million, and approximately $1 billion of FCF is expected for the full year.
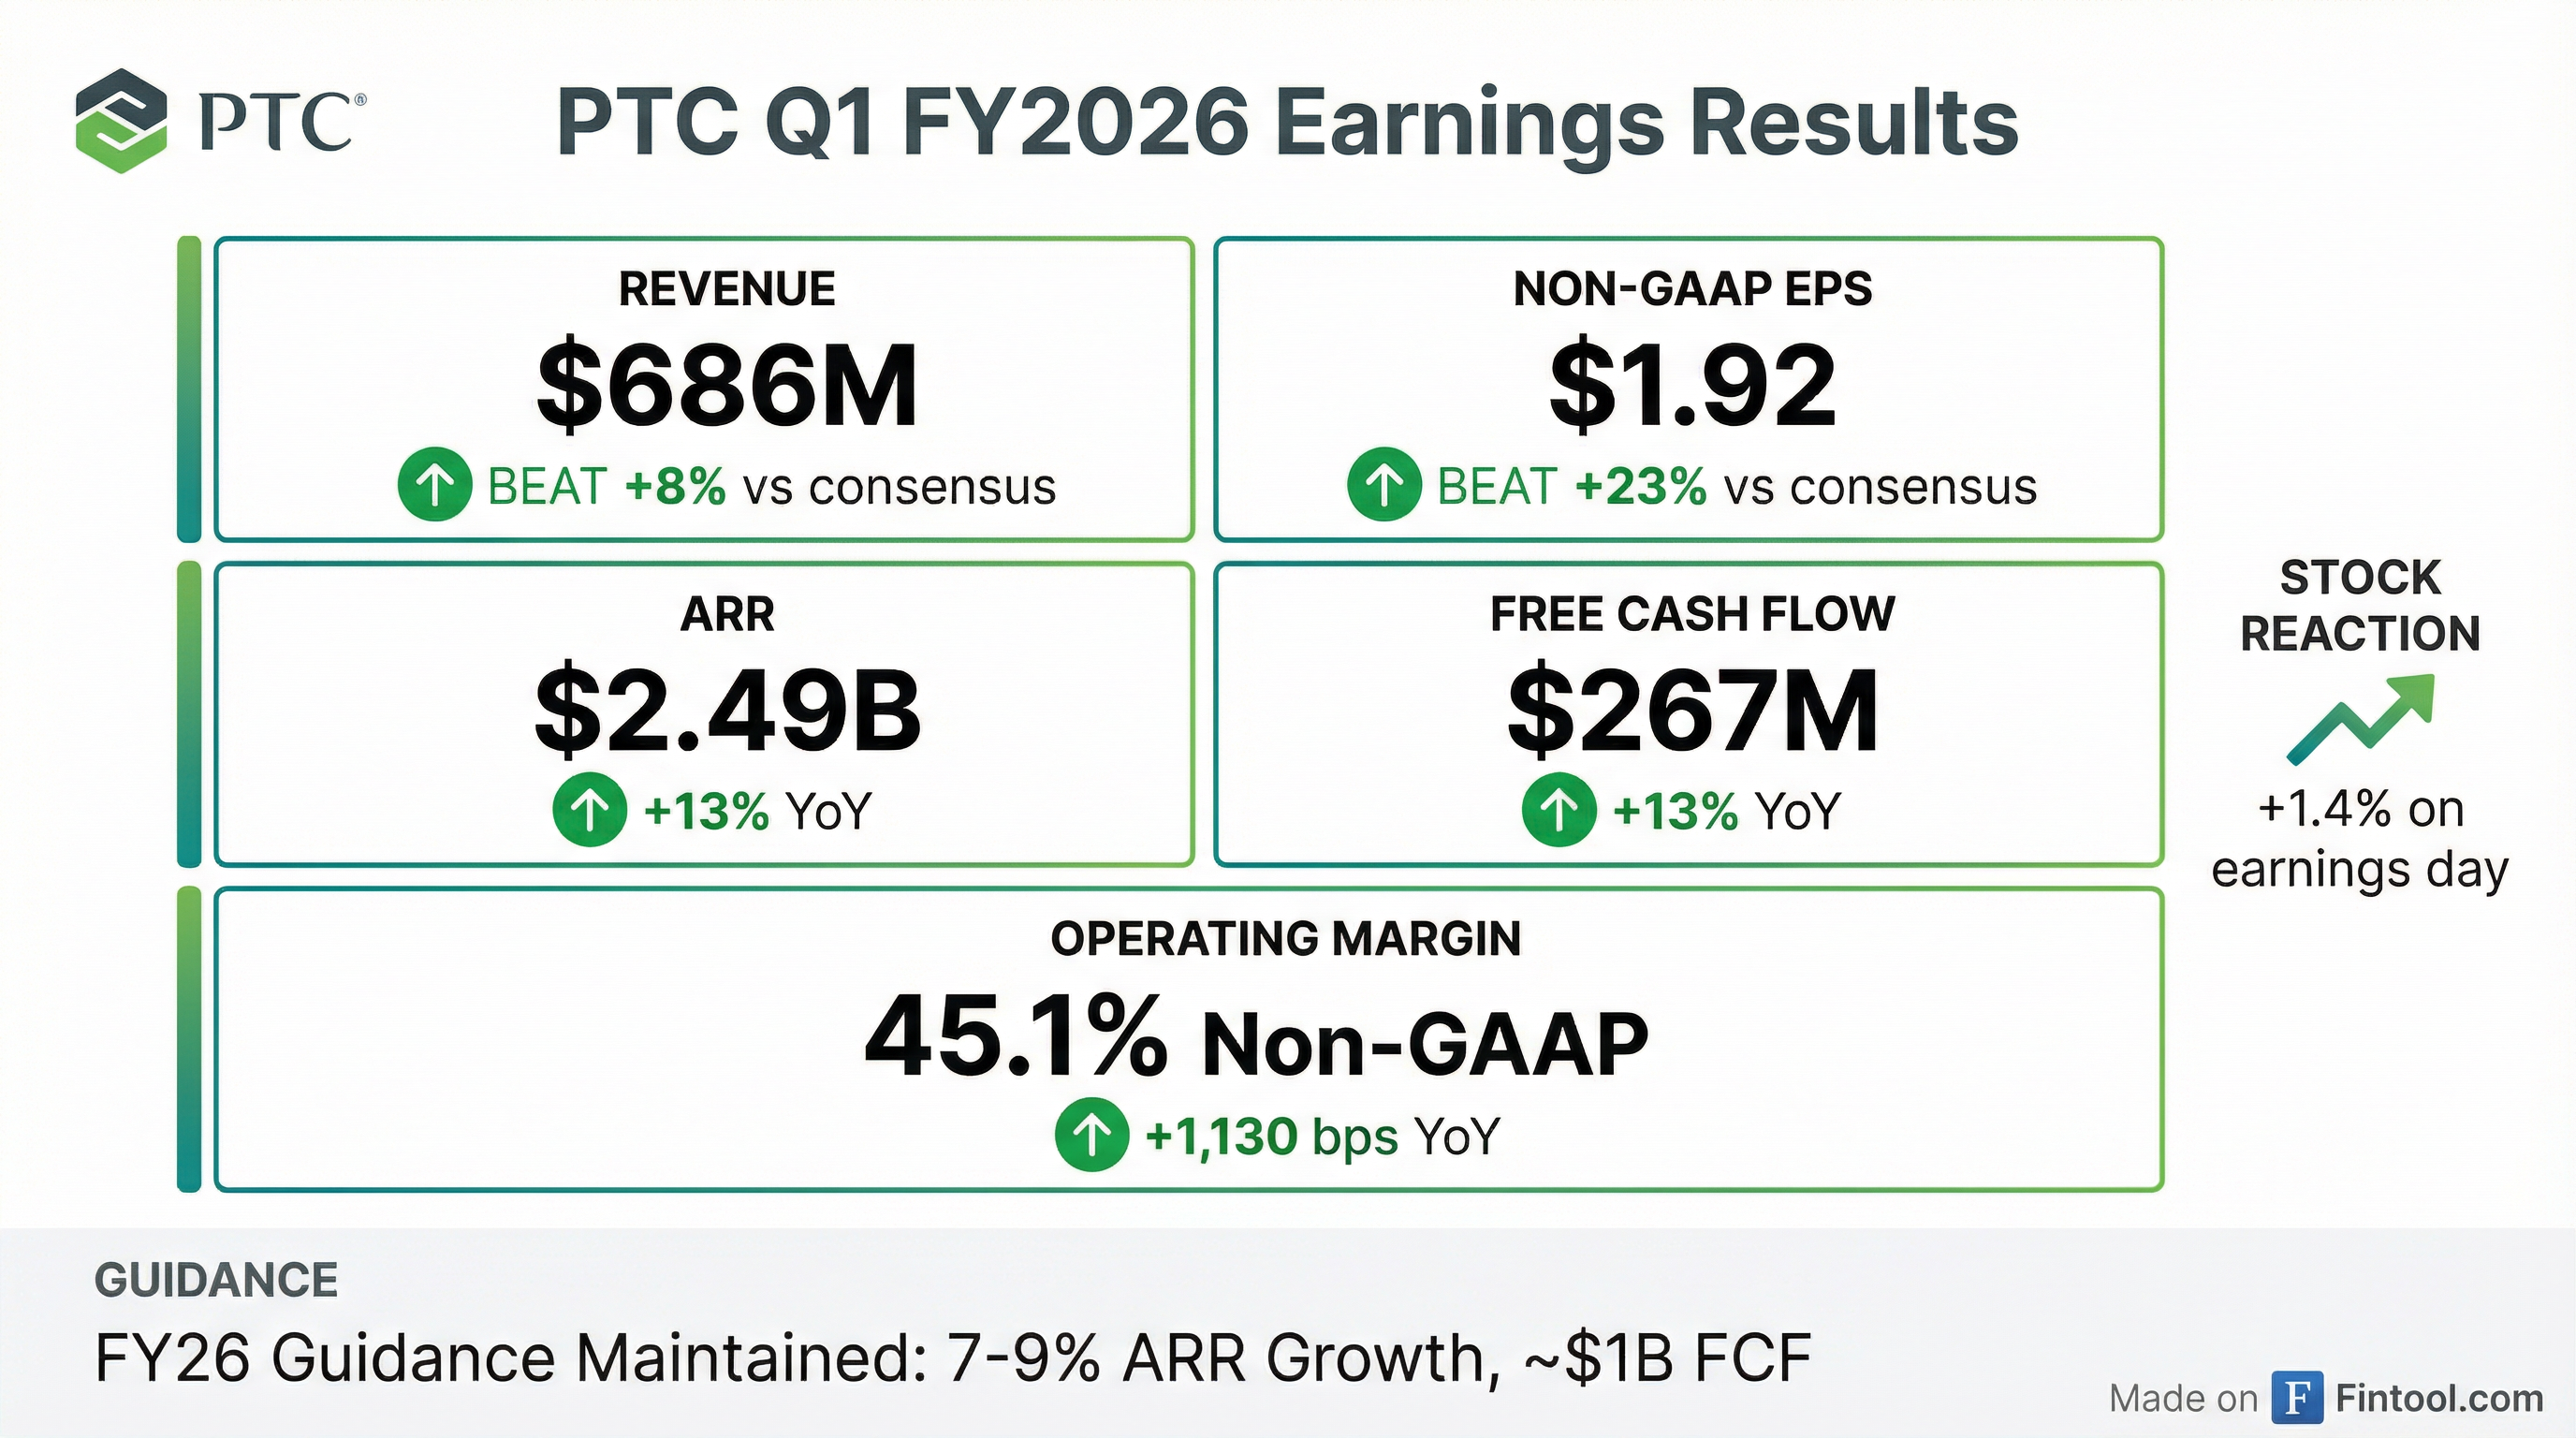
- PTC reports Q1 FY’26 ARR of $2,494 M, up 13% YoY; constant currency ARR excluding Kepware & ThingWorx grew 9.0%, at the high end of guidance
- Q1 operating cash flow of $270 M and free cash flow of $267 M, both up 13% YoY, aligning with guidance
- Balance sheet as of Q1: $210 M cash & equivalents, net debt of $1,198 M (0.9x Debt/EBITDA), and $200 M in share repurchases
- Maintained FY’26 guidance: constant currency ARR growth of 7.5%–9.5% ex-Kepware & ThingWorx, operating cash flow ~$1,030 M, free cash flow ~$1,000 M; Q2 targets ARR growth 8%–8.5%, operating cash flow $315–320 M, EPS $1.25–1.87
- Authorized to repurchase $2 B of shares through FY’27, targeting $1.115 B–$1.315 B in FY’26 share buybacks
- PTC welcomed Jen D’Errico as its new CFO, highlighting confidence in its Intelligent Product Lifecycle transformation.
- In Q1 FY2026, constant currency ARR grew 9% YoY to $2.341 B (ex. Kepware/ThingWorx) and free cash flow rose 13% to $267 M; the company repurchased $200 M of shares under its $2 B authorization.
- The divestiture of Kepware and ThingWorx remains on track for close by April 1, with expected net after-tax proceeds of ~$365 M.
- Fiscal 2026 guidance raised: ARR growth of 7.5–9.5% (ex. divestiture), revenue of $2.675–2.94 B, non-GAAP EPS of $6.69–9.15, and $1.1–1.3 B in share buybacks planned.
- Continued embedding of AI across its portfolio (Codebeamer AI in December; Windchill AI in January) and achievement of record deferred ARR under contract support durable future growth.
- ARR (Annual Run Rate) increased 13% to $2.494 billion, with constant currency ARR up 8.4% to $2.500 billion (9.0% ex-Kepware/ThingWorx); revenue grew 21% YoY to $686 million, and operating cash flow and free cash flow each rose 13% to $270 million and $267 million, respectively.
- GAAP EPS of $1.39 and non-GAAP EPS of $1.92, driving an operating margin of 32% and a non-GAAP operating margin of 45%.
- Executed $200 million of share repurchases under its $2 billion authorization; expects to use net after-tax proceeds from the Kepware and ThingWorx divestiture for additional repurchases, targeting $1.115 billion to $1.315 billion in FY2026.
- Updated FY2026 guidance to 7%–9% constant currency ARR growth (7.5%–9.5% ex-divestiture), revenue of $2.675 billion to $2.94 billion, operating cash flow of ~$1.03 billion, GAAP EPS of $4.42–$6.93, non-GAAP EPS of $6.69–$9.15; Q2 guidance: 7.5%–8.0% ARR growth (8.0%–8.5% ex-divestiture) and revenue of $710 million to $770 million.
- PTC reported Q1’26 ARR of $2.494 billion, up 13% YoY, with constant currency ARR growth of 8.4% (9.0% ex-Kepware/ThingWorx).
- Q1’26 revenue was $686 million (21% YoY), with operating cash flow of $270 million, free cash flow of $267 million, and GAAP EPS of $1.39 (non-GAAP EPS $1.92).
- Executed $200 million of share repurchases in Q1 under its $2 billion authorization; targeting $1.115 billion–$1.315 billion of repurchases in FY ’26.
- Maintained FY ’26 guidance for constant currency ARR growth of 7–9%, revenue of $2.675 billion–$2.94 billion, and Q2’26 ARR growth of 7.5–8%.
- PTC unveils AI capabilities for its FlexPLM retail PLM solution at NRF 2026, automating tech pack creation to reduce manual work and errors in product development.
- The AI-driven features extract data from design drawings to auto-populate bills of materials, measurements, construction details, and colorways, lowering development costs and accelerating sampling and costing.
- These enhancements extend PTC’s Intelligent Product Lifecycle strategy by integrating AI with structured product data to streamline workflows and boost productivity.
- Demonstrations will be held at NRF Retail’s Big Show (Jan. 11–13, 2026) at Booth #3346 in New York City.
- PTC has connected Onshape Government CAD/PDM with Arena PLM and QMS on AWS GovCloud, delivering a unified product development environment for U.S. government and regulated industries.
- The integration supports ITAR and EAR compliance and provides role-based access, audit logs, real-time BOM and engineering change updates, and full traceability.
- Targeted at U.S. government agencies, defense contractors, and other regulated organizations, the solution replaces fragmented, file-based tools with a single secure system.
- Both Onshape Government and Arena PLM are hosted on AWS GovCloud (US), enhancing the security foundation for compliance and data protection.
- PTC reached a definitive agreement for TPG to acquire its Kepware and ThingWorx businesses, expected to close in H1 2026 with upfront proceeds of $565 million–$600 million (net ~$365 million assuming an April 1 close) and potential total consideration of up to $725 million
- In Q4 FY25, PTC delivered 8.5% constant currency ARR growth and 16% free cash flow growth year-over-year, ending the year with record deferred ARR under contract
- For FY26, PTC guides to 7%–9% constant currency ARR growth including and 7.5%–9.5% excluding Kepware and ThingWorx, and expects $1 billion of free cash flow
- With leverage below 1×, PTC plans to return excess cash to shareholders by buying back $150 million–$250 million of shares per quarter in FY26, starting with $200 million in Q1
- ARR reached $2,478 million in Q4 with 10% YoY growth (8.5% constant currency).
- Operating cash flow was $104 million and free cash flow was $100 million in Q4, up 6% and 7% YoY, respectively, beating guidance.
- Announced divestiture of Kepware and ThingWorx, expecting net proceeds of ~$365 million, closing in H1 2026.
- FY 2026 guidance: constant currency ARR growth of 7–9%, operating cash flow ~ $1,030 million, free cash flow ~ $1,000 million, and revenue of $2,650–2,915 million.
Quarterly earnings call transcripts for PTC.
Ask Fintool AI Agent
Get instant answers from SEC filings, earnings calls & more