Earnings summaries and quarterly performance for ROCKWELL AUTOMATION.
Research analysts who have asked questions during ROCKWELL AUTOMATION earnings calls.
Andrew Kaplowitz
Citigroup
9 questions for ROK
Christopher Snyder
Morgan Stanley
9 questions for ROK
Julian Mitchell
Barclays Investment Bank
9 questions for ROK
Scott Davis
Melius Research
9 questions for ROK
Nigel Coe
Wolfe Research, LLC
8 questions for ROK
Andrew Obin
Bank of America
6 questions for ROK
Steve Tusa
JPMorgan Chase & Co.
4 questions for ROK
Jeffrey Sprague
Vertical Research Partners
3 questions for ROK
Joseph O'Dea
Wells Fargo & Company
3 questions for ROK
Andrew Buscaglia
BNP Paribas
2 questions for ROK
Stephen Tusa
J.P. Morgan
2 questions for ROK
Tommy Moll
Stephens Inc.
2 questions for ROK
Andre Stillman Adams
Oppenheimer & Co. Inc.
1 question for ROK
Cigusa Katuka
JPMorgan Chase & Co.
1 question for ROK
Noah Kaye
Oppenheimer & Co. Inc.
1 question for ROK
Robert Mason
Robert W. Baird & Co.
1 question for ROK
Recent press releases and 8-K filings for ROK.
- CEO Blake Moret highlighted Rockwell’s enhanced resilience, with process now the largest served vertical and annual recurring revenue from software and high-value services at >10% of total revenue, contributing >10% segment profitability.
- The growth algorithm introduced in November 2023 targets 5%–8% organic growth, driven by secular automation demand, increasing ARR, market-share gains, and modest M&A.
- Full-year 2026 guidance remains at 4% organic growth at midpoint, with mid-single-digit top-line growth and double-digit earnings growth, and management sees upside toward the 5%–8% medium-term goal.
- North America new-capacity orders grew in double digits in Q1 and are expected to remain strong and broad-based across verticals, though some larger projects remain deferred.
- Annual recurring revenue (software and services) accounts for >10% of sales, pure software <10%, and large parts of the software business achieve >100% net dollar retention, underpinned by tight hardware integration and domain expertise.
- Rockwell highlighted its resilient business model with process as its largest served vertical, annual recurring revenue (software & high-value services) >10% of revenue, and focused operational excellence driving expanding margins.
- The company reiterated FY2026 organic growth guidance of 2–6% (4% midpoint) with a “good chance” to reach mid-single-digit growth and a 5–8% medium-term target introduced in November 2023.
- Segment margin corridors have been met for Lifecycle Services and Software & Control; Intelligent Devices is on a defined path to its corridor, supported by R&D investment at ~8% of revenue (higher in Software & Control).
- Data center automation is a fast-growing served market, currently low-single-digit of revenue, with potential to reach ≈5% in the near future.
- Post-supply-chain crisis, Rockwell maintains strong chip availability, increased memory inventory, and uses tariff-driven pricing adjustments that are EPS neutral.
- Rockwell reiterates its FY26 guide at 4% organic growth midpoint, with confidence in reaching 5–8% medium-term targets, driven by early strength in e-commerce, warehouse automation, chemical and core sectors and North America leading orders growth.
- Annual recurring revenue now exceeds 10% of total revenue, while pure software remains under 10%; the company expects resilient software demand supported by integrated runtimes, deterministic AI applications and net dollar retention above 100%.
- The Software & Control segment saw 20%+ y/y growth in Logix controllers globally (25%+ in North America); destocking is behind them, with Q2 sequential gains and full-year segment growth aligned to company targets, underpinned by a new Logix platform and ~8% R&D spend.
- The data center vertical is a fast-growing market and could represent ≈5% of revenue, as customers convert building-management systems to Logix for higher availability and safety, particularly in the U.S..
- Pricing initiatives—including annual and tariff-related adjustments designed to remain EPS-neutral—and increased memory-chip inventory support service levels and margin realization.
- Rockwell reconfirmed its full-year 2026 outlook of mid-single-digit organic growth and double-digit earnings growth, driven by its 5–8% organic growth algorithm (1–2% share gains, 1% ARR, 1% M&A).
- Lifecycle Services achieved a 1.16× book-to-bill ratio in Q1, reflecting stronger new-capacity orders and robust demand in North America.
- Annual Recurring Revenue grew 7% YoY in Q1, led by software (notably Plex) which posted record bookings, supported by enhanced go-to-market initiatives.
- Management plans to invest $2 billion over the coming years in plants, talent, and digital infrastructure to expand market share and margins.
- Continued emphasis on software-defined automation, integrated robotics, and entry into high-growth verticals (data centers, e-commerce/warehouse automation) underpins Rockwell’s growth strategy.
- Rockwell has bolstered its resilience with 40% process exposure, >10% annual recurring revenue, and a renewed focus on operational excellence across its supply chain.
- The company’s growth algorithm targets 5%–8% organic growth (3%–5% market, 1%–2% share gains, ~1% ARR, ~1% acquisitions), with guidance of mid-single-digit revenue growth and double-digit earnings growth for 2026.
- Annual recurring revenue rose 7% in Q1, driven by strong software performance and record Plex bookings, and is expected to achieve high single-digit ARR growth in 2026.
- Automation demand is supported by AI-enabled software-defined automation and integrated robotics, with Rockwell leveraging deep domain expertise to protect its mission-critical control software.
- A $2 billion investment over the coming years in plants, talent, and digital infrastructure aims to drive market-share gains and margin expansion, exemplified by a 30% labor-efficiency improvement at its Singapore software plant.
- Rockwell reiterated its full-year outlook of mid-single-digit revenue growth and double-digit earnings growth, with 2–6% organic growth guidance for 2026 versus a long-term 5–8% target.
- CEO Blake Moret emphasized the company’s “growth algorithm”—3–5% market growth, 1–2% share gains, 1% annual recurring revenue (ARR) growth, and 1% from acquisitions—and announced a $2 billion investment in plants, talent, and digital infrastructure to drive share and margin expansion.
- ARR grew 7% year-over-year in Q1, led by strong software performance: Plex set a record for new bookings, and Fiix and cybersecurity services also contributed to SaaS-based recurring revenue growth.
- Rockwell is advancing software-defined automation, integrated robotics, and AI-driven digital twins via Emulate3D and technology partnerships (e.g., NVIDIA) to simplify the design, commissioning, and operation of multi-vendor automation systems.
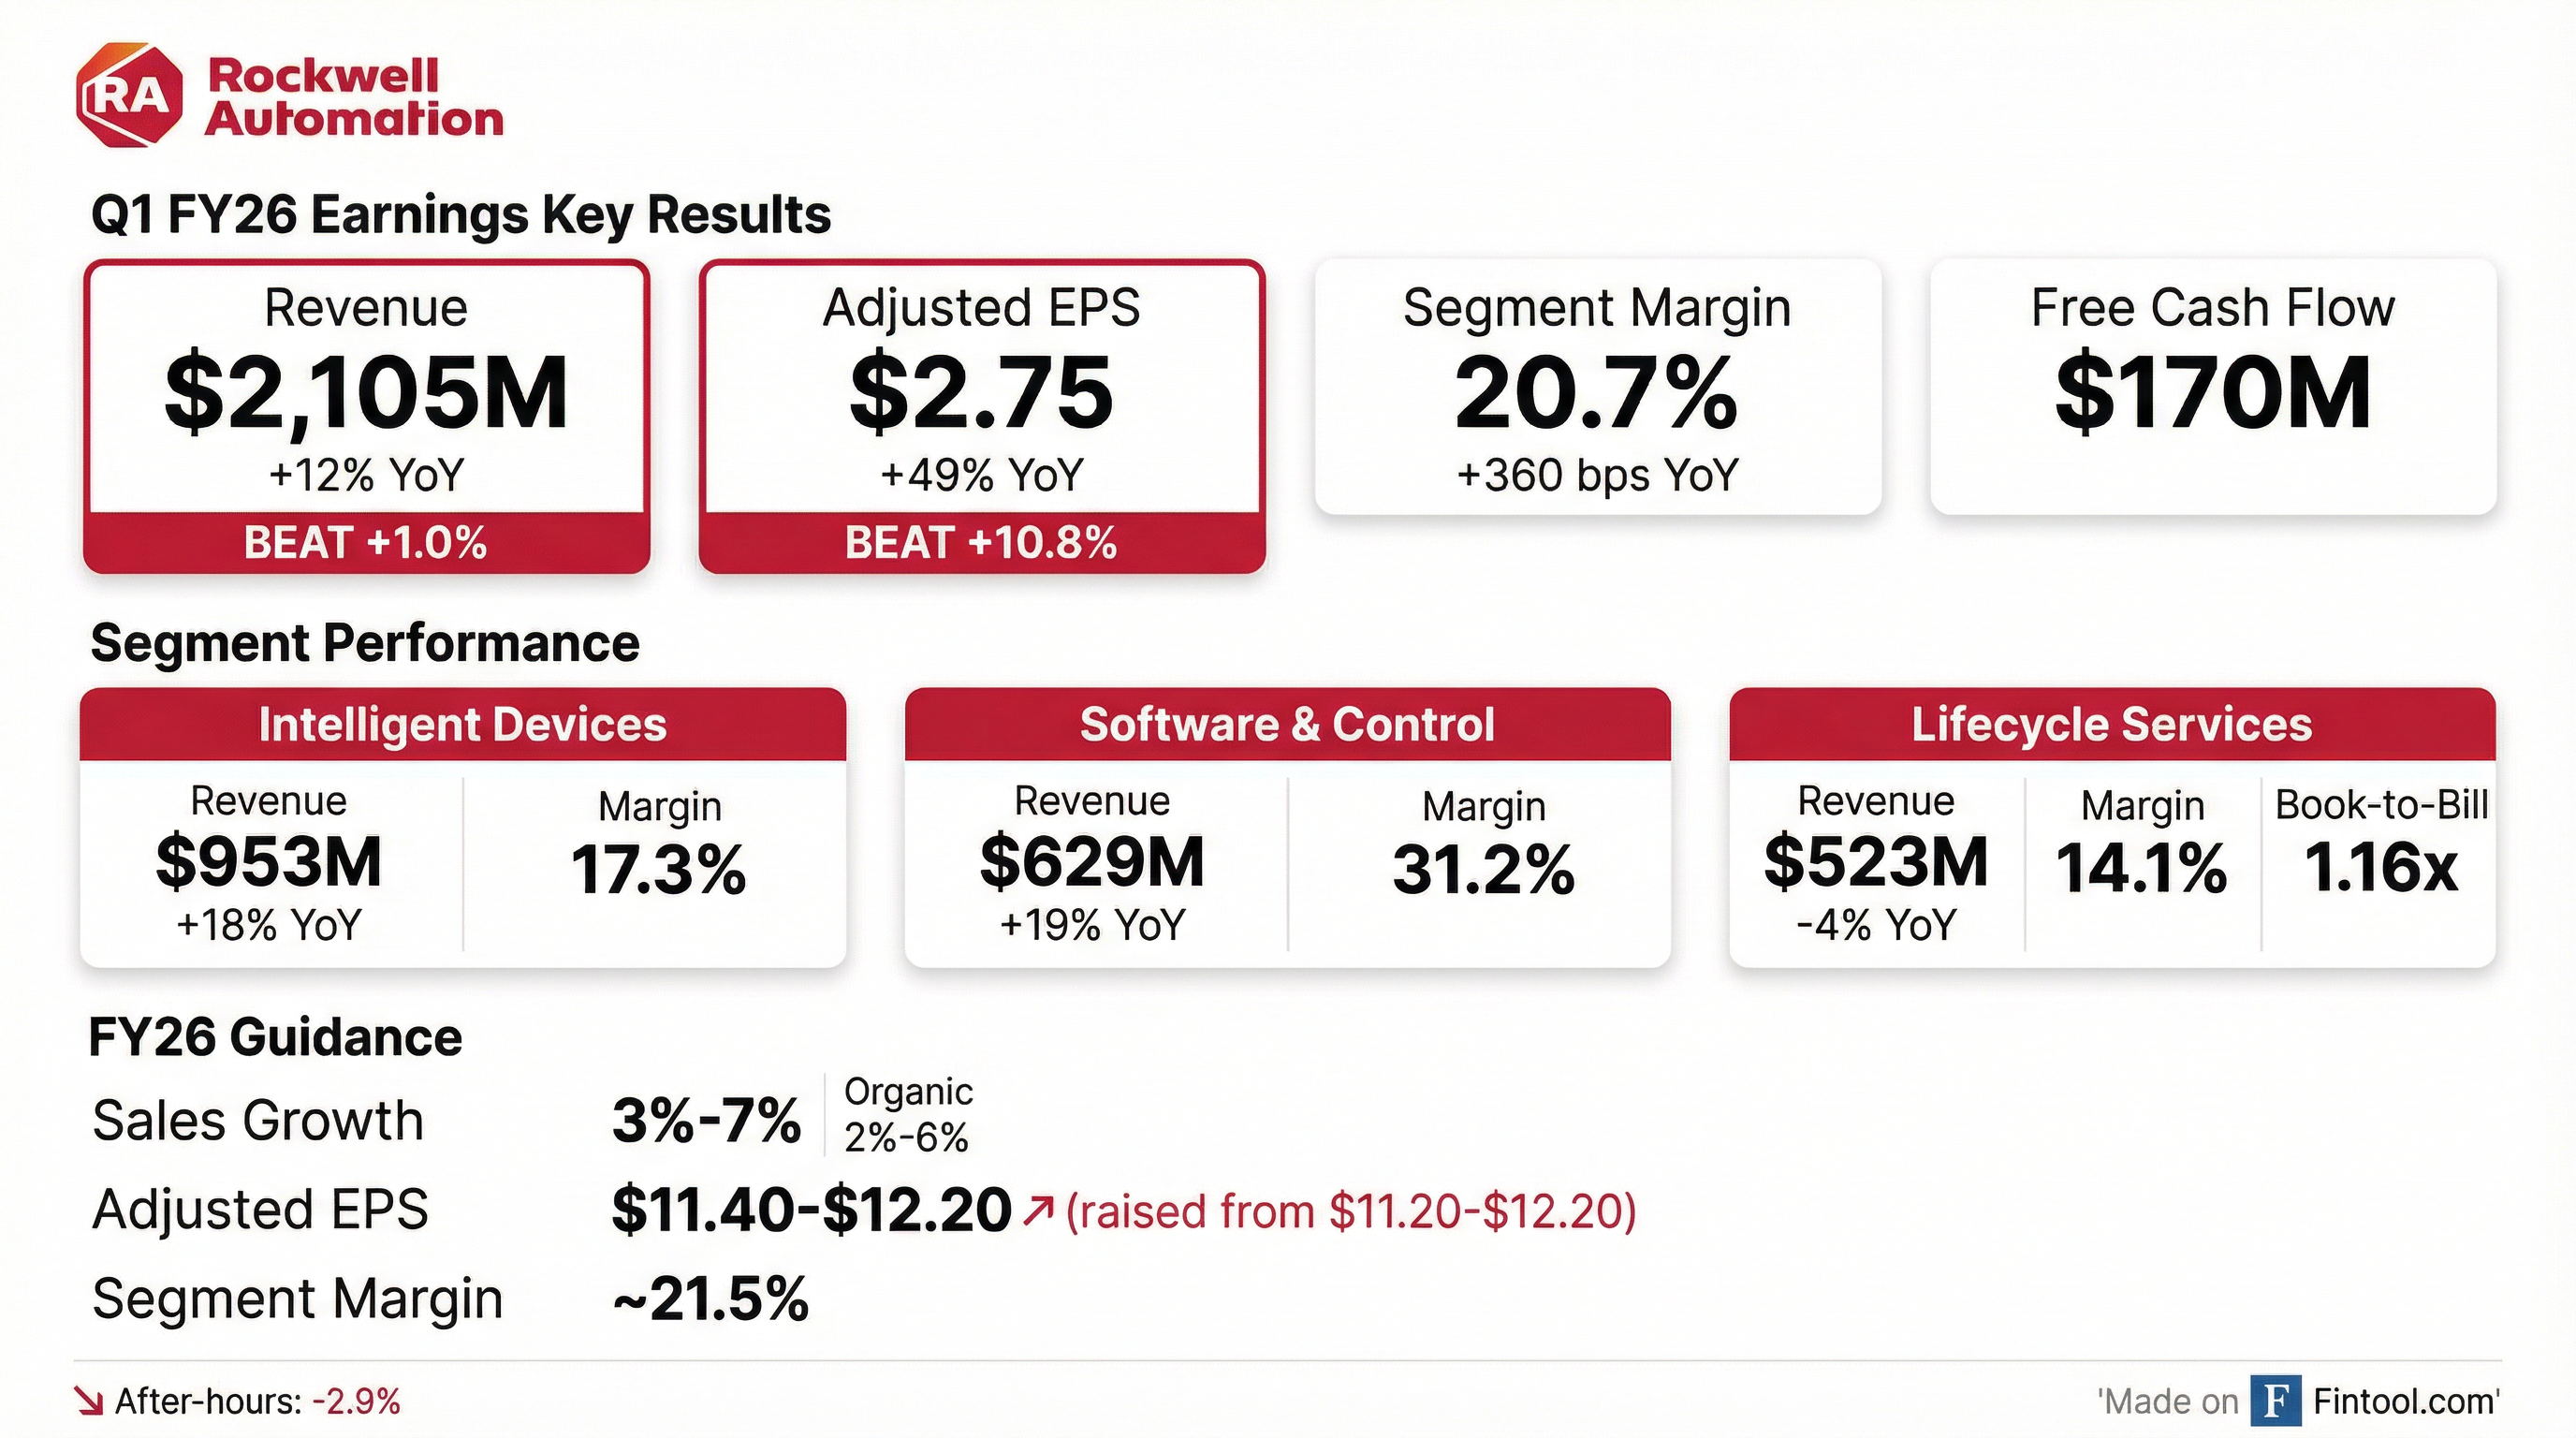
- Q1 reported sales grew 12% YoY, driven by price and currency, with organic sales up in double digits; segment margin was 20.7% and adjusted EPS was $2.75, all above expectations.
- Intelligent Devices achieved 16% organic sales growth, Software & Control grew 17%, and annual recurring revenue increased 7%, while Lifecycle Services declined 6% (Book-to-Bill 1.16).
- Productivity initiatives, price realization, and favorable mix drove 360 bps of segment margin expansion, with tariffs neutral on earnings.
- FY 2026 outlook maintained: 2–6% organic sales growth; adjusted EPS midpoint raised to $11.80; segment margin to expand by 100 bps; free cash flow conversion targeted at ~100%.
- Rockwell Automation delivered $2,105 M in Q1 sales, up 12% YOY driven by 10% organic growth and a 2% currency tailwind.
- Adjusted EPS rose to $2.75, a 49% increase from $1.85 in Q1 FY25.
- Segment operating margin expanded to 20.7%, up 360 bps year-over-year.
- FY26 guidance reaffirmed with 3%–7% reported sales growth, 2%–6% organic growth, and updated adjusted EPS range of $11.40–$12.20.
- Q1 reported sales rose 12% year-over-year, with double-digit organic growth, driving a 20.7% segment margin and $2.75 adjusted EPS, all above expectations.
- By segment, Intelligent Devices organic sales increased 16%, Software & Control grew 17%, while Lifecycle Services declined 6% with a 1.16 book-to-bill ratio.
- Annual recurring revenue grew 7%, Plex achieved its strongest quarter, and major wins included R.H. Sheppard on cloud-native Plex and Hindalco Industries for OT cybersecurity across six plants.
- Fiscal 2026 guidance maintained: organic sales growth of 2–6%, adjusted EPS midpoint raised to $11.80, segment margin expansion over 100 bps, and free cash flow conversion near 100%.
- Rockwell reported Q1 2026 sales up 12% year-over-year, driven by 3% price realization and a 2% currency tailwind, with double-digit organic growth in key segments.
- Total company segment margin expanded 360 bps to 20.7%, and adjusted EPS was $2.75.
- Segment performance: Intelligent Devices organic sales up 16%, Software & Control up 17%, while Lifecycle Services declined 6% with a book-to-bill of 1.16.
- Announced U.S. manufacturing investments, including a new “factory of the future” in New Berlin, WI, and the purchase of its Mequon, WI, facility.
- Maintained FY 2026 guidance: 2–6% organic sales growth, raised adjusted EPS midpoint to $11.80, and expects >100 bps margin expansion with ~100% free cash flow conversion.
Fintool News
In-depth analysis and coverage of ROCKWELL AUTOMATION.

Quarterly earnings call transcripts for ROCKWELL AUTOMATION.
Ask Fintool AI Agent
Get instant answers from SEC filings, earnings calls & more