Earnings summaries and quarterly performance for ROCKWELL AUTOMATION.
Research analysts who have asked questions during ROCKWELL AUTOMATION earnings calls.
Andrew Kaplowitz
Citigroup
9 questions for ROK
Christopher Snyder
Morgan Stanley
9 questions for ROK
Julian Mitchell
Barclays Investment Bank
9 questions for ROK
Scott Davis
Melius Research
9 questions for ROK
Nigel Coe
Wolfe Research, LLC
8 questions for ROK
Andrew Obin
Bank of America
6 questions for ROK
Steve Tusa
JPMorgan Chase & Co.
4 questions for ROK
Jeffrey Sprague
Vertical Research Partners
3 questions for ROK
Joseph O'Dea
Wells Fargo & Company
3 questions for ROK
Andrew Buscaglia
BNP Paribas
2 questions for ROK
Stephen Tusa
J.P. Morgan
2 questions for ROK
Tommy Moll
Stephens Inc.
2 questions for ROK
Andre Stillman Adams
Oppenheimer & Co. Inc.
1 question for ROK
Cigusa Katuka
JPMorgan Chase & Co.
1 question for ROK
Noah Kaye
Oppenheimer & Co. Inc.
1 question for ROK
Robert Mason
Robert W. Baird & Co.
1 question for ROK
Recent press releases and 8-K filings for ROK.
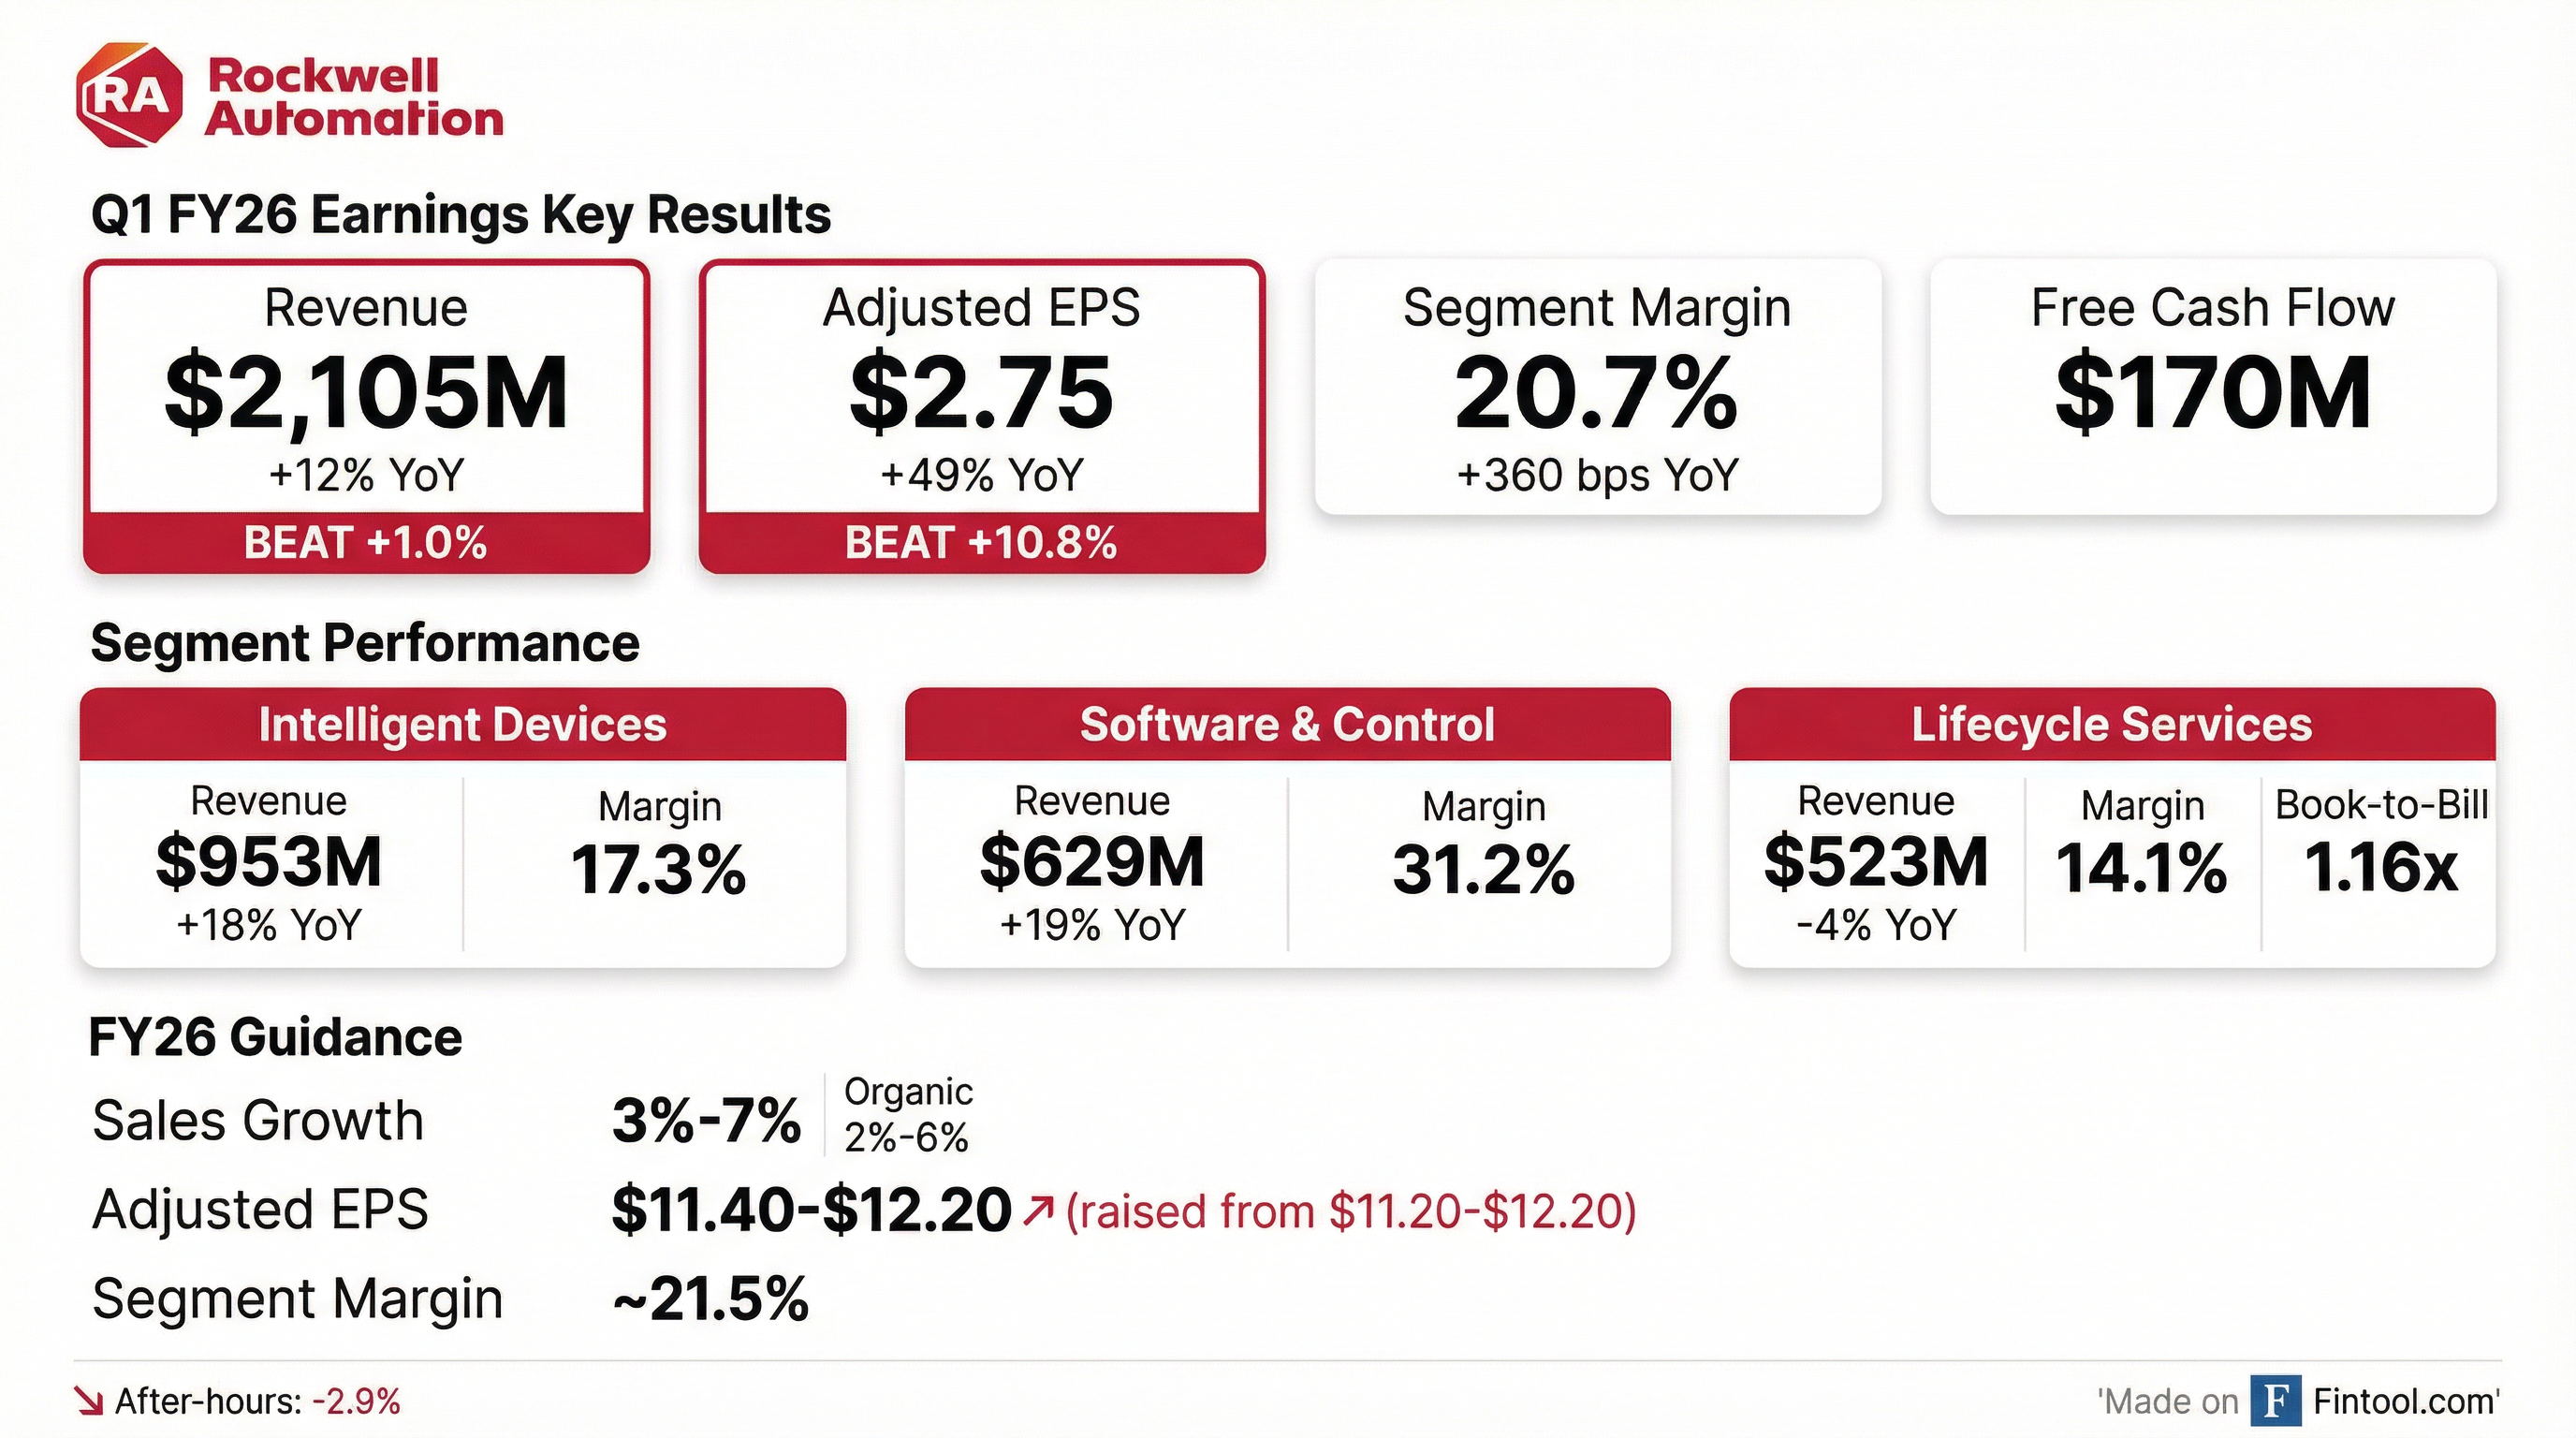
- Q1 reported sales grew 12% YoY, driven by price and currency, with organic sales up in double digits; segment margin was 20.7% and adjusted EPS was $2.75, all above expectations.
- Intelligent Devices achieved 16% organic sales growth, Software & Control grew 17%, and annual recurring revenue increased 7%, while Lifecycle Services declined 6% (Book-to-Bill 1.16).
- Productivity initiatives, price realization, and favorable mix drove 360 bps of segment margin expansion, with tariffs neutral on earnings.
- FY 2026 outlook maintained: 2–6% organic sales growth; adjusted EPS midpoint raised to $11.80; segment margin to expand by 100 bps; free cash flow conversion targeted at ~100%.
- Rockwell Automation delivered $2,105 M in Q1 sales, up 12% YOY driven by 10% organic growth and a 2% currency tailwind.
- Adjusted EPS rose to $2.75, a 49% increase from $1.85 in Q1 FY25.
- Segment operating margin expanded to 20.7%, up 360 bps year-over-year.
- FY26 guidance reaffirmed with 3%–7% reported sales growth, 2%–6% organic growth, and updated adjusted EPS range of $11.40–$12.20.
- Q1 reported sales rose 12% year-over-year, with double-digit organic growth, driving a 20.7% segment margin and $2.75 adjusted EPS, all above expectations.
- By segment, Intelligent Devices organic sales increased 16%, Software & Control grew 17%, while Lifecycle Services declined 6% with a 1.16 book-to-bill ratio.
- Annual recurring revenue grew 7%, Plex achieved its strongest quarter, and major wins included R.H. Sheppard on cloud-native Plex and Hindalco Industries for OT cybersecurity across six plants.
- Fiscal 2026 guidance maintained: organic sales growth of 2–6%, adjusted EPS midpoint raised to $11.80, segment margin expansion over 100 bps, and free cash flow conversion near 100%.
- Rockwell reported Q1 2026 sales up 12% year-over-year, driven by 3% price realization and a 2% currency tailwind, with double-digit organic growth in key segments.
- Total company segment margin expanded 360 bps to 20.7%, and adjusted EPS was $2.75.
- Segment performance: Intelligent Devices organic sales up 16%, Software & Control up 17%, while Lifecycle Services declined 6% with a book-to-bill of 1.16.
- Announced U.S. manufacturing investments, including a new “factory of the future” in New Berlin, WI, and the purchase of its Mequon, WI, facility.
- Maintained FY 2026 guidance: 2–6% organic sales growth, raised adjusted EPS midpoint to $11.80, and expects >100 bps margin expansion with ~100% free cash flow conversion.
- Rockwell Automation reported Q1 FY26 sales of $2,105 M, up 12% y/y; organic sales grew 10%.
- Diluted EPS was $2.69, Adjusted EPS was $2.75, up 67% and 49% y/y, respectively.
- The company reaffirms FY26 reported sales growth guidance of 3–7% and organic sales growth of 2–6%, and updates Adjusted EPS guidance to $11.40–$12.20.
- Executed Q1 share repurchases of 0.4 M shares at a cost of $154 M, with $773 M remaining under authorization.
- Rockwell Automation reported Q1 FY2026 sales of $2.105 B, up 12% year-over-year (organic +10%).
- GAAP diluted EPS of $2.69 (+67% yoy) and adjusted EPS of $2.75 (+49% yoy).
- Total ARR grew 7% compared to Q1 FY2025.
- Updated FY 2026 EPS guidance to $10.75–$11.55 (GAAP) and $11.40–$12.20 (adjusted).
- Rockwell Automation reaffirmed its founding partnership with the University of Wisconsin–Milwaukee’s Connected Systems Institute with a $1 million commitment over five years (bringing its total investment to $5 million since 2017).
- The company plans a new one-million-square-foot manufacturing site in Southeast Wisconsin as part of a $2 billion investment in plants, digital infrastructure, and talent.
- The collaboration focuses on workforce development through hands-on learning in AI, robotics, and software-defined automation to prepare the future manufacturing workforce.
- Over the past year, 500 students engaged in CSI programs, advanced controls course capacity rose 30%, and CSI-supported students completed 15 industry-directed projects and launched a new MS in Connected Systems Engineering.
- $1.5 billion five-year unsecured revolving credit facility signed November 18, 2025, with a $750 million upsizing option and two one-year extension options.
- Facility replaces the prior June 29, 2022 $1.5 billion credit agreement, terminated early with no penalty.
- Loans bear interest at base rate plus a 0.00%–0.125% margin or term SOFR plus a 0.695%–1.125% margin, tied to senior unsecured debt ratings.
- Covenants include a minimum 3.0× interest coverage ratio (Consolidated EBITDA/Interest Expense for any four consecutive quarters) and customary debt‐financing provisions, with no dividend restrictions.
- Strong topline momentum: expecting FY26 capacity orders up strong double-digits and targeting 6–9% annual growth through the cycle via expanded ARR, share gains, and acquisitions.
- FY26 financial guidance: sales of ~$8.8 B (vs. $8.3 B in FY25), organic growth 2–6%, segment operating margin ~21.5%, and adjusted EPS $11.20–$12.20.
- Margin expansion roadmap: driving price discipline and productivity to deliver $325 M incremental benefit, with medium-term targets of 22–24% product margins, 31–34% software margins, and 13–15% services margins.
- Capital allocation & investments: capex at 2.5–4% of sales, free cash flow ~100% of adjusted income, maintain “A” credit rating (adj. debt/EBITDA ~2.0×), invest in next-gen motor control and cloud-native software, and target 1 pt annual growth from acquisitions.
- Management reaffirmed a mid-single-digit revenue growth outlook and +100 bps margin expansion for FY 2026, supported by 2 points of price realization (1 pt underlying, 1 pt tariff).
- Annual Recurring Revenue now exceeds 10% of total revenue and is more profitable than company average; expects high single-digit profitable ARR growth in FY 2026.
- Achieved $435 million in structural cost savings over 18 months and rolled out cost-to-produce metrics plus a unified ROI model to institutionalize margin discipline.
- Plans 3% of sales capital expenditure for FY 2026 (up from 2–2.5%), within a new 2.5–4% range, including $2 billion of investments over five years to modernize digital infrastructure and manufacturing.
- Announced a 100-acre greenfield plant in southeastern Wisconsin using digital-twin design with a low double-digit ROI; insourcing projects (e.g., motor contactor housing) to save ~$1 million in FY 2026.
Quarterly earnings call transcripts for ROCKWELL AUTOMATION.
Ask Fintool AI Agent
Get instant answers from SEC filings, earnings calls & more