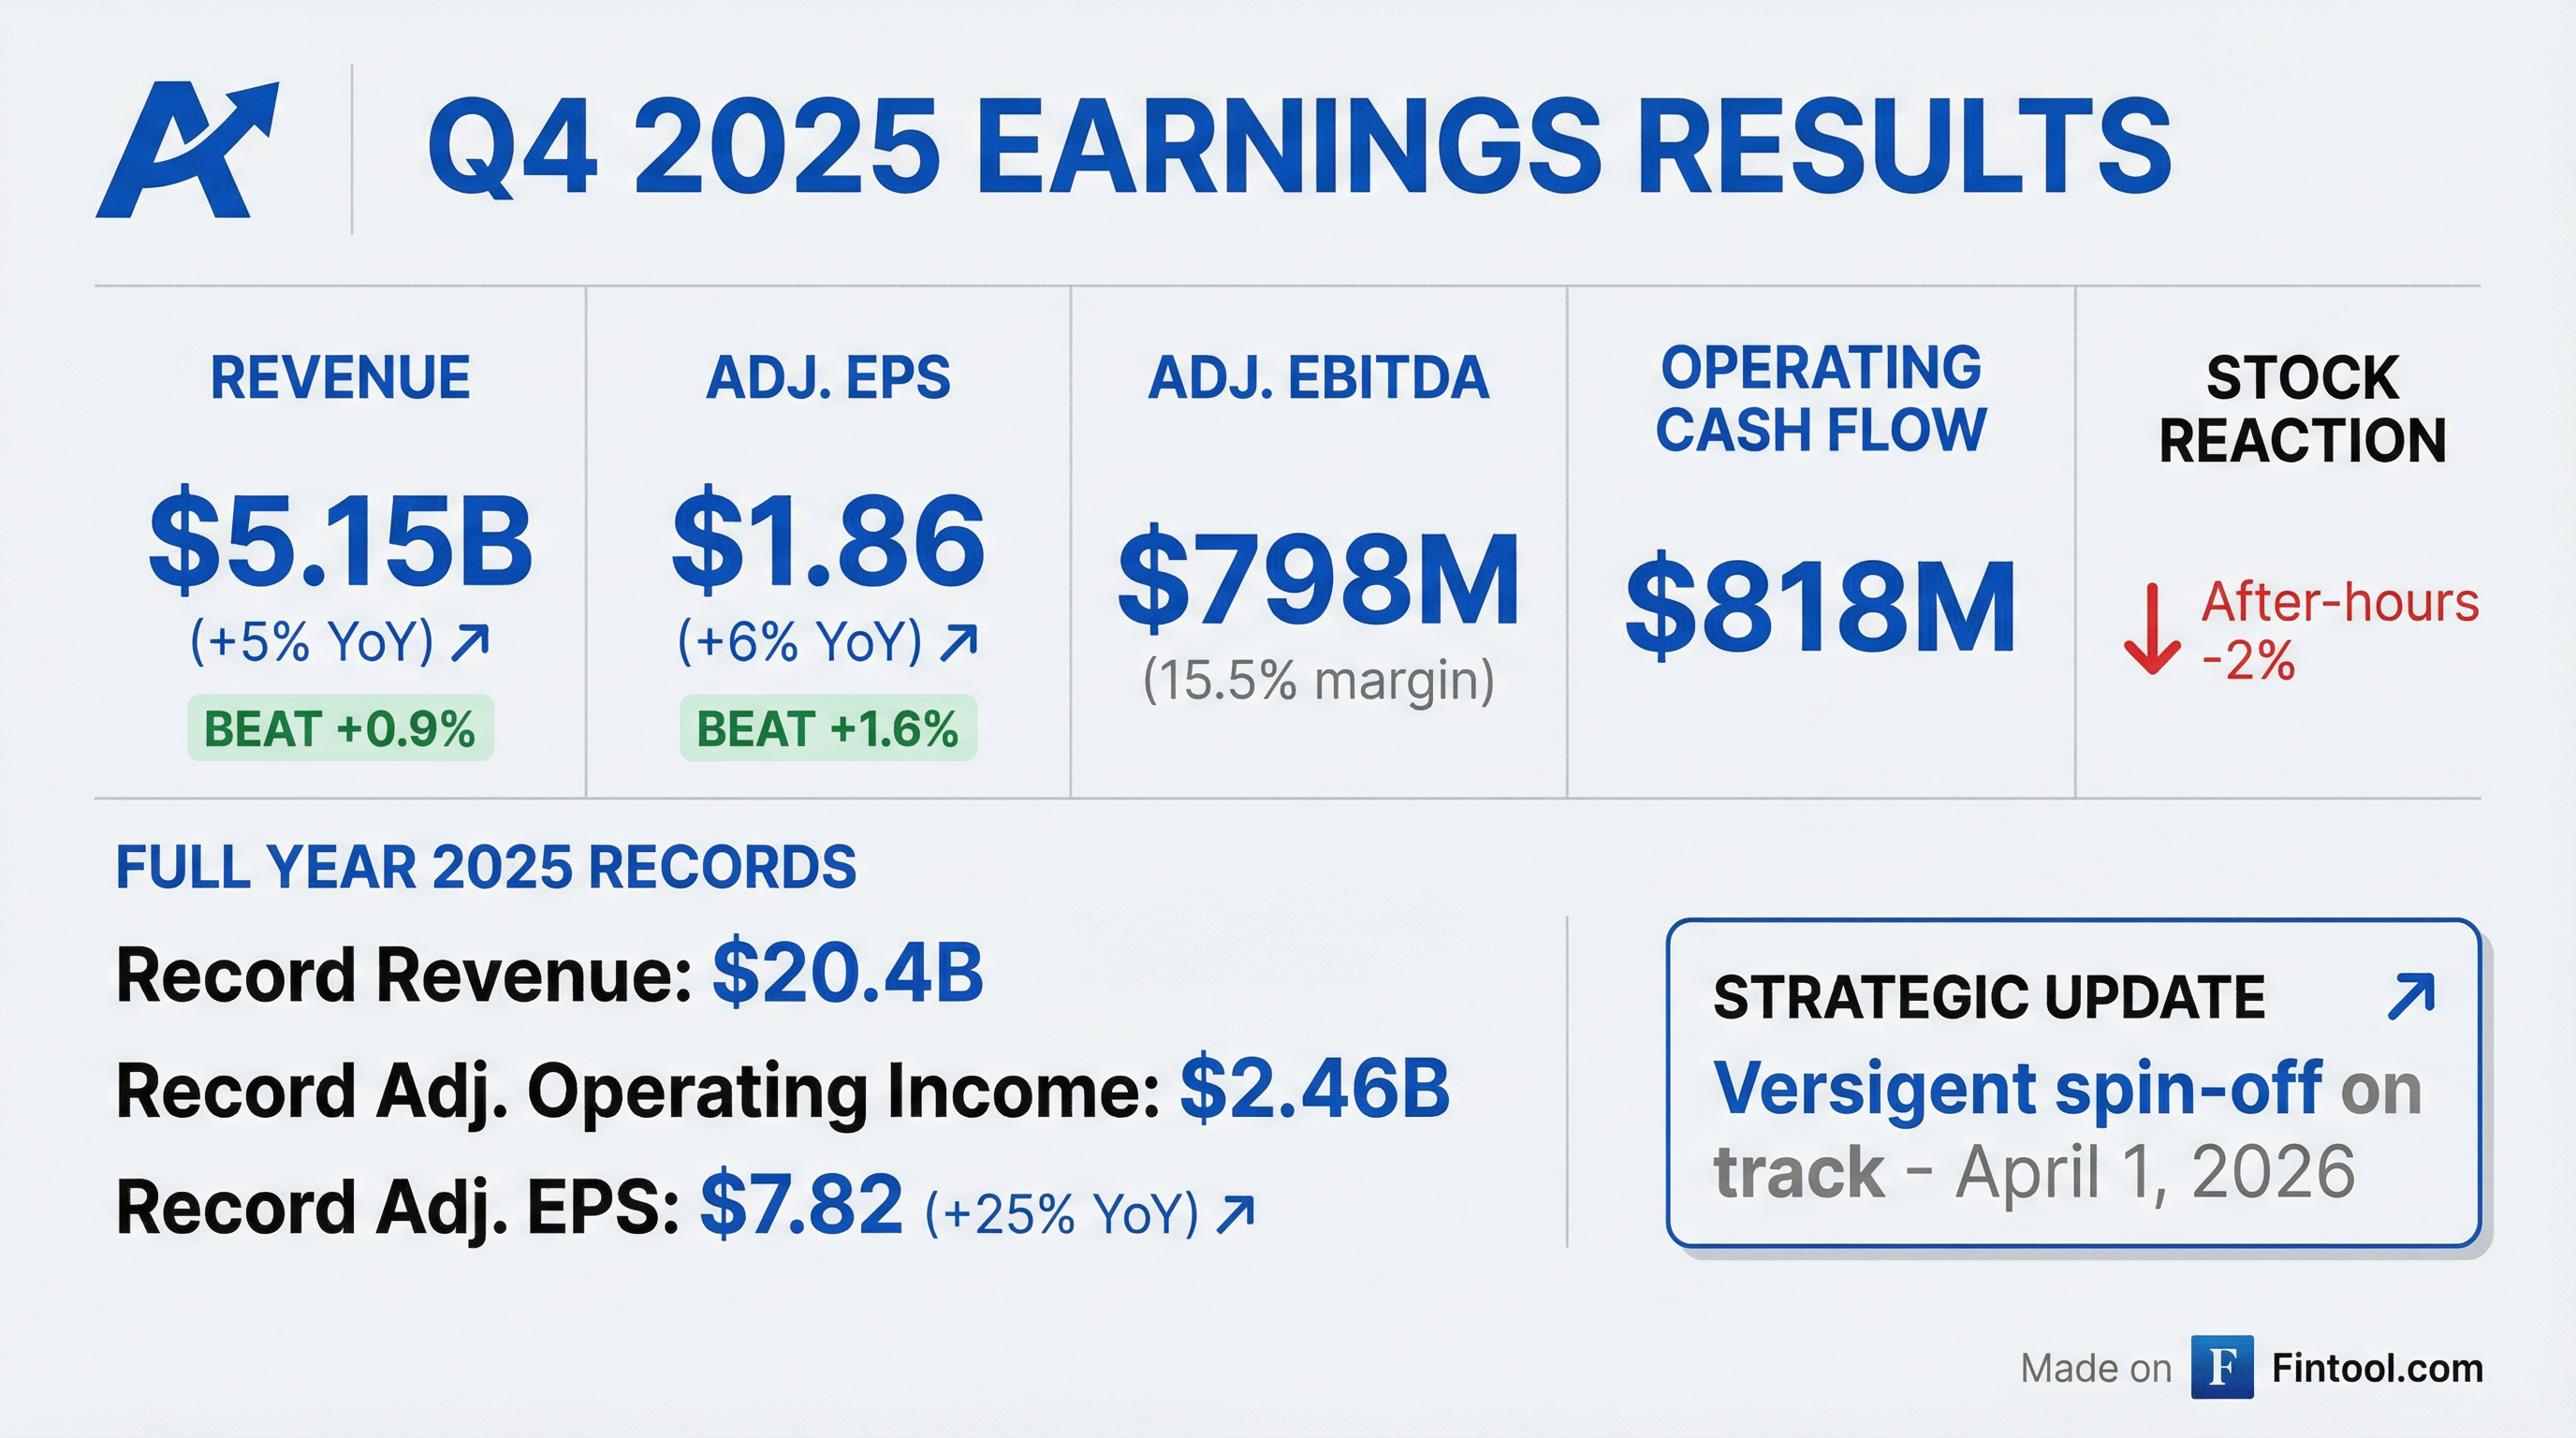
Earnings summaries and quarterly performance for Aptiv.
Executive leadership at Aptiv.
Kevin Clark
Chair and Chief Executive Officer
Javed Khan
President, Software and Advanced Safety and User Experience
Joseph Liotine
Executive Vice President, Electrical Distribution Systems
Joseph Massaro
Vice Chairman, Engineered Components Group
Katherine Ramundo
Executive Vice President, Chief Legal Officer, Chief Compliance Officer and Secretary
Obed Louissaint
Executive Vice President and Chief People Officer
Varun Laroyia
Executive Vice President and Chief Financial Officer
Board of directors at Aptiv.
Research analysts who have asked questions during Aptiv earnings calls.
Dan Levy
Barclays PLC
7 questions for APTV
Colin Langan
Wells Fargo & Company
6 questions for APTV
Mark Delaney
The Goldman Sachs Group, Inc.
6 questions for APTV
Emmanuel Rosner
Wolfe Research
5 questions for APTV
Joseph Spak
UBS Group AG
5 questions for APTV
Chris McNally
Evercore ISI
4 questions for APTV
Itay Michaeli
TD Cowen
4 questions for APTV
James Picariello
BNP Paribas
3 questions for APTV
John Murphy
Bank of America
2 questions for APTV
Tom Narayan
RBC Capital Markets
2 questions for APTV
Adam Jonas
Morgan Stanley
1 question for APTV
Edison Yu
Deutsche Bank
1 question for APTV
Gautam Narayan
RBC Capital Markets
1 question for APTV
James Piccirillo
BNP Paribas
1 question for APTV
Joe Spak
UBS Group AG
1 question for APTV
Joseph Robert Spak
UBS Investment Bank
1 question for APTV
Shreyas Patil
Wolfe Research, LLC
1 question for APTV
Winnie Dong
Deutsche Bank
1 question for APTV
Recent press releases and 8-K filings for APTV.
- On March 6, 2026, Aptiv’s subsidiary commenced a cash tender offer for up to $1.35 billion aggregate principal of its 3.250% 2032, 5.150% 2034, 5.750% 2054, 5.400% 2049, 4.400% 2046, 4.150% 2052 and 3.100% 2051 Senior Notes.
- The offer is conditioned on the spin-off of Aptiv’s Electrical Distribution Systems business into Versigent and on receipt of at least $1.7 billion special dividend from Versigent.
- Aptiv also intends to conditionally redeem the $401 million of 4.650% Senior Notes due 2029 at a make-whole premium, expected April 7, 2026, subject to the same conditions.
- Notes will be accepted based on Acceptance Priority Levels and Series Caps, with early tenderers receiving a $30 per $1,000 premium; the tender expires April 3, 2026, with settlement on April 7, 2026.
- Aptiv Swiss Holdings Limited commenced a cash tender offer to repurchase up to $1.35 billion aggregate principal amount of seven series of senior notes maturing between 2032 and 2054.
- Each $1,000 principal amount of notes validly tendered before March 19, 2026 will receive an early tender premium of $30 plus a fixed spread over reference U.S. Treasury yields; late tenders receive the total consideration minus the $30 premium.
- Purchases follow a seven-level acceptance priority schedule, are subject to series-specific caps and the overall maximum consideration, expire on April 3, 2026 (settlement expected April 7, 2026), and may be extended or amended.
- The offer is conditioned on completing Aptiv’s Spin-Off of Versigent and receiving at least $1.7 billion special dividend from Versigent on or prior to settlement.
- The Aptiv board has approved the spin-off of its Electrical Distribution Systems business into a new public company, Versigent, with a record date of March 17, 2026 and an effective distribution date of April 1, 2026 for shareholders.
- Shareholders will receive one Versigent share for every three Aptiv shares held as of the record date, with cash paid in lieu of any fractional shares.
- Versigent’s ordinary shares are expected to list on the NYSE under ticker VGNT, trading “when-issued” around March 27, 2026, and commencing regular way trading on April 1, 2026.
- No action or payment by Aptiv shareholders is required to participate in the spin-off.
- The Board approved spinning off its Electrical Distribution Systems business into a new public company, Versigent, with a record date of March 17, 2026 and a distribution effective April 1, 2026, at a ratio of one Versigent share for every three Aptiv shares (fractions paid in cash).
- Versigent is expected to list on the NYSE under ticker VGNT, trading when-issued around March 27, 2026 (VGNT WI) and regular-way on April 1, 2026.
- No action or payment is required from Aptiv shareholders to receive Versigent shares in the spin-off.
- The distribution is subject to customary conditions described in Versigent’s Form 10 registration statement.
- Aptiv subsidiaries Cyprium Corporation and Cyprium Holdings Luxembourg priced an upsized $1.6 billion private offering of senior notes: $800 million 6.125% notes due 2031 and $800 million 6.375% notes due 2034.
- The offering size was increased by $100 million from the previously announced $1.5 billion and is expected to close on March 18, 2026, subject to customary conditions.
- The co-issuers also secured an $850 million senior secured revolving credit facility and a $500 million term loan; proceeds and borrowings will fund a dividend to Aptiv leaving Versigent with $400 million of retained cash, with note proceeds held in escrow pending completion of the spin-off.
- Subsidiaries Cyprium Corporation and Cyprium Holdings Luxembourg priced an upsized $1.6 billion private offering of senior notes: $800 million 6.125% notes due 2031 and $800 million 6.375% notes due 2034.
- The offering size increased by $100 million from the previously announced $1.5 billion and is expected to close on March 18 2026.
- The Co-Issuers also secured an $850 million revolving credit facility and a $500 million term loan facility.
- Proceeds will fund a dividend to Aptiv, leaving Versigent with $400 million of cash post-spin-off.
- Aptiv PLC’s Electrical Distribution Systems spin-off subsidiaries, Cyprium Corporation and Cyprium Holdings Luxembourg, launched a $1.5 billion private offering of senior notes due 2031 and 2034 to qualified institutional and non-U.S. investors.
- The financing package also includes an $850 million senior secured revolving credit facility and a $500 million senior secured term loan, with proceeds used to pay a dividend to Aptiv and leave Versigent Limited with $300 million in cash post-transaction.
- The notes are offered under Rule 144A to qualified institutional buyers and under Regulation S to persons outside the United States, exempt from SEC registration.
- Aptiv will spin off its EDS unit as Versigent at the end of Q1, refocusing new Aptiv on intelligent systems (software stack, advanced compute, sensor suite) and interconnect solutions; new Aptiv derives 25% of revenue from non-automotive markets versus 10% for EDS.
- 2026 revenue growth guidance of 3% (2% organic), outpacing light-vehicle production by 3–4 points, underpinned by $25–30 billion of bookings over recent years, the removal of 2025 program cancellations, and strong wins with China domestic OEMs (≈80% of bookings) and non-China APAC customers.
- Software revenue of $600 million (~5% of new Aptiv) is projected to grow in the mid-teens, driven by Wind River’s embedded and cloud solutions alongside automotive ADAS and in-cabin software upgrades.
- Industrial (non-auto) bookings run at $4 billion annually in markets growing 8–10%, led by commercial vehicles (notably delivery vans) and broader industrial applications.
- New Aptiv achieves 26–27% incremental EBITDA from sales volume, supported by supply-chain performance programs, footprint consolidation, and cost-efficiency initiatives to sustain margin expansion.
- Aptiv will spin off its Electronic & Power Distribution Systems (EDS) business into a standalone company named Versigent at the end of Q1 2026, leaving New Aptiv focused on intelligent systems (software stacks, advanced compute and sensor suites) and interconnect solutions for automotive and industrial markets.
- Growth outlook is anchored by $25–30 billion of multi-year bookings, the abatement of three China program cancellations and a large legacy UX program in 2026, plus $4 billion of non-automotive bookings in industrial markets growing at 8–10% CAGR.
- China revenue is expected to grow across all segments in 2026, supported by nearly 80% local OEM bookings, a $300 million export run rate from domestic OEMs and expanding wins in Japan, Korea and India (current APAC non-China baseline of $1.5 billion on $4 billion bookings).
- New Aptiv aims to expand margins via 26–27% incremental EBITDA on volume growth, continued supply-chain performance, footprint consolidation and operational improvements that overcame over 100 bps of FX and commodity headwinds in 2025.
- The company will pursue bolt-on M&A in interconnects and minority investments in software to strengthen adjacent markets, leveraging Wind River’s embedded and enterprise solutions and its legacy interconnect portfolio to enter aerospace, defense, telecom/datacom and robotics/drones.
- Aptiv will spin off its EDS business into Versigent by end of Q1 2026, refocusing new Aptiv on intelligent systems (software stack, advanced compute, sensors) and interconnect solutions for higher margin growth.
- Guides 3% revenue growth in 2026 (2% organic), outpacing light vehicle production through robust $25–30 billion of multi-year bookings, abatement of China program cancellations, and expanded non-China APAC OEM wins.
- Targets mid-teens growth in $600 million software and services revenue, led by Wind River real-time operating systems, enterprise cloud solutions, and ADAS/in-cabin software features.
- Non-automotive bookings average $4 billion annually, driven by high-growth industrial (8–10% market growth) and commercial vehicle segments, diversifying Aptiv’s revenue base.
- Pursuing bolt-on M&A to augment its interconnect portfolio for non-automotive applications and selective software partnerships to deliver accretive growth and synergies.
Fintool News
In-depth analysis and coverage of Aptiv.

Quarterly earnings call transcripts for Aptiv.
Ask Fintool AI Agent
Get instant answers from SEC filings, earnings calls & more