Earnings summaries and quarterly performance for CHURCH & DWIGHT CO INC /DE/.
Executive leadership at CHURCH & DWIGHT CO INC /DE/.
Richard Dierker
President and Chief Executive Officer
Brian Buchert
Executive Vice President of Strategy, M&A and Business Partnerships
Carlen Hooker
Executive Vice President, Chief Commercial Officer
Carlos Linares
Executive Vice President, Chief Technology Officer & Global New Product Innovation
Carlos Ruiz Rabago
Executive Vice President, Chief Supply Chain Officer
Joseph Longo
Vice President, Controller and Chief Accounting Officer
Kevin Gokey
Executive Vice President, Chief Information Officer
Lee McChesney
Executive Vice President, Chief Financial Officer
Michael Read
Executive Vice President, International
Patrick de Maynadier
Executive Vice President, General Counsel and Secretary
Rene Hemsey
Executive Vice President, Chief Human Resources Officer
Surabhi Pokhriyal
Executive Vice President, Chief Digital Growth Officer
Board of directors at CHURCH & DWIGHT CO INC /DE/.
Arthur Winkleblack
Director
Bradlen Cashaw
Director
Bradley Irwin
Director
Janet Vergis
Director
Laurie Yoler
Director
Michael Smith
Director
Penry Price
Director
Ravichandra Saligram
Chair of the Board
Robert Shearer
Director
Susan Saideman
Director
Research analysts who have asked questions during CHURCH & DWIGHT CO INC /DE/ earnings calls.
Andrea Teixeira
JPMorgan Chase & Co.
6 questions for CHD
Anna Lizzul
Bank of America Corporation
6 questions for CHD
Rupesh Parikh
Oppenheimer & Co. Inc.
6 questions for CHD
Bonnie Herzog
Goldman Sachs
5 questions for CHD
Filippo Falorni
Citigroup Inc.
5 questions for CHD
Christopher Carey
Wells Fargo & Company
4 questions for CHD
Dara Mohsenian
Morgan Stanley
4 questions for CHD
Kevin Grundy
BNP Paribas
4 questions for CHD
Lauren Lieberman
Barclays
4 questions for CHD
Olivia Tong Cheang
Raymond James Financial, Inc.
4 questions for CHD
Peter Grom
UBS Group
4 questions for CHD
Javier Escalante Manzo
Evercore ISI
3 questions for CHD
Robert Moskow
TD Cowen
3 questions for CHD
Stephen Robert Powers
Deutsche Bank
3 questions for CHD
Chris Carey
Wells Fargo Securities
2 questions for CHD
Nik Modi
RBC Capital Markets
2 questions for CHD
Olivia Tong
Raymond James
2 questions for CHD
Jefferies Analyst
Jefferies Financial Group Inc.
1 question for CHD
Karen Wolfe
Piper Sandler
1 question for CHD
Kaumil Gajrawala
Jefferies
1 question for CHD
Korinne Wolfmeyer
Piper Sandler & Co.
1 question for CHD
Mark Astrachan
Stifel
1 question for CHD
Philip Gorham
Citi
1 question for CHD
Steve Powers
Deutsche Bank
1 question for CHD
William Chappell
Truist Securities
1 question for CHD
Recent press releases and 8-K filings for CHD.
- 2025 recap: Church & Dwight grew faster than its categories despite volatility, reduced a $190 million tariff impact to $28 million, and reshaped its portfolio by divesting Spinbrush, the vitamin business, Flawless and the Waterpik shower head, resulting in 1% consumption growth (or 3.5% excluding divested brands).
- Balanced portfolio: A $6.2 billion company with seven Power Brands (ARM & HAMMER, TheraBreath, Hero, Touchland, Waterpik, Batiste, OxiClean), 75% U.S. sales, 18% international, 25% e-commerce, and 5% private-label exposure post-portfolio actions.
- Growth initiatives: Targeting to grow ARM & HAMMER from $2 billion to $3 billion, expand TheraBreath from $1 billion to $1.5 billion, and scale international from $1 billion to $2 billion through organic innovation and M&A.
- 2026 guidance: Organic growth of 3–4%, total sales down 1.5–0.5% due to divestitures, 100 bps gross-margin improvement, 5–8% EPS growth, and $1.15 billion in free cash flow.
- In 2025, Church & Dwight grew faster than its categories, reduced tariff impact from $190 M to $28 M through portfolio actions and supply-chain moves, generated record $1.2 B free cash flow and returned $900 M to shareholders.
- For 2026, management reaffirmed its Evergreen Model with 3–4% organic growth, –1.5– –0.5% total sales impact from divestitures, 100 bp gross margin expansion and 5–8% adjusted EPS growth.
- Key growth initiatives target scaling ARM & HAMMER from $2 B to $3 B, TheraBreath from $1 B to $1.5 B, and international sales from $1 B to $2 B, driven by innovation and M&A.
- Recent portfolio reshaping includes divesting Spinbrush, the vitamin business, Flawless and Waterpik shower heads, alongside the acquisition of Touchland to bolster the core portfolio.
- The company emphasizes an asset-light, low-headcount model to maintain agility and a disciplined M&A pipeline to enhance shareholder returns.
- 2026 Guidance Update: Organic growth of 3%–4%, total sales down 1.5%–0.5% due to portfolio exits, 100 bp gross margin expansion, 5%–8% EPS growth, and $1.15 billion free cash flow.
- Growth Initiatives: Plans to expand ARM & HAMMER from $2 billion to $3 billion, TheraBreath from $1 billion to $1.5 billion, and international sales from $1 billion to $2 billion.
- Portfolio & Cost Actions: Mitigated $190 million in tariffs down to $28 million and completed divestitures of Spinbrush, the vitamin business, Flawless, and Waterpik shower heads to sharpen focus.
- 2025 Performance: Outpaced category growth in all three segments, delivered a record $1.2 billion cash flow, returned $900 million to shareholders, and ended with 1.5x net leverage.
- In 2025 CHD grew faster than its categories across all three divisions, gained share in 4 of 8 power brands, and closed strategic acquisitions including Touchland.
- The company ended FY 2025 as a $6.2 billion enterprise (77% domestic, 18% international, 5% SPD) with 1.5× leverage, over $5 billion in liquidity, and announced a 4.2% dividend increase.
- For 2026 CHD targets 3% US organic growth, aiming to expand Arm & Hammer from $2 billion to $3 billion, TheraBreath from $1 billion to $1.5 billion, and double international sales to $2 billion.
- Innovation drives ~50% of growth with 1.5–2% incremental net sales targets, while e-commerce has risen from 2% to 24% of sales via omni-channel and AI initiatives.
- Q4 sales of $1.6 billion were up 3.9%, with organic growth of 0.7% (1.8% ex-VMS), gross margin +90 bps, and EPS of $0.86, +12% YoY.
- Full-year 2025 organic sales grew 0.7% (2.0% ex-VMS), with record cash flow of $1.2 billion and tariff exposure cut from $190 million to $25 million.
- 2026 guidance: 3–4% organic growth, reported sales down 1.5–0.5% (portfolio exits), gross margin +100 bps, EPS +5–8%, and FCF of $1.15 billion.
- Shareholder returns include a 4.2% dividend increase (125th consecutive year) and continued share buybacks, with leverage at 1.5× EBITDA.
- Q4 2025 sales rose 3.9%, with organic growth of 0.7% (or 1.8% ex-VMS), gross margin up 90 bps, and EPS of $0.86, +12% y/y.
- FY 2025 highlights: $6.2 billion in revenue, 0.7% organic growth (2% ex-VMS), $1.2 billion in free cash flow, 1.5x leverage, and a 4.2% dividend increase for 2026.
- 2026 guidance: organic growth of 3–4%, reported sales down 1.5 to 0.5% (due to divestitures), +100 bps in gross margin, marketing spend at 11%, EPS growth of 5–8%, and $1.15 billion in free cash flow.
- Strategic priorities include expanding Arm & Hammer from $2 billion to $3 billion via a Good-Better-Best portfolio, targeting #1 share in mouthwash and launching TheraBreath toothpaste, sustaining 1.5–2% incremental net-sales growth from innovation, and doubling down on international M&A.
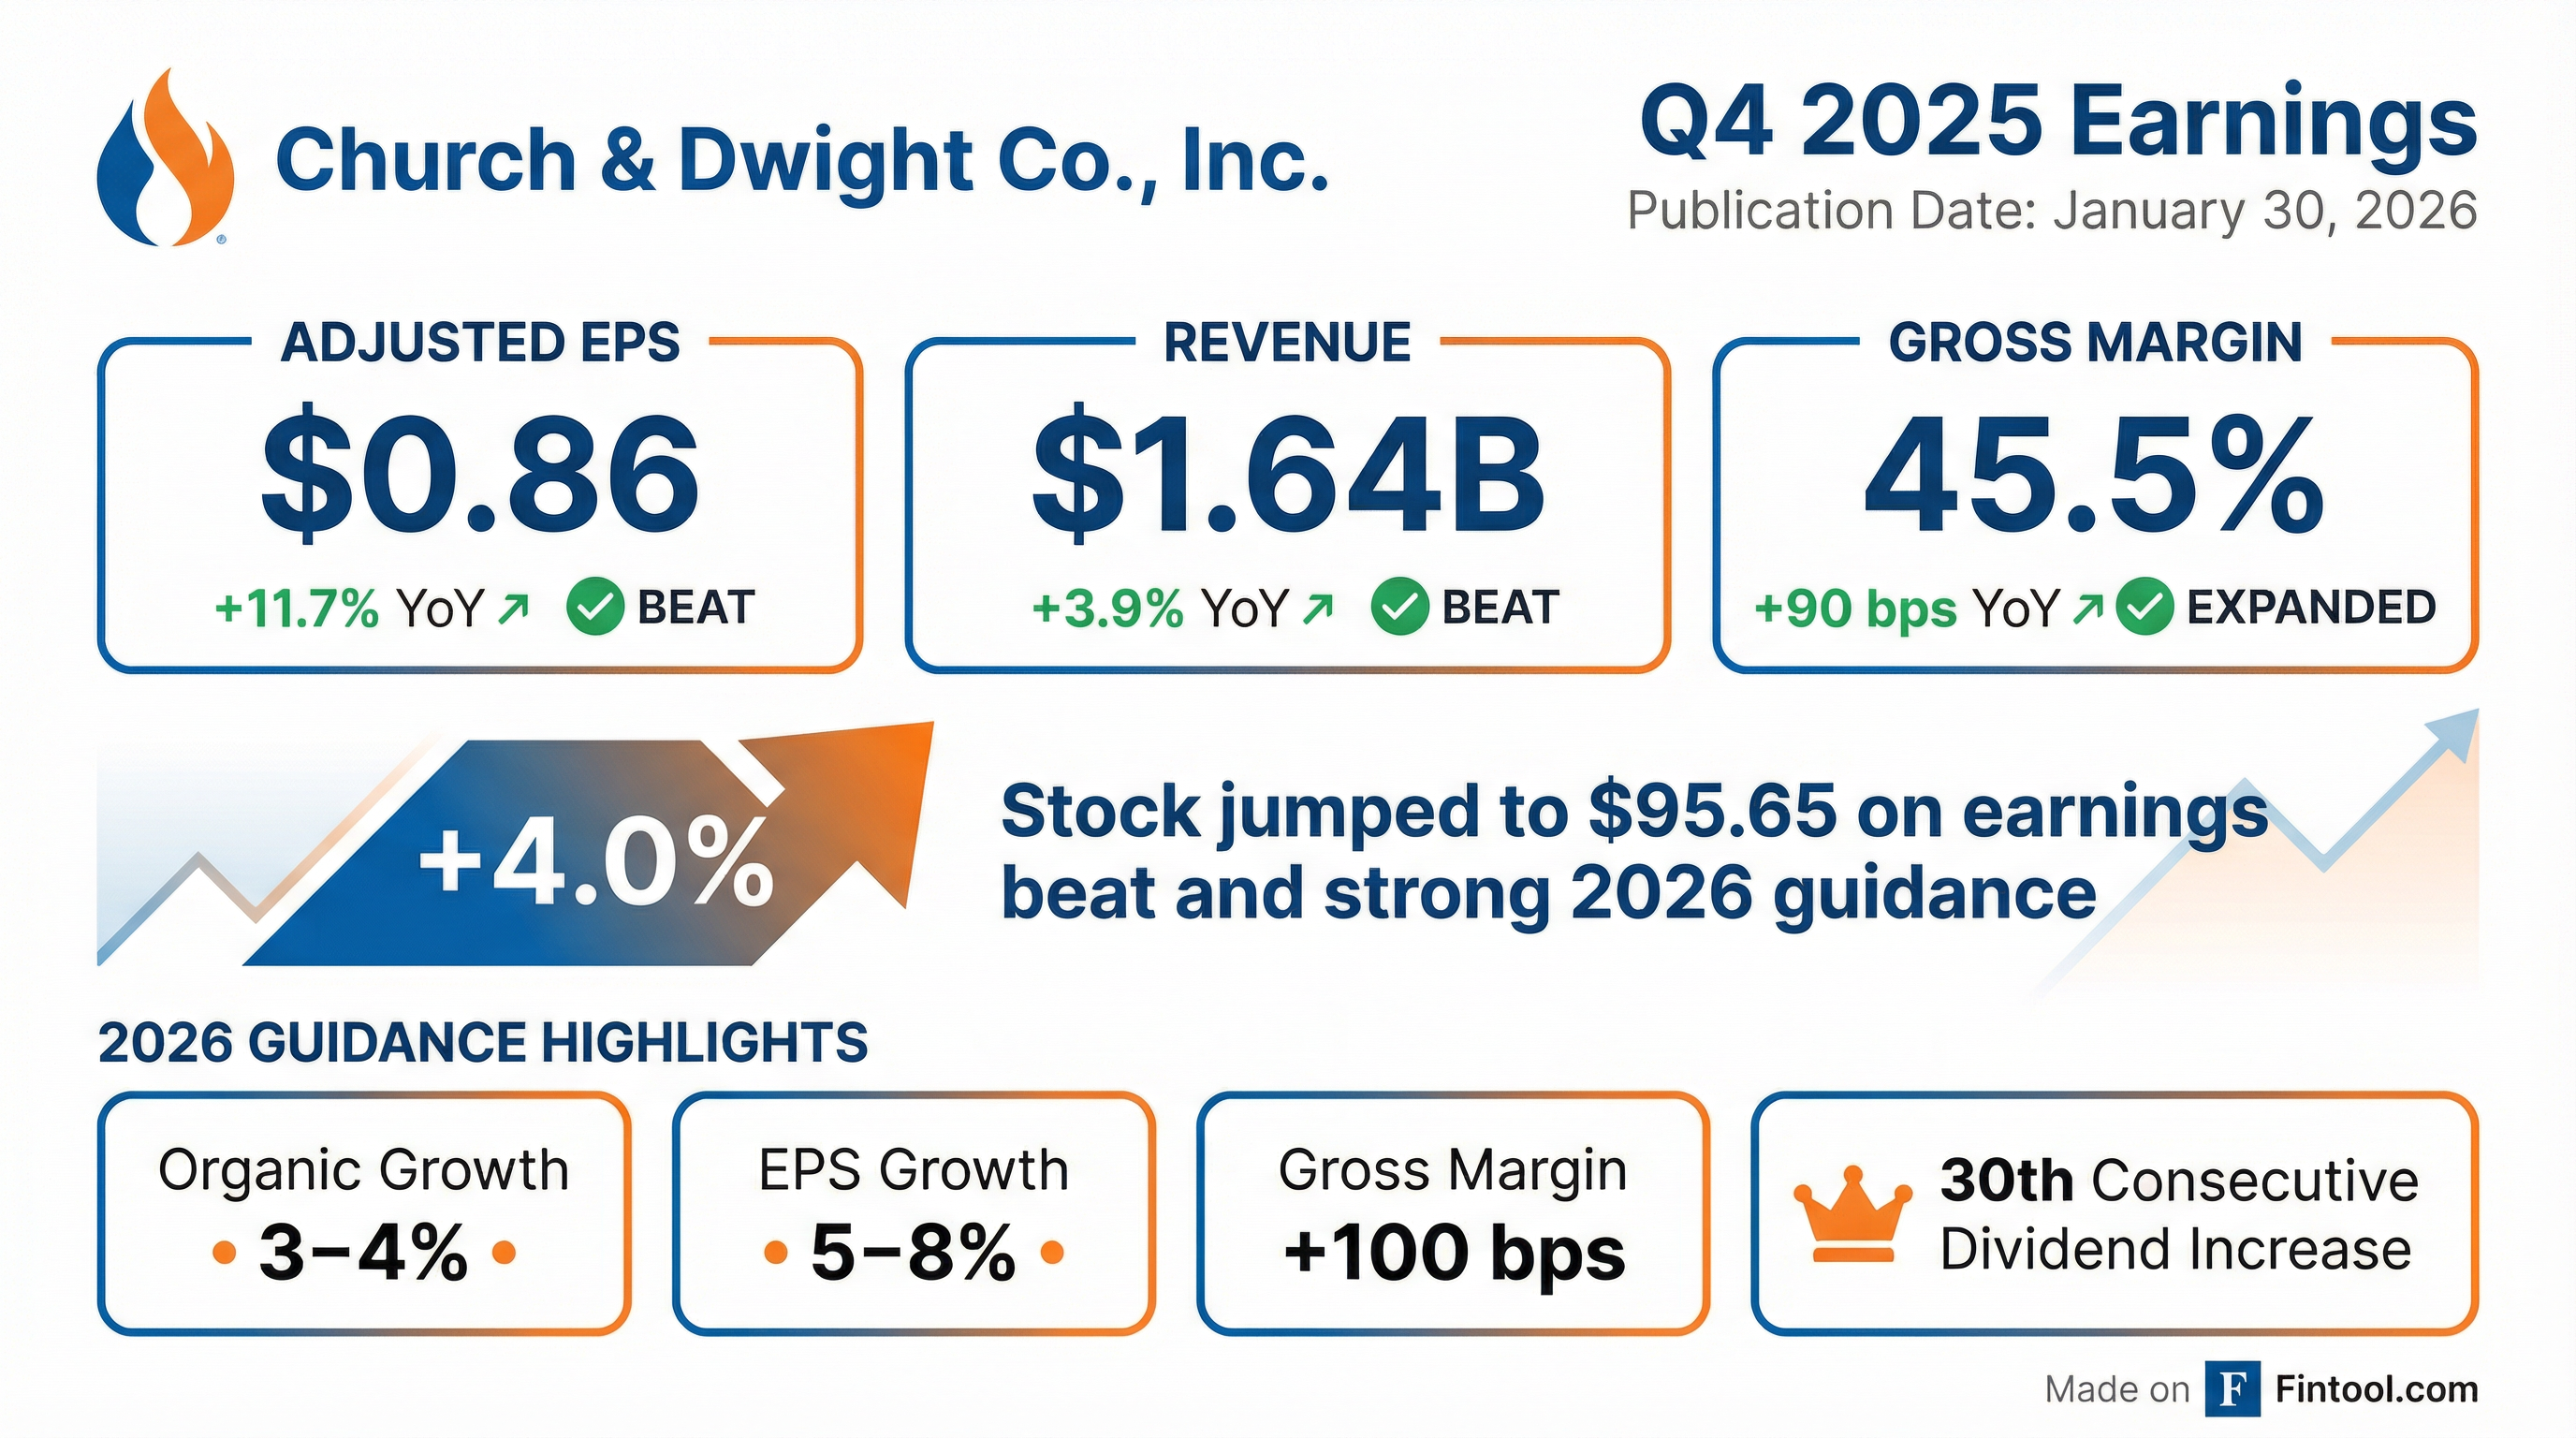
- Q4 2025 net sales of $1,644.2 M (+3.9% YoY; organic +0.7%), adjusted gross margin of 45.5%, adjusted EPS of $0.86 (+11.7%), and cash from operations of $363.4 M.
- FY 2025 net sales of $6,203.2 M (+1.6%; organic +0.7%), adjusted EPS of $3.53 (+2.6%), cash from operations of $1.215 B, and a 4% dividend increase to $1.18 per share.
- 2026 outlook: organic sales growth of 3–4%, adjusted EPS growth of 5–8%, and operating cash flow of $1.15 B, with capex around $130 M.
- Q4 net sales rose 3.9% to $1,644.2 M, with organic sales up 0.7%, adjusted EPS of $0.86 (+11.7%), and cash from operations of $363.4 M
- Full-year 2025 net sales grew 1.6% to $6,203.2 M; adjusted EPS reached $3.53 (+2.6%), and operating cash flow was $1.215 B (+5.1%)
- 2026 outlook targets 3–4% organic sales growth, a 1.5% to 0.5% reported sales decline (exit impact), 100 bps gross margin expansion, and 5–8% adjusted EPS growth
- Q1 2026 guidance projects adjusted EPS of $0.92 per share, with organic sales growth of ~3%
- On December 9, 2025, Church & Dwight announced a definitive agreement to sell its VitaFusion® and L’il Critters® brands, including related trademarks and manufacturing and distribution facilities in Vancouver and Ridgefield, WA, to Piping Rock Health Products, Inc.
- The transaction is subject to customary closing conditions and is expected to close before the end of 2025.
- The VMS brands represent less than 5% of Church & Dwight’s anticipated 2025 net sales.
- Church & Dwight expects to incur a one-time, after-tax charge of $40–45 million in Q4 2025, net of proceeds, impairment, and transaction costs.
- This divestiture will enable Church & Dwight to focus on its core power brands, strengthening its portfolio and growth initiatives.
- Church & Dwight has entered a definitive agreement to sell the VitaFusion and L’il Critters brands to Piping Rock Health Products, including relevant trademarks, licenses and the Vancouver and Ridgefield manufacturing and distribution facilities.
- The transaction, subject to customary closing conditions, is expected to close before the end of 2025.
- These VMS brands account for less than 5% of the company's anticipated 2025 net sales, and the company expects a one-time, after-tax charge of $40–45 million in Q4 2025 for non-cash impairment and transition and transaction costs.
- The divestiture is aimed at strengthening focus on Church & Dwight’s remaining power brands to drive market-leading performance and growth initiatives.
Quarterly earnings call transcripts for CHURCH & DWIGHT CO INC /DE/.
Ask Fintool AI Agent
Get instant answers from SEC filings, earnings calls & more