Earnings summaries and quarterly performance for CMS ENERGY.
Executive leadership at CMS ENERGY.
Garrick Rochow
President and Chief Executive Officer
Brandon Hofmeister
Senior Vice President, Sustainability and External Affairs
LeeRoy Wells Jr.
Senior Vice President, Operations
Rejji Hayes
Executive Vice President and Chief Financial Officer
Shaun Johnson
General Counsel and Senior Vice President, Business Optimization
Board of directors at CMS ENERGY.
Research analysts who have asked questions during CMS ENERGY earnings calls.
Andrew Weisel
Scotiabank
7 questions for CMS
Jeremy Tonet
JPMorgan Chase & Co.
7 questions for CMS
Julien Dumoulin-Smith
Jefferies
7 questions for CMS
Travis Miller
Morningstar
5 questions for CMS
Nicholas Campanella
Barclays
4 questions for CMS
Anthony Crowdell
Mizuho Financial Group
3 questions for CMS
David Arcaro
Morgan Stanley
3 questions for CMS
Shahriar Pourreza
Guggenheim Partners
3 questions for CMS
Chariza
Wells Fargo & Company
2 questions for CMS
Durgesh Chopra
Evercore ISI
2 questions for CMS
Marcella Putterman
Wells Fargo Securities
2 questions for CMS
Michael Sullivan
Wolfe
2 questions for CMS
William Appicelli
UBS
2 questions for CMS
Angie Storozynski
Seaport Research Partners
1 question for CMS
Gregg Orrill
UBS Group AG
1 question for CMS
Julianna Dumlao-Smith
Jefferies
1 question for CMS
Ross Carlo
Bank of America
1 question for CMS
Sophie Karp
KeyBanc Capital Markets Inc.
1 question for CMS
Recent press releases and 8-K filings for CMS.
- 2025 adjusted EPS of $3.61 (+8% YoY); 2026 EPS guidance raised to $3.83–$3.90 (6%–8% growth)
- 5-year utility investment plan increased to $24 billion (+$4 billion), supporting 10.5% rate-base CAGR through 2030
- Approval of 20-year renewable energy plan enabling $14 billion of customer investments over next decade
- Large Load Tariff approved to facilitate data center growth, with first center expected online by 2028
- $3.8 billion of 2025 utility CapEx funded via operating cash flow; targeting ~55% dividend payout and $700 million equity issuance in 2026
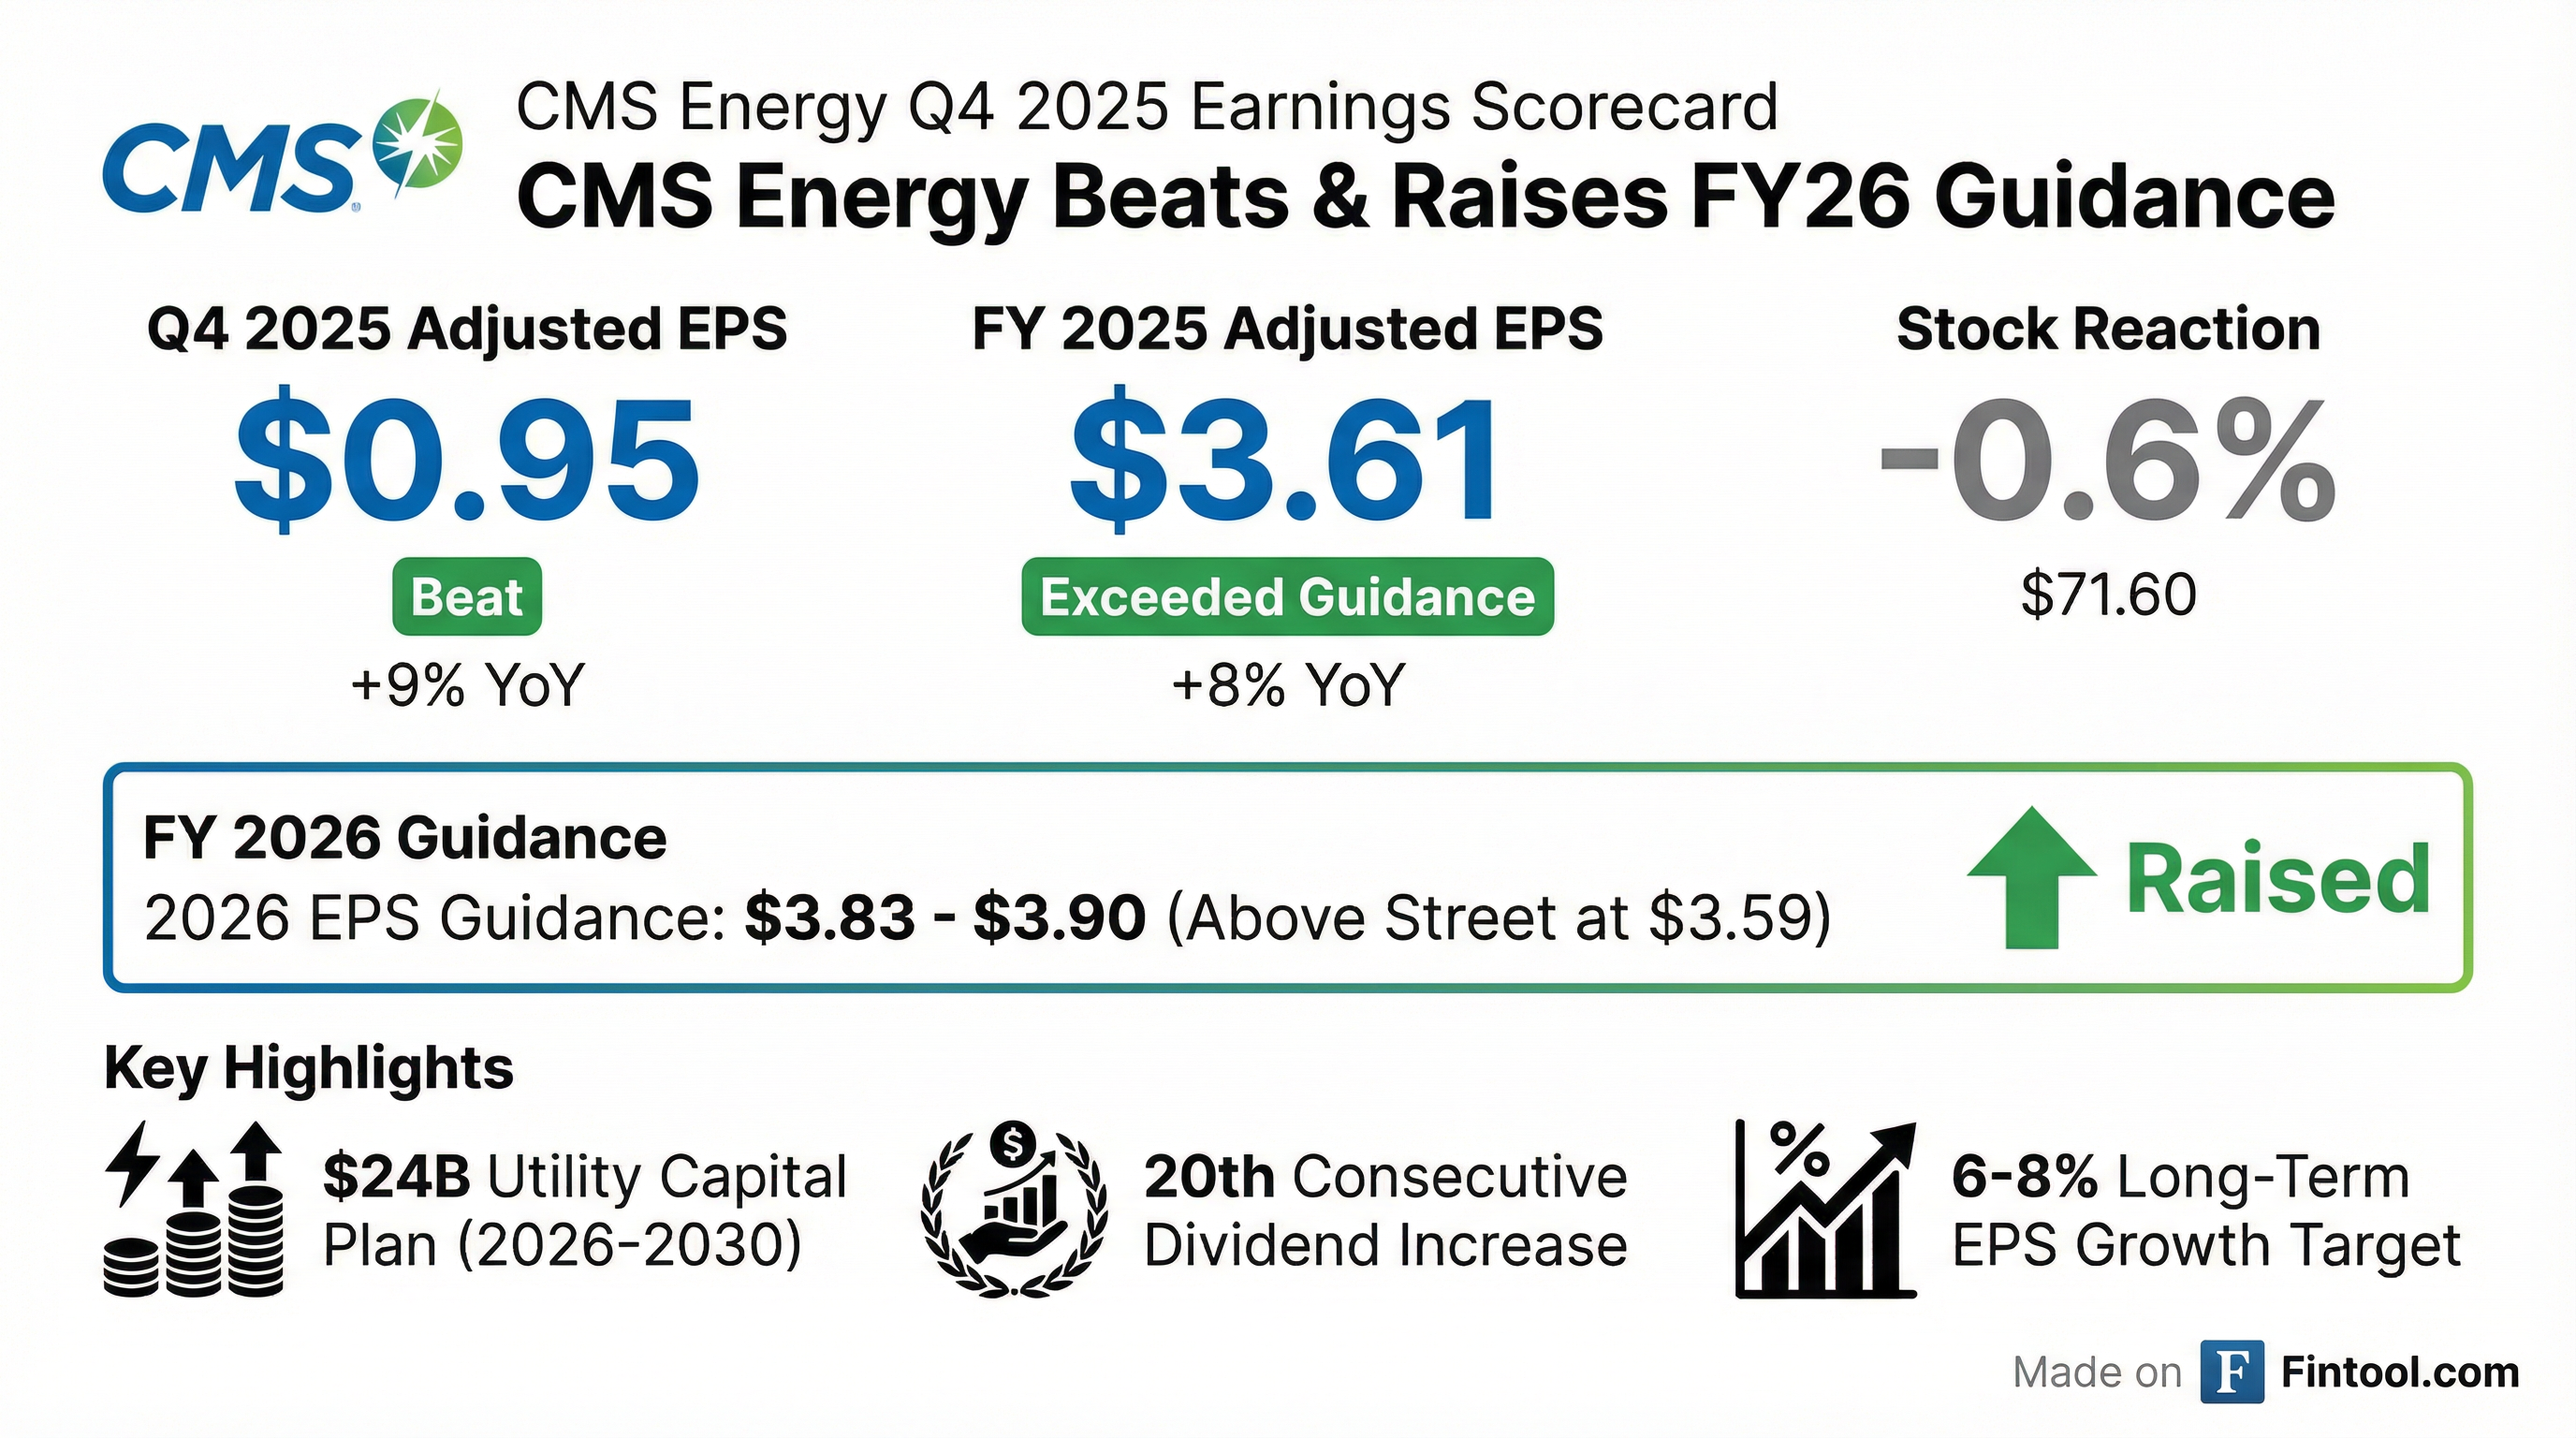
- CMS Energy delivered Q4 2025 adjusted EPS of $3.61, up from $3.34 in Q4 2024.
- For full year 2025, adjusted EPS was $3.61, exceeding guidance and growing >8% year-over-year.
- The board increased the annual dividend to $2.28 per share, marking the 20th consecutive annual raise.
- 2026 guidance includes adjusted EPS of $3.83–$3.90 and a maintained dividend of $2.28 per share.
- CMS Energy delivered 2025 adjusted EPS of $3.61, up over 8% year-over-year and above guidance; 2026 EPS guidance has been raised by $0.03 to $3.83–$3.90, reflecting 6%–8% growth with confidence toward the high end.
- Announced a 5-year, $24 billion utility customer investment plan (up $4 billion), driving ~10.5% rate base CAGR through 2030; plans to fund via $1.7 billion of utility debt and $700 million of ATM equity issuance in 2026.
- Maintains its dividend growth strategy, targeting a ~55% payout ratio over the five-year plan (60% in 2026) while preserving mid-teens credit metrics.
- Secured key regulatory approvals: a November Large Load Tariff, a 20-year renewable energy plan unlocking $14 billion of customer investments, plus storm deferral and PPA incentive mechanisms, underscoring Michigan’s constructive energy regulatory framework.
- Emphasized affordability efforts: self-generation hedges saved customers $250 million in 2025, the energy waste reduction program will yield $1.2 billion in savings, and residential natural gas rates remain 28% below the national average.
- Delivered 2025 adjusted EPS of $3.61, up over 8% from 2024, and raised 2026 EPS guidance to $3.83–$3.90 per share, targeting the high end of 6–8% growth.
- Launched a 5-year $24 billion utility investment plan (up $4 billion), including ~$2.5 billion in generation, $1.2 billion in distribution reliability and $0.4 billion in gas, supporting 10.5% rate base CAGR through 2030.
- Secured key regulatory approvals: a 20-year renewable energy plan unlocking ~$14 billion of solar and wind investments, and a large load tariff to underpin data center growth.
- Advanced data center pipeline with one site’s rate agreement near final and expected to be operational by 2028, alongside talks with additional data center and manufacturing customers.
- The Board of Directors raised the quarterly dividend on common stock to $0.57 per share, up from $0.5425, representing an annualized yield of 3.2% at a closing price of $71.60.
- The first-quarter dividend is payable Feb. 27, 2026, to shareholders of record on Feb. 17, 2026.
- CEO Garrick Rochow said the increase, which equates to an annualized $2.28 per share, reflects strong strategic execution.
- CMS Energy, headquartered in Michigan, operates Consumers Energy and independent power generation businesses.
- CMS Energy reported 2025 EPS of $3.53, up from $3.33 in 2024, and adjusted EPS of $3.61, versus $3.34 a year earlier, driven by outperformance at NorthStar Clean Energy.
- The company raised its 2026 adjusted EPS guidance to $3.83–$3.90 (from $3.80–$3.87) and reaffirmed long-term adjusted EPS growth of 6–8%, targeting the high end of the range.
- CMS Energy increased its annual dividend by $0.11 to $2.28 for 2026, marking its 20th consecutive annual dividend increase.
- Management cited constructive regulatory outcomes, solid Utility cost performance, and strong NorthStar results as key contributors to 2025’s success.
- CMS Energy opposes Attorney General Dana Nessel’s petition for an MPSC rehearing of its Nov. 6 order that set new safeguards for energy-intensive businesses, arguing the challenge “has no merit”.
- The MPSC order imposes a 100 MW minimum threshold for data centers and large-load users to pay tariffs covering their full cost of service and a share of system fixed costs, with only one existing customer exceeding 100 MW.
- CMS Energy asserts new large customers will help reduce costs for its nearly 2 million served homes and businesses by contributing to fixed costs otherwise borne by all customers.
- The company plans to file an updated Energy Supply Plan in 2026 to secure natural gas, renewable resources, and battery storage for projected business growth.
- On November 6, 2025, CMS Energy and The Bank of New York Mellon, as trustee, executed an indenture establishing 3.125% convertible senior notes due May 1, 2031.
- The indenture permits issuance of up to $1.0 billion aggregate principal amount of the notes.
- The notes bear interest at 3.125% per annum, payable semi-annually on May 1 and November 1 (beginning May 1, 2026), and include customary conversion provisions into common stock.
- CMS Energy Corporation priced an upsized offering of $850 million aggregate principal amount of 3.125% convertible senior notes due May 1, 2031, with a $150 million overallotment option.
- Net proceeds are expected to be approximately $839.3 million (or $987.7 million if the option is exercised) and will be used to retire $250 million of 3.60% Senior Notes due November 15, 2025, with remaining proceeds for general corporate purposes.
- The notes bear interest at 3.125% per annum, payable semiannually, and will be convertible into 11.0360 shares of common stock per $1,000 principal amount (initial conversion price approx. $90.61 per share), subject to adjustment.
- The notes are non-redeemable until May 7, 2029; thereafter, CMS Energy may redeem notes if the stock trades at or above 130% of the conversion price for 20 of 30 trading days.
- CMS Energy priced $850 million aggregate principal amount of 3.125% convertible senior notes due 2031, upsized from $750 million with an option for an additional $150 million, expected to close on November 6, 2025.
- Net proceeds are expected to be approximately $839.3 million (or $987.7 million if the option is fully exercised) to retire $250 million of 3.60% Senior Notes due 2025 and for general corporate purposes.
- The notes are senior unsecured obligations bearing 3.125% interest, payable semiannually on May 1 and November 1, maturing on May 1, 2031.
- The initial conversion rate is 11.0360 shares per $1,000 principal (approximately $90.61 per share), representing a 25% premium to the last reported sale price on November 3, 2025.
Quarterly earnings call transcripts for CMS ENERGY.
Ask Fintool AI Agent
Get instant answers from SEC filings, earnings calls & more