Earnings summaries and quarterly performance for XPO.
Executive leadership at XPO.
Board of directors at XPO.
Research analysts who have asked questions during XPO earnings calls.
Brian Ossenbeck
JPMorgan Chase & Co.
9 questions for XPO
Fadi Chamoun
BMO Capital Markets
8 questions for XPO
Jason Seidl
TD Cowen
8 questions for XPO
Jonathan Chappell
Evercore ISI
8 questions for XPO
Jordan Alliger
Goldman Sachs
8 questions for XPO
Ken Hoexter
BofA Securities
8 questions for XPO
Scott Group
Wolfe Research
8 questions for XPO
Christian Wetherbee
Wells Fargo
7 questions for XPO
Stephanie Moore
Jefferies
7 questions for XPO
Ravi Shanker
Morgan Stanley
6 questions for XPO
Richa Harnain
Deutsche Bank
5 questions for XPO
Tom Wadewitz
UBS Group
5 questions for XPO
Scott Schneeberger
Oppenheimer & Co. Inc.
4 questions for XPO
Bascome Majors
Susquehanna Financial Group
3 questions for XPO
Ariel Rosa
Citigroup
2 questions for XPO
Bruce Chan
Stifel Financial Corp.
2 questions for XPO
Christopher Kuhn
The Benchmark Company
2 questions for XPO
Chris Wetherbee
Wells Fargo & Company
2 questions for XPO
Daniel Imbro
Stephens Inc.
2 questions for XPO
J. Bruce Chan
Stifel
2 questions for XPO
Thomas Wadewitz
UBS
2 questions for XPO
Eric Morgan
Barclays
1 question for XPO
Joseph Lawrence Hafling
Jefferies
1 question for XPO
Recent press releases and 8-K filings for XPO.
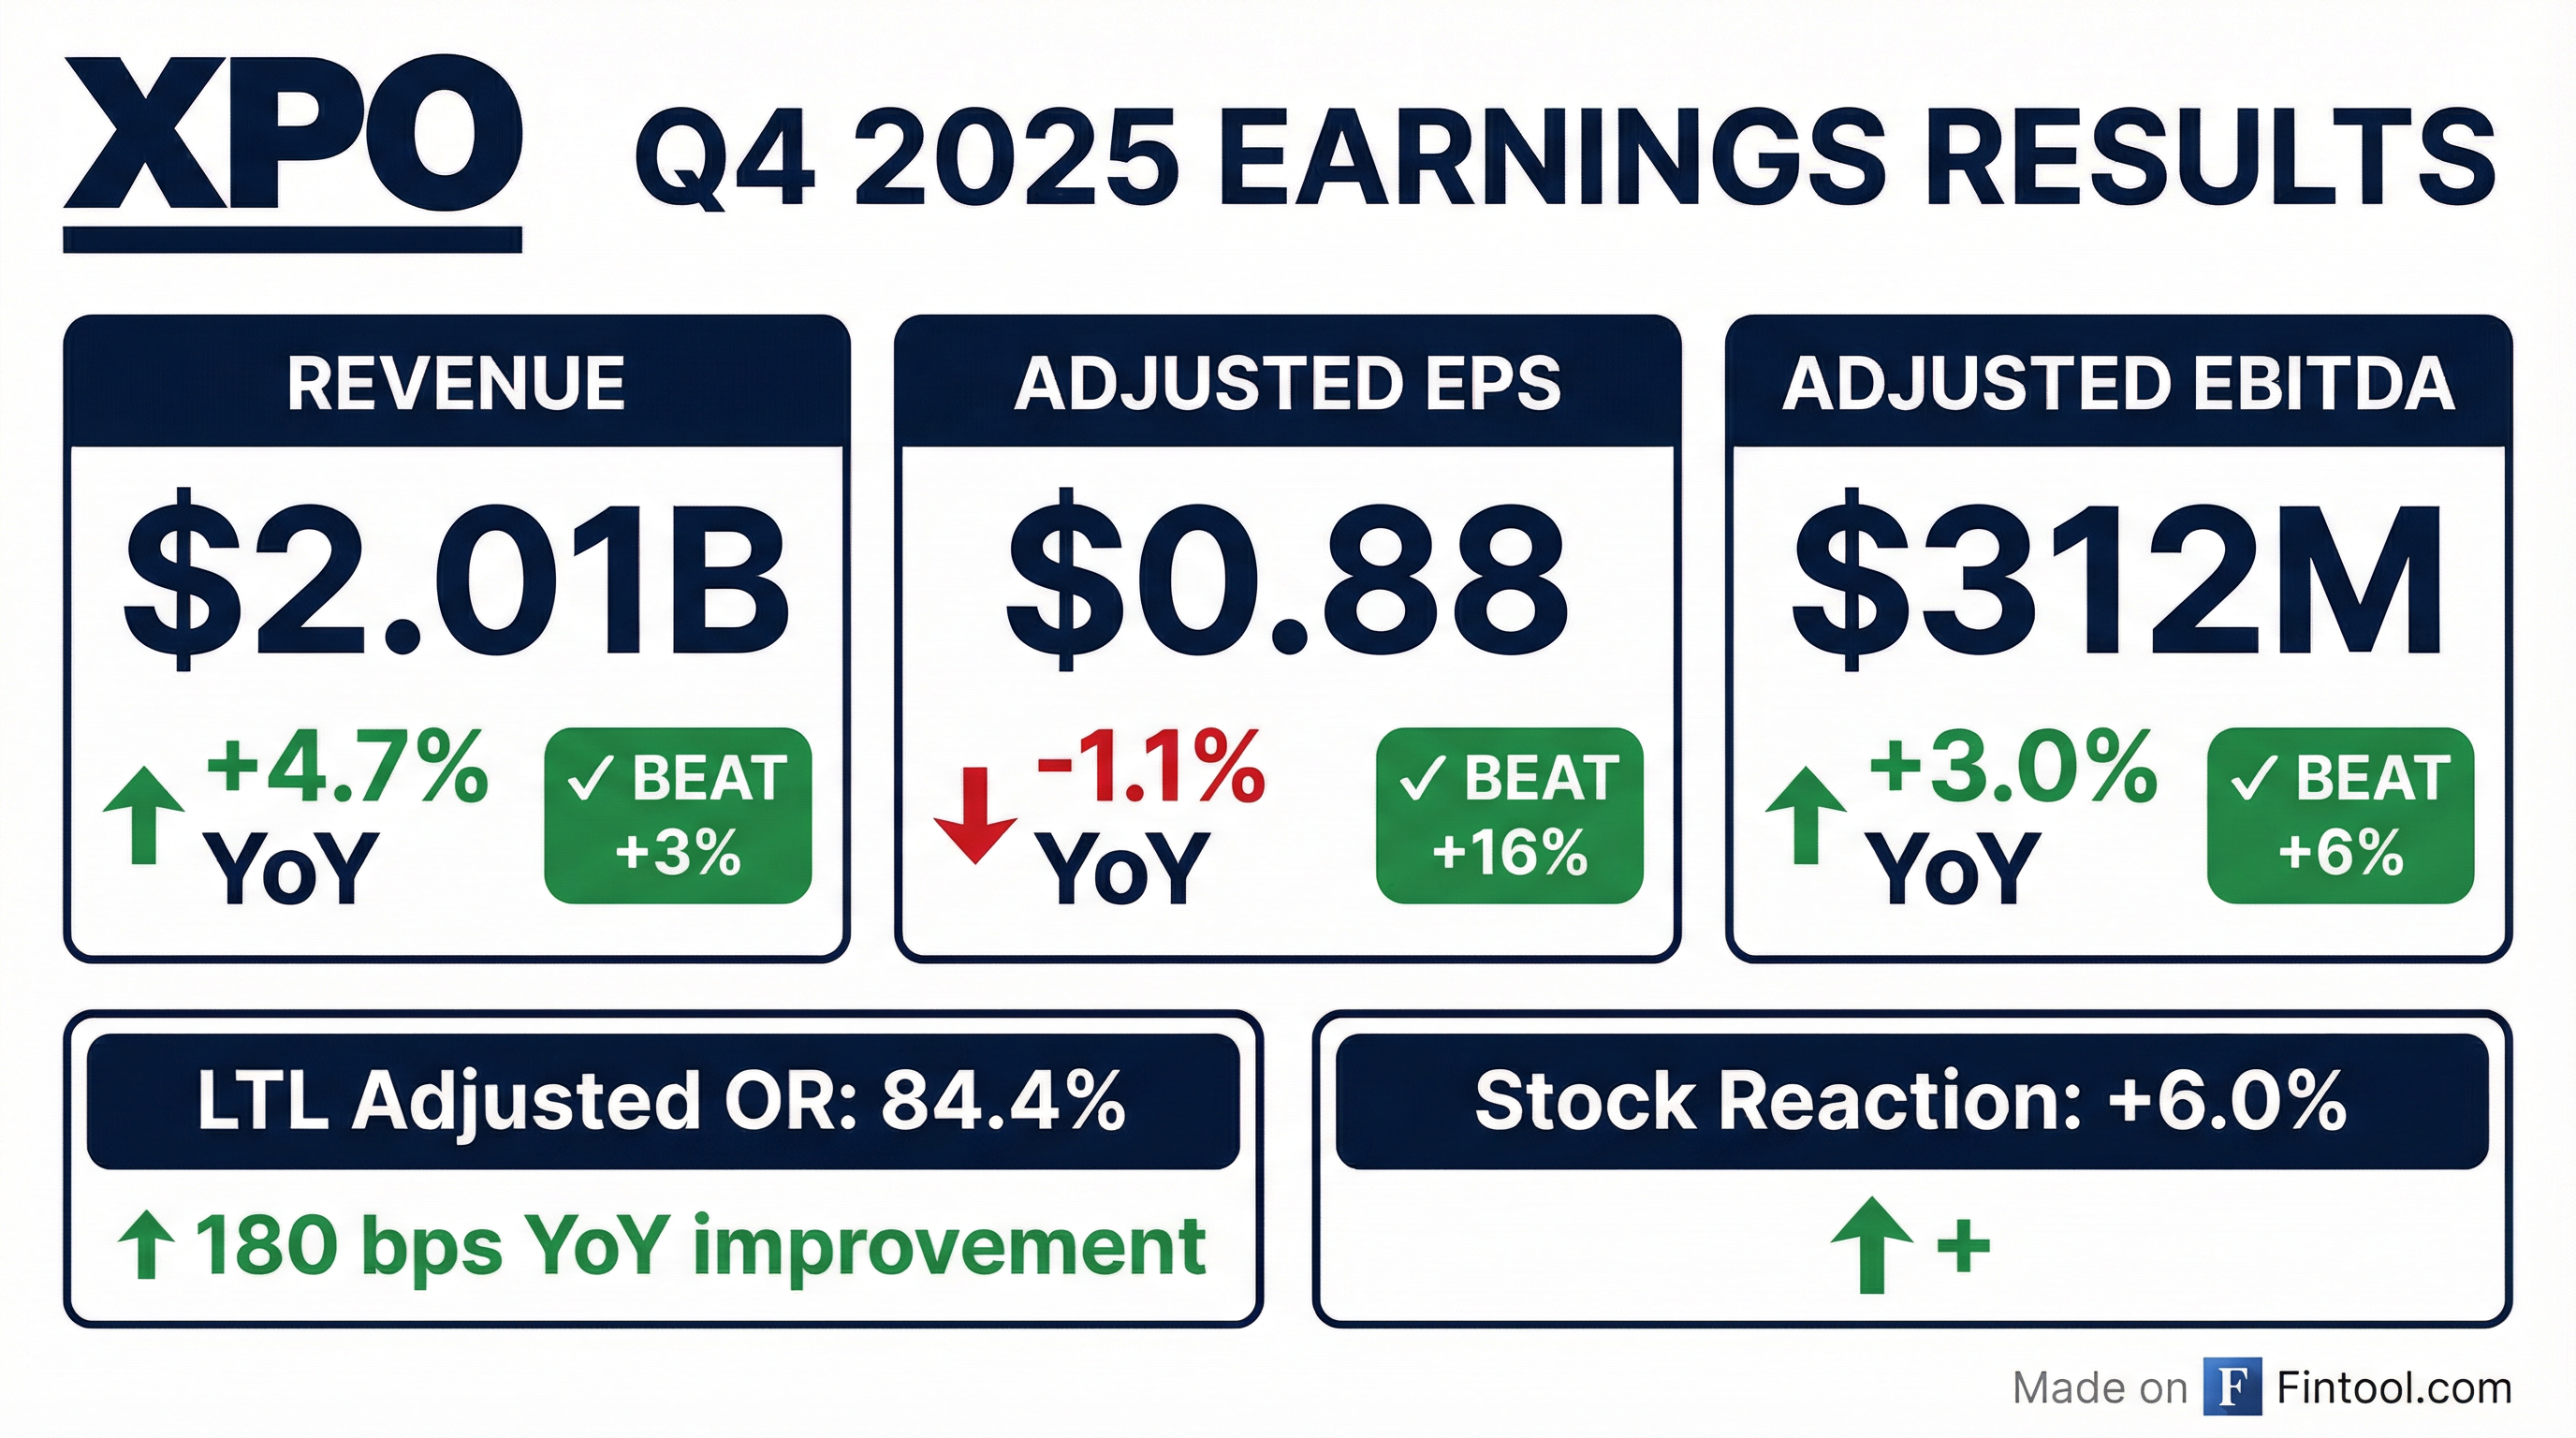
- XPO reported strong Q4 2025 results, with company-wide Adjusted EBITDA of $312 million and adjusted diluted EPS of $0.88. Excluding real estate gains, Adjusted EBITDA increased 11% and adjusted EPS increased 18% year-over-year.
- The North American LTL segment's adjusted operating ratio improved by 180 basis points in Q4 2025, contributing to a 590 basis point LTL margin expansion since 2022.
- For 2026, XPO projects a 100-150 basis point improvement in LTL operating ratio, driven by continued above-market yield growth and cost efficiencies from AI initiatives.
- The company anticipates a meaningful acceleration in free cash flow generation in 2026, enabling increased share repurchases and debt reduction, aiming for a net leverage ratio of 1-2x.
- Strategic initiatives include expanding AI-driven route optimization to nearly half of service centers and leveraging 30% excess door capacity for future volume growth.
- XPO reported strong Q4 2025 results, with company-wide Adjusted EBITDA of $312 million and adjusted diluted EPS of $0.88, and improved its LTL adjusted operating ratio by 180 basis points year-over-year.
- For the full year 2025, the company expanded its LTL margin by 590 basis points since 2022 and grew yield excluding fuel by 6%, driven by improved customer service, market share gains, and cost efficiencies.
- The company provided a positive outlook for 2026, expecting LTL operating ratio improvement of 100-150 basis points for the full year, a meaningful increase in free cash flow generation, and plans to accelerate share repurchases and continue debt reduction.
- XPO is leveraging AI for operational efficiency, including route optimization tools, and reported January 2026 tonnage as roughly flat year-over-year, outperforming normal seasonality despite a winter storm impact.
- XPO reported Q4 2025 Adjusted EBITDA of $312 million and Adjusted Diluted EPS of $0.88, with company-wide revenue increasing 5% year-over-year to $2 billion.
- The LTL segment improved its Adjusted Operating Ratio by 180 basis points year-over-year in Q4 2025, contributing to a 590 basis point LTL margin expansion since 2022.
- For 2026, XPO anticipates a 100-150 basis point improvement in LTL Operating Ratio for the full year, an acceleration from the previous year, even without a significant macro recovery.
- The company expects to meaningfully increase free cash flow generation in 2026, with planned gross capital expenditures of $500-$600 million, and intends to accelerate share repurchases.
- Long-term goals include achieving an LTL Operating Ratio in the low 70s and eventually in the 60s, supported by initiatives to grow local accounts to 30% and premium services to 15%+ of the business.
- XPO reported revenue of $2.01 billion, adjusted diluted EPS of $0.88, and adjusted EBITDA of $312 million for the fourth quarter of 2025.
- The North American LTL segment generated $1.17 billion in revenue and achieved an adjusted operating ratio of 84.4%, which improved by 180 basis points year-over-year.
- LTL yield, excluding fuel, increased 5.2% year-over-year in Q4 2025, and the company reduced LTL linehaul miles outsourced to third-party carriers by 560 basis points year-over-year.
- XPO targets an LTL adjusted EBITDA compound annual growth rate of 11% to 13% and an adjusted operating ratio improvement of at least 600 basis points from 2021 to 2027.
- XPO, Inc. reported strong Q4 2025 financial results, with adjusted EBITDA up 11% year-over-year and adjusted diluted EPS up 18% year-over-year. The company achieved $2.01 billion in revenue, $105 million in adjusted net income, and $0.88 in adjusted diluted EPS for the quarter.
- The North American Less-Than-Truckload (LTL) segment demonstrated significant improvement in Q4 2025, with adjusted operating income increasing 14% year-over-year and an adjusted operating ratio of 84.4%, an improvement of 180 basis points year-over-year. For the full year 2025, LTL revenue reached $4.8 billion, and yield, excluding fuel, improved 6.0% year-over-year.
- For the full year 2026, XPO expects total company gross capital expenditures to be between $500 million and $600 million, interest expense between $205 million and $215 million, and an adjusted effective tax rate of 24% to 25%.
- The company has set long-term targets for its North American LTL segment from 2021 to 2027, including a revenue Compound Annual Growth Rate (CAGR) of 6% to 8% and an adjusted EBITDA CAGR of 11% to 13%, alongside an adjusted operating ratio improvement of at least 600 basis points.
- XPO reported revenue of $2.01 billion for the fourth quarter of 2025, an increase from $1.92 billion in the same period of 2024.
- Diluted earnings per share decreased to $0.50 in Q4 2025 from $0.63 in Q4 2024, while adjusted diluted earnings per share were $0.88, compared to $0.89 in Q4 2024.
- Net income for Q4 2025 was $59 million, down from $76 million in Q4 2024, partly due to a $21 million reduction in real estate gains and a $23 million increase in restructuring expense. Adjusted EBITDA increased to $312 million from $303 million year-over-year.
- The North American Less-Than-Truckload segment generated revenue of $1.17 billion and adjusted operating income of $181 million in Q4 2025, achieving an adjusted operating ratio of 84.4%.
- The company generated $226 million of cash flow from operating activities and completed $65 million in common stock repurchases during the fourth quarter of 2025.
- XPO announced its fourth quarter 2025 financial results, reporting an increase in total revenue and adjusted EBITDA compared to the same period in 2024, as detailed in the table below.
- Despite the revenue growth, diluted EPS and net income decreased year-over-year, while adjusted diluted EPS remained relatively stable.
- The North American Less-Than-Truckload (LTL) segment demonstrated strong performance, with increased revenue and adjusted operating income, and an improved adjusted operating ratio in Q4 2025.
- The company generated $226 million of cash flow from operating activities and executed $65 million of common stock repurchases during the fourth quarter of 2025.
| Metric | Q4 2024 | Q4 2025 |
|---|---|---|
| Revenue ($USD Millions) | 1,921 | 2,011 |
| Diluted EPS ($USD) | 0.63 | 0.50 |
| Adjusted Diluted EPS ($USD) | 0.89 | 0.88 |
| Net Income ($USD Millions) | 76 | 59 |
| Adjusted EBITDA ($USD Millions) | 303 | 312 |
| North American LTL Segment Revenue ($USD Millions) | 1,160 | 1,170 |
| North American LTL Segment Adjusted Operating Income ($USD Millions) | 159 | 181 |
| North American LTL Segment Adjusted Operating Ratio (%) | 86.2 | 84.4 |
| European Transportation Segment Revenue ($USD Millions) | 765 | 846 |
- XPO reported fourth-quarter revenue of $2.01 billion and adjusted EPS of $0.88, exceeding consensus estimates.
- The less-than-truckload (LTL) unit showed operational improvements, including improved yields (ex-fuel) and a better adjusted operating ratio of 84.4%, and a January tonnage surprise ended an 18-month year-over-year decline.
- The company generated $226 million in operating cash flow for the quarter, finishing the year with $310 million in cash, and completed $65 million in share repurchases and $65 million in term-loan repayments.
- XPO's European transportation segment delivered a 10.6% year-over-year revenue increase to $846 million and reported adjusted EBITDA of $32 million.
- XPO, Inc. reported preliminary North American Less-Than-Truckload (LTL) operating metrics for November 2025 and final metrics for October 2025 on December 1, 2025.
- For November 2025, LTL tonnage per day decreased by 5.4% compared to November 2024, attributed to a 2.2% decrease in shipments per day and a 3.2% decrease in weight per shipment.
- For October 2025, weight per day decreased by 3.8% compared to October 2024, due to a 1.4% decrease in shipments per day and a 2.4% decrease in weight per shipment.
- XPO reported strong Q3 2025 results, with total company adjusted EBITDA of $342 million and adjusted diluted EPS of $1.07, both exceeding expectations.
- The North American LTL segment achieved record adjusted EBITDA of $308 million and adjusted operating income of $217 million, improving its adjusted operating ratio by 150 basis points year-over-year to 82.7%.
- The company continued to drive above-market yield growth, with LTL yield excluding fuel increasing 5.9% year-over-year and 3.1% sequentially, supported by investments in network, equipment, and proprietary AI technology.
- XPO generated $371 million in cash flow from operating activities, ending the quarter with $935 million in total liquidity after repurchasing $50 million of common stock and paying down $50 million on its term loan.
- Management expects to materially outperform seasonality in Q4 2025 with approximately 250 basis points of year-over-year OR expansion and anticipates continued OR improvement and earnings growth in 2026, even without a macro recovery.
Quarterly earnings call transcripts for XPO.
Ask Fintool AI Agent
Get instant answers from SEC filings, earnings calls & more