Earnings summaries and quarterly performance for BROADRIDGE FINANCIAL SOLUTIONS.
Executive leadership at BROADRIDGE FINANCIAL SOLUTIONS.
Tim Gokey
Chief Executive Officer
Ashima Ghei
Chief Financial Officer
Christopher Perry
President
Douglas DeSchutter
Corporate Vice President, Investor Communication Solutions
Hope Jarkowski
Chief Legal Officer
Richard Stingi
Chief Human Resources Officer
Thomas Carey
Corporate Vice President, Global Technology and Operations
Board of directors at BROADRIDGE FINANCIAL SOLUTIONS.
Research analysts who have asked questions during BROADRIDGE FINANCIAL SOLUTIONS earnings calls.
Patrick O'Shaughnessy
Raymond James
7 questions for BR
Puneet Jain
JPMorgan Chase & Co.
6 questions for BR
Kyle Peterson
Needham & Company
5 questions for BR
Michael Infante
Morgan Stanley
5 questions for BR
Scott Wurtzel
Wolfe Research
5 questions for BR
Daniel Perlin
RBC Capital Markets
3 questions for BR
James Faucette
Morgan Stanley
3 questions for BR
Alex Kramm
UBS Group AG
2 questions for BR
Matthew Roswell
RBC Capital Markets
2 questions for BR
Peter Heckmann
D.A. Davidson
2 questions for BR
Alex Kram
UBS
1 question for BR
Recent press releases and 8-K filings for BR.
- The GTO segment delivered 8% revenue growth in Q2 (6% organic), with capital markets up 8% driven by digital assets and trading volumes, and wealth management up 11% (6% organic, 5% from the SIS Canada acquisition).
- Growth is expected to moderate in H2 due to the timing of legacy license renewals, a reduction in Canton Coin minting rewards, and SIS’s transition to a full-year contribution.
- Key KPIs include 11% internal trade growth (≈1/3 of GTO revenues) and $380 billion/day in DLR platform notional (5× year-over-year), alongside rising adoption of integrated APIs and ontology-driven platforms.
- Broadridge’s capital markets business leverages its scale—serving 29 of 30 G-SIBs—a mutualized infrastructure model, and front-to-back integration; DLR volumes have quintupled over the past 12 months.
- The wealth segment is underpinned by secular trends—generational wealth transfer, investment democratization, and communication digitization—with roll-out of the Wealth InFocus omni-channel platform underway.
- In Q2, the GTO segment posted 8% revenue growth (6% organic), with DLR digital asset volumes rising to $380 billion/day (5× year-ago) and wealth management up 11% (6% organic, 5% from SIS acquisition).
- H2 growth is expected to moderate due to fewer term-license renewals, a flattening Canton Coin minting curve, and SIS integration completing its first year.
- Capital markets differentiation is driven by scale (serving 29 of 30 G-SIBs, $15 trillion/day in settlements), a mutualized infrastructure model, and front-to-back integration, reinforced by deep domain expertise.
- Broadridge’s digital-asset strategy includes acting as a Super Validator on the Canton Network (1.5 billion Canton Coins held), and tokenizing $380 billion/day in repo on its DLR platform, viewing tokenization as additive to existing rails.
- In wealth management, the Wealth InFocus platform offers omni-channel communications, supports generational wealth transfer, digital assets, and improves advisor productivity through integrated books-and-records and AI enhancements.
- Broadridge’s GTO (capital markets and wealth management) segment delivered 8% revenue growth in Q2 2026, including 6% organic growth, driven by digital asset revenues and trading activity.
- The firm’s capital markets business leverages scale—serving 29 of the 30 global systemically important banks and settling $15 trillion/day—a mutualized cost model, and front-to-back integration to deepen client engagements.
- As a Super Validator on the permissionless Canton blockchain, Broadridge holds 1.5 billion Canton Coins and powers its Digital Ledger Repo platform, which now tokenizes $380 billion/day for 14 live clients, with future revenue shifting from minting to applications.
- Broadridge positions its books-and-records infrastructure as “anti-disruptive,” embedding agentic AI to accelerate product roadmaps, optimize costs, and shorten time-to-market for client implementations.
- Broadridge Financial Solutions has integrated Crypto.com with its NYFIX order routing network, marking Broadridge’s first cryptocurrency connection in Asia and enabling crypto orders to flow through its global FIX-based infrastructure.
- This collaboration allows existing NYFIX participants to seamlessly route orders to Crypto.com, combining Broadridge’s market access to over 2,200 buy- and sell-side firms with Crypto.com’s deep liquidity and low-latency execution.
- The integration reinforces Broadridge’s strategy to broaden digital asset capabilities, delivering standardized, secure trade workflows and mitigating fragmentation across traditional and crypto markets.
- Crypto.com gains extended market reach via Broadridge’s platform and can explore additional capital markets services as its business expands.
- Broadridge processes $15 trillion in daily trade volume (including $400 billion tokenized) and manages 1.5 billion governance positions across 150 million accounts, serving 28 of 29 GSIBs.
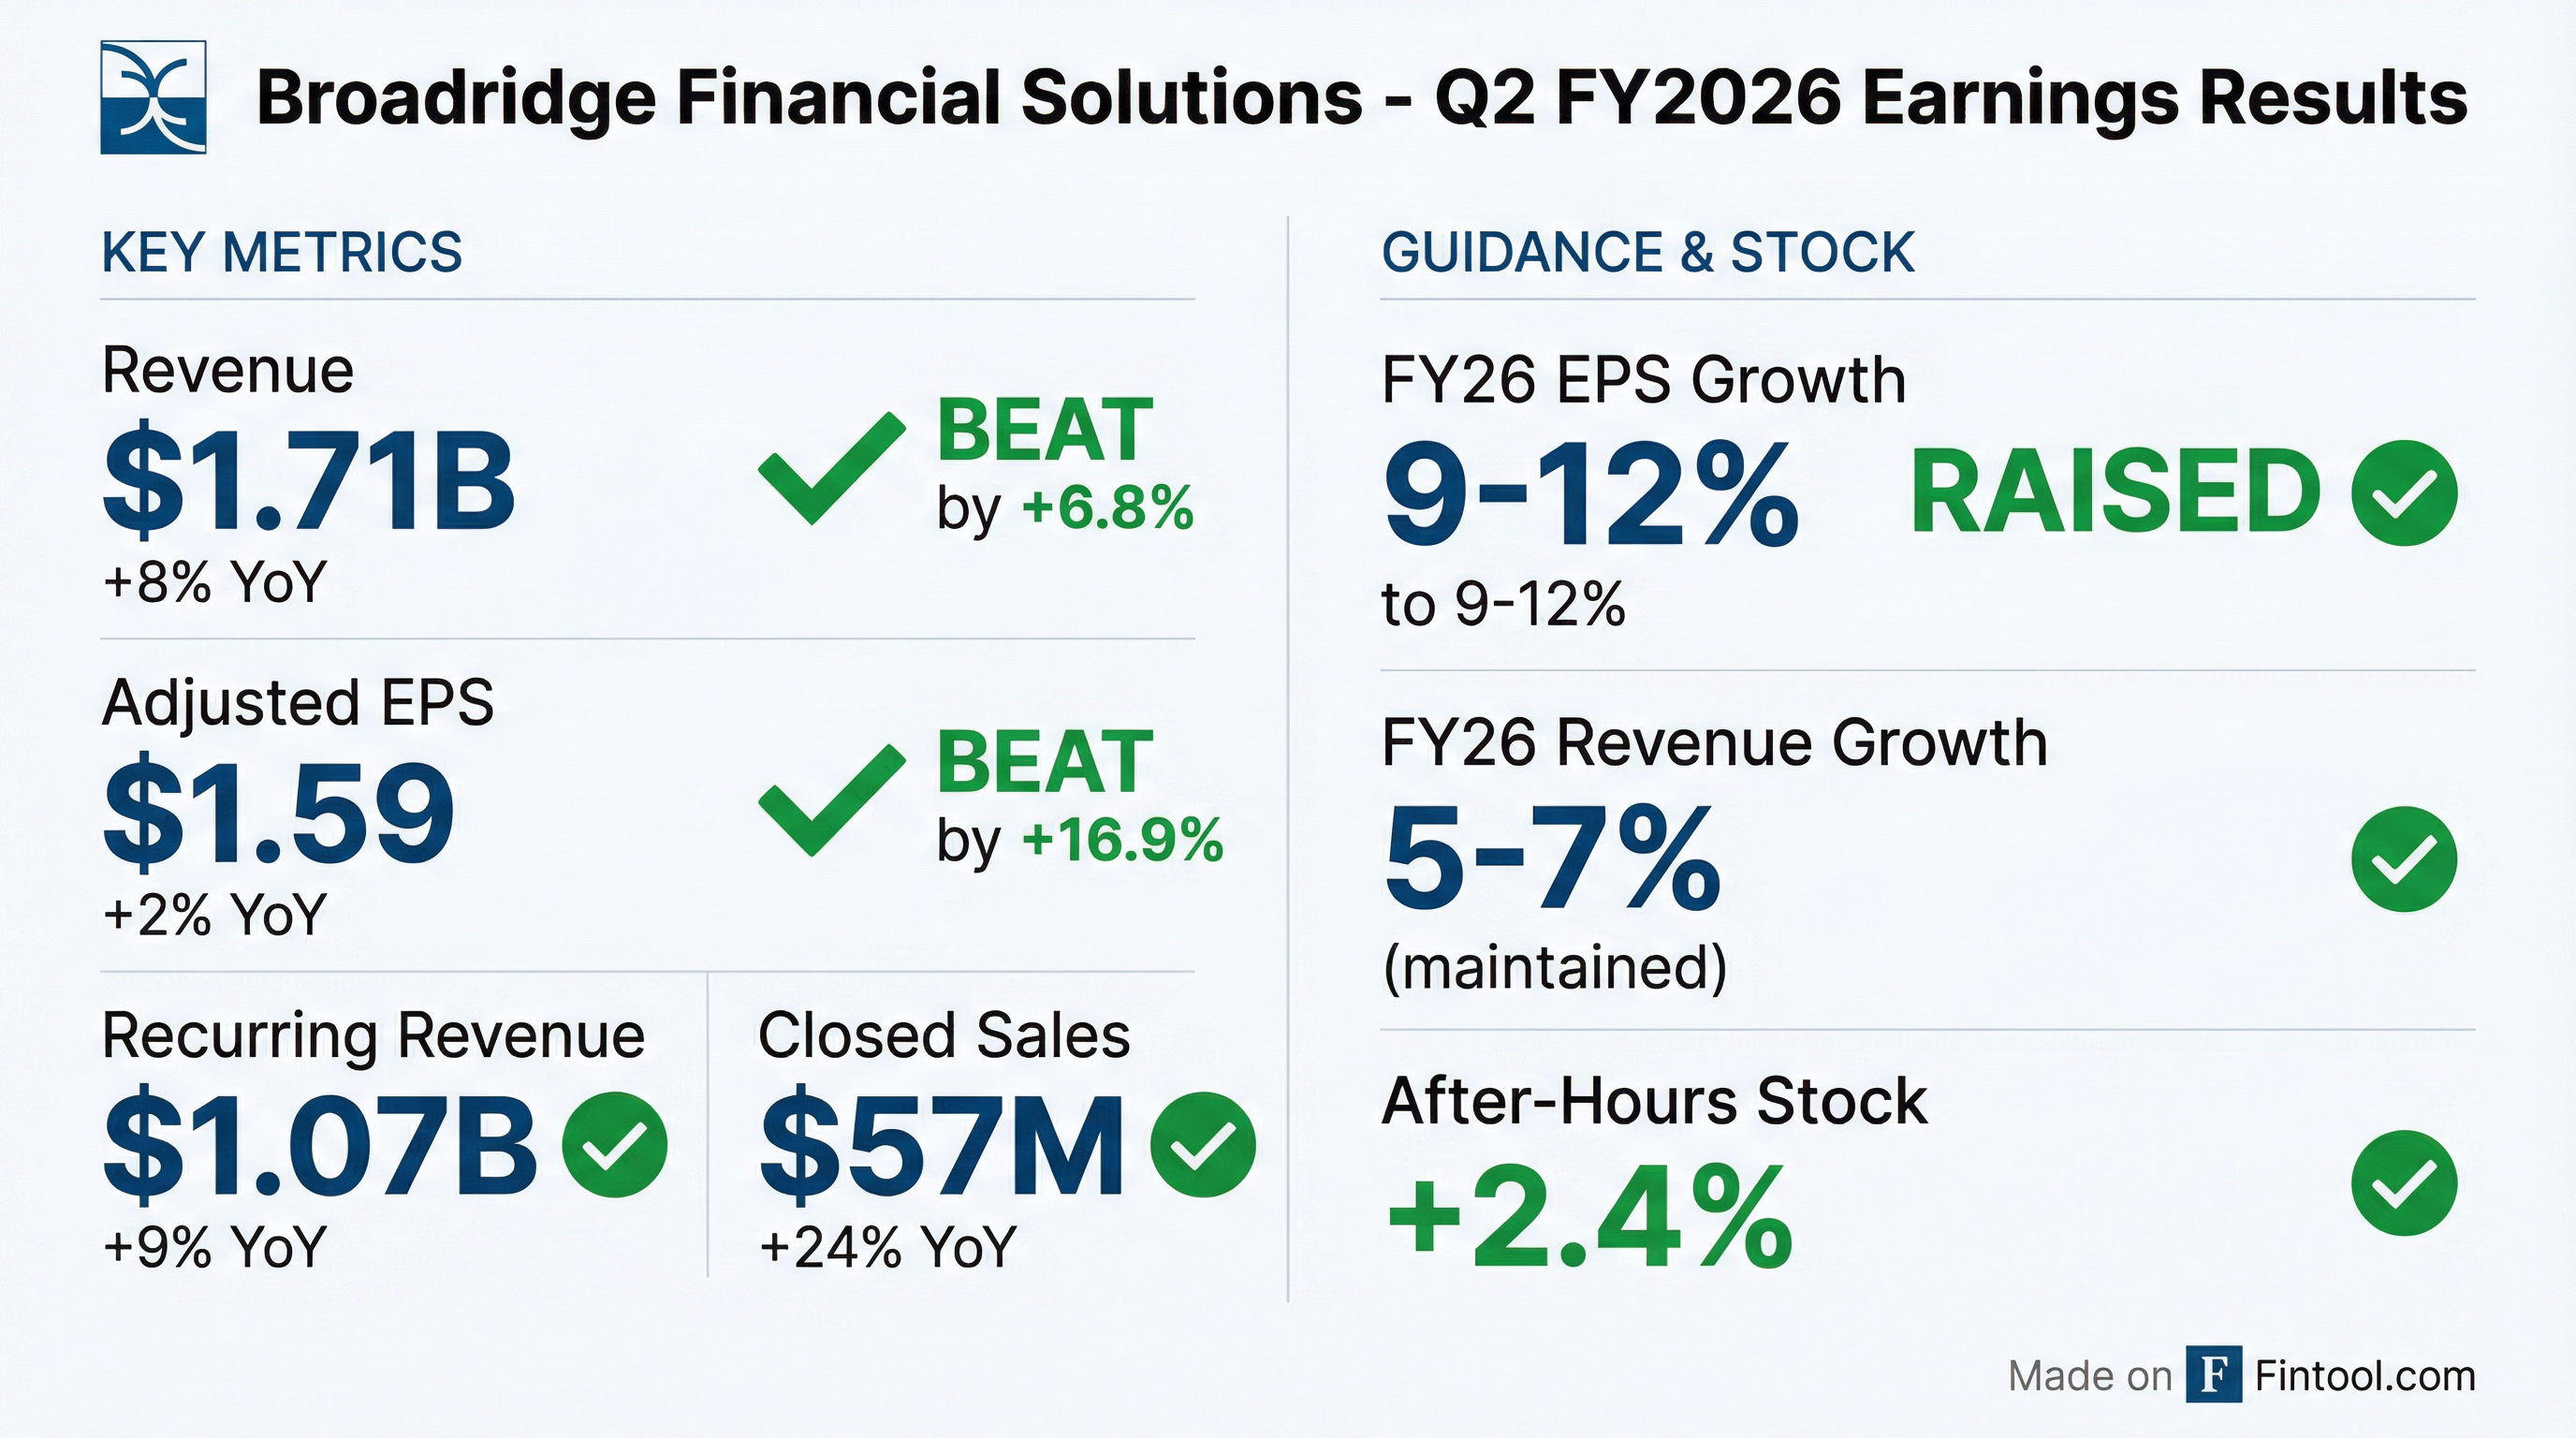
- Reaffirmed full-year 9%-12% earnings growth guidance, with mid-single-digit revenue growth targeted in Q1 and Q2, aligning with its long-term model of 5%-7% organic revenue and 8%-12% earnings growth.
- Embedding AI across existing platforms (natural-language search, self-service), launching new AI-based services (Global Demand Model sold to ~20 clients; Custom Policy Engine), and achieving 20% productivity gains in managed services.
- Advancing tokenization with a growing Distributed Ledger Repo platform, enabling on-chain governance by end-2026, and integrating digital asset servicing into core processing to support quicker settlement without parallel infrastructure.
- Supporting a shift to ~90% electronic investor communications, expecting minimal revenue impact and preserving preference management fees through a broad, certified service platform that has lowered digital delivery costs 75% since 2010.
- Broadridge processes $15 trillion in trades daily, including $400 billion in tokenized assets, manages 1.5 billion governance positions across 150 million accounts, serves 28 of 29 G-SIBs, and reaffirmed 2026 guidance of 9 %–12 % earnings growth with mid-single-digit quarterly revenue growth.
- Integrating AI across its platforms—via natural language search, self-service help, a predictive Global Demand Model and Custom Policy Engine—and achieving 20 % productivity gains in its $100 million managed services business to unlock new client services.
- Accelerating tokenization initiatives with its Distributed Ledger Repo platform (moving toward real-time settlement and new asset classes), enabling digital asset servicing on core engines, and targeting on-chain governance support by year-end to convert complexity into growth.
- Expanding proxy voting solutions—pass-through voting now covers 600 funds with $4 trillion AUM, plus the Custom Policy Engine and Standing Voting Instructions—expected to add ~1 pp annual growth to its governance segment.
- With 90 % of regulatory communications already digital, a shift to default electronic delivery is projected to have minimal revenue impact while boosting margins and engagement, leveraging prior cost reductions and product innovations.
- Broadridge processes $15 trillion in trades daily, including $400 billion tokenized, and its governance platform manages 1.5 billion positions across 150 million accounts, serving 28 of the 29 G-SIBs.
- Maintains its long-term financial model of 5–7% organic revenue growth, 7–9% recurring revenue growth, and 8–12% earnings growth with current 2026 guidance of 9–12% earnings growth, including mid-single-digit growth over the next two quarters.
- Positions AI as a net positive by embedding it across existing platforms (e.g., natural language search, self-service), launching data-driven services like the Global Demand Model (20+ clients) and Custom Policy Engine, and achieving 20% productivity gains in managed services with another 20% potential.
- Advances tokenization through its Distributed Ledger Repo platform (new logos each quarter), enables existing core engines to process digital assets, and will support on-chain governance by year-end.
- Notes 90% of regulatory communications are already digital, expecting default e-delivery to have a minimal revenue impact while driving higher margins and growth in digital services.
- Guidance reaffirmed for FY26 with 9%–12% projected earnings growth, supported by a long-term model targeting 5%–7% organic revenue growth and 8%–12% EPS growth.
- Positioning AI as a tailwind, embedding machine learning in workflows, launching services like the Global Demand Model and Custom Policy Engine, and leveraging agentic AI to boost operational productivity by 20%.
- Broadridge's market infrastructure network processes $15 trillion in daily trades (including $400 billion tokenized) and manages 1.5 billion governance positions across 150 million accounts, serving 28 of 29 GSIBs.
- Advancing tokenization initiatives via the Distributed Ledger Repo platform, asset servicing for digital assets, and full on-chain governance enablement by year-end 2026.
- Expanding shareholder engagement through pass-through voting (600 funds, $4 trillion AUM this year), Custom Policy Engine, and standing voting instructions, with these proxy solutions potentially adding ~1 pp annual growth to governance.
- Broadridge reiterated its 2026 guidance of 9–12% earnings growth and mid-single-digit revenue growth in both the current and next quarter.
- Management views AI as a tailwind, embedding natural-language search and predictive models (Global Demand Model sold to ~20 clients) across platforms, and achieving a 20% productivity boost in Managed Services over the past year.
- Tokenization is seen as growth driver: Broadridge processes $400 billion in tokenized trades daily, is expanding its Distributed Ledger Repo platform, and will support on-chain governance by year-end 2026.
- Governance services are expanding with pass-through voting for 600 funds ($4 trillion AUM vs. $2 trillion last year) and a new Custom Policy Engine, potentially adding ~1 pp to annual governance growth.
- With 90% of regulatory communications already digital, the SEC’s proposed default e-delivery is expected to have a minimal revenue impact, as end-to-end proxy services remain unchanged.
- Reaffirmed 2026 earnings growth guidance of 9%–12%, with mid-single-digit revenue growth in the current and next quarters.
- Embedding AI across its platform in three pillars—workflow modernization, unique data services (Global Demand Model, Custom Policy Engine), and agentic AI—driving ~20% productivity gains in its $100 million managed services business.
- Advancing tokenization with processing of $400 billion in daily tokenized trades, expansion of its Distributed Ledger Repo platform, and on-chain governance support planned by year-end.
- Highlighted that 90% of regulatory communications are already electronic, expecting default digital delivery to have a minimal revenue impact while improving margins; Preference Management Fees cover end-to-end event collection, voting, and reconciliation.
Fintool News
In-depth analysis and coverage of BROADRIDGE FINANCIAL SOLUTIONS.

Quarterly earnings call transcripts for BROADRIDGE FINANCIAL SOLUTIONS.
Ask Fintool AI Agent
Get instant answers from SEC filings, earnings calls & more