Earnings summaries and quarterly performance for CENTENE.
Executive leadership at CENTENE.
Sarah London
Chief Executive Officer
Andrew Asher
Chief Financial Officer
Christopher Koster
Secretary and General Counsel
Kate Casso
Corporate Controller & Chief Accounting Officer
Susan Smith
Chief Operating Officer
Tanya McNally
Chief People Officer
Board of directors at CENTENE.
Research analysts who have asked questions during CENTENE earnings calls.
Andrew Mok
Barclays
9 questions for CNC
Justin Lake
Wolfe Research, LLC
9 questions for CNC
Lance Wilkes
Sanford C. Bernstein & Co., LLC
9 questions for CNC
Ann Hynes
Mizuho Financial Group
7 questions for CNC
Sarah James
Cantor Fitzgerald
7 questions for CNC
Kevin Fischbeck
Bank of America
6 questions for CNC
George Hill
Deutsche Bank
5 questions for CNC
Joshua Raskin
Nephron Research
5 questions for CNC
Stephen Baxter
Wells Fargo & Company
5 questions for CNC
A.J. Rice
UBS Group AG
4 questions for CNC
Dave Windley
Jefferies LLC
4 questions for CNC
John Stansel
JPMorgan Chase & Co.
4 questions for CNC
Josh Raskin
Nathron Research
4 questions for CNC
Scott Fidel
Stephens Inc.
4 questions for CNC
Stephen Baxter
Wells Fargo
4 questions for CNC
Albert Rice
UBS
3 questions for CNC
David Windley
Jefferies Financial Group Inc.
3 questions for CNC
Hua Ha
Robert W. Baird & Co. Incorporated
3 questions for CNC
Adam Ron
Bank of America Corporation
2 questions for CNC
A.J. Rice
UBS
2 questions for CNC
Erin Wright
Morgan Stanley
2 questions for CNC
Michael Ha
Robert W. Baird & Co.
2 questions for CNC
Christian Bomer
TD Cowen
1 question for CNC
Joaquin Arriagada Martinez
Bank of America
1 question for CNC
Ryan Langston
TD Cowen
1 question for CNC
Recent press releases and 8-K filings for CNC.
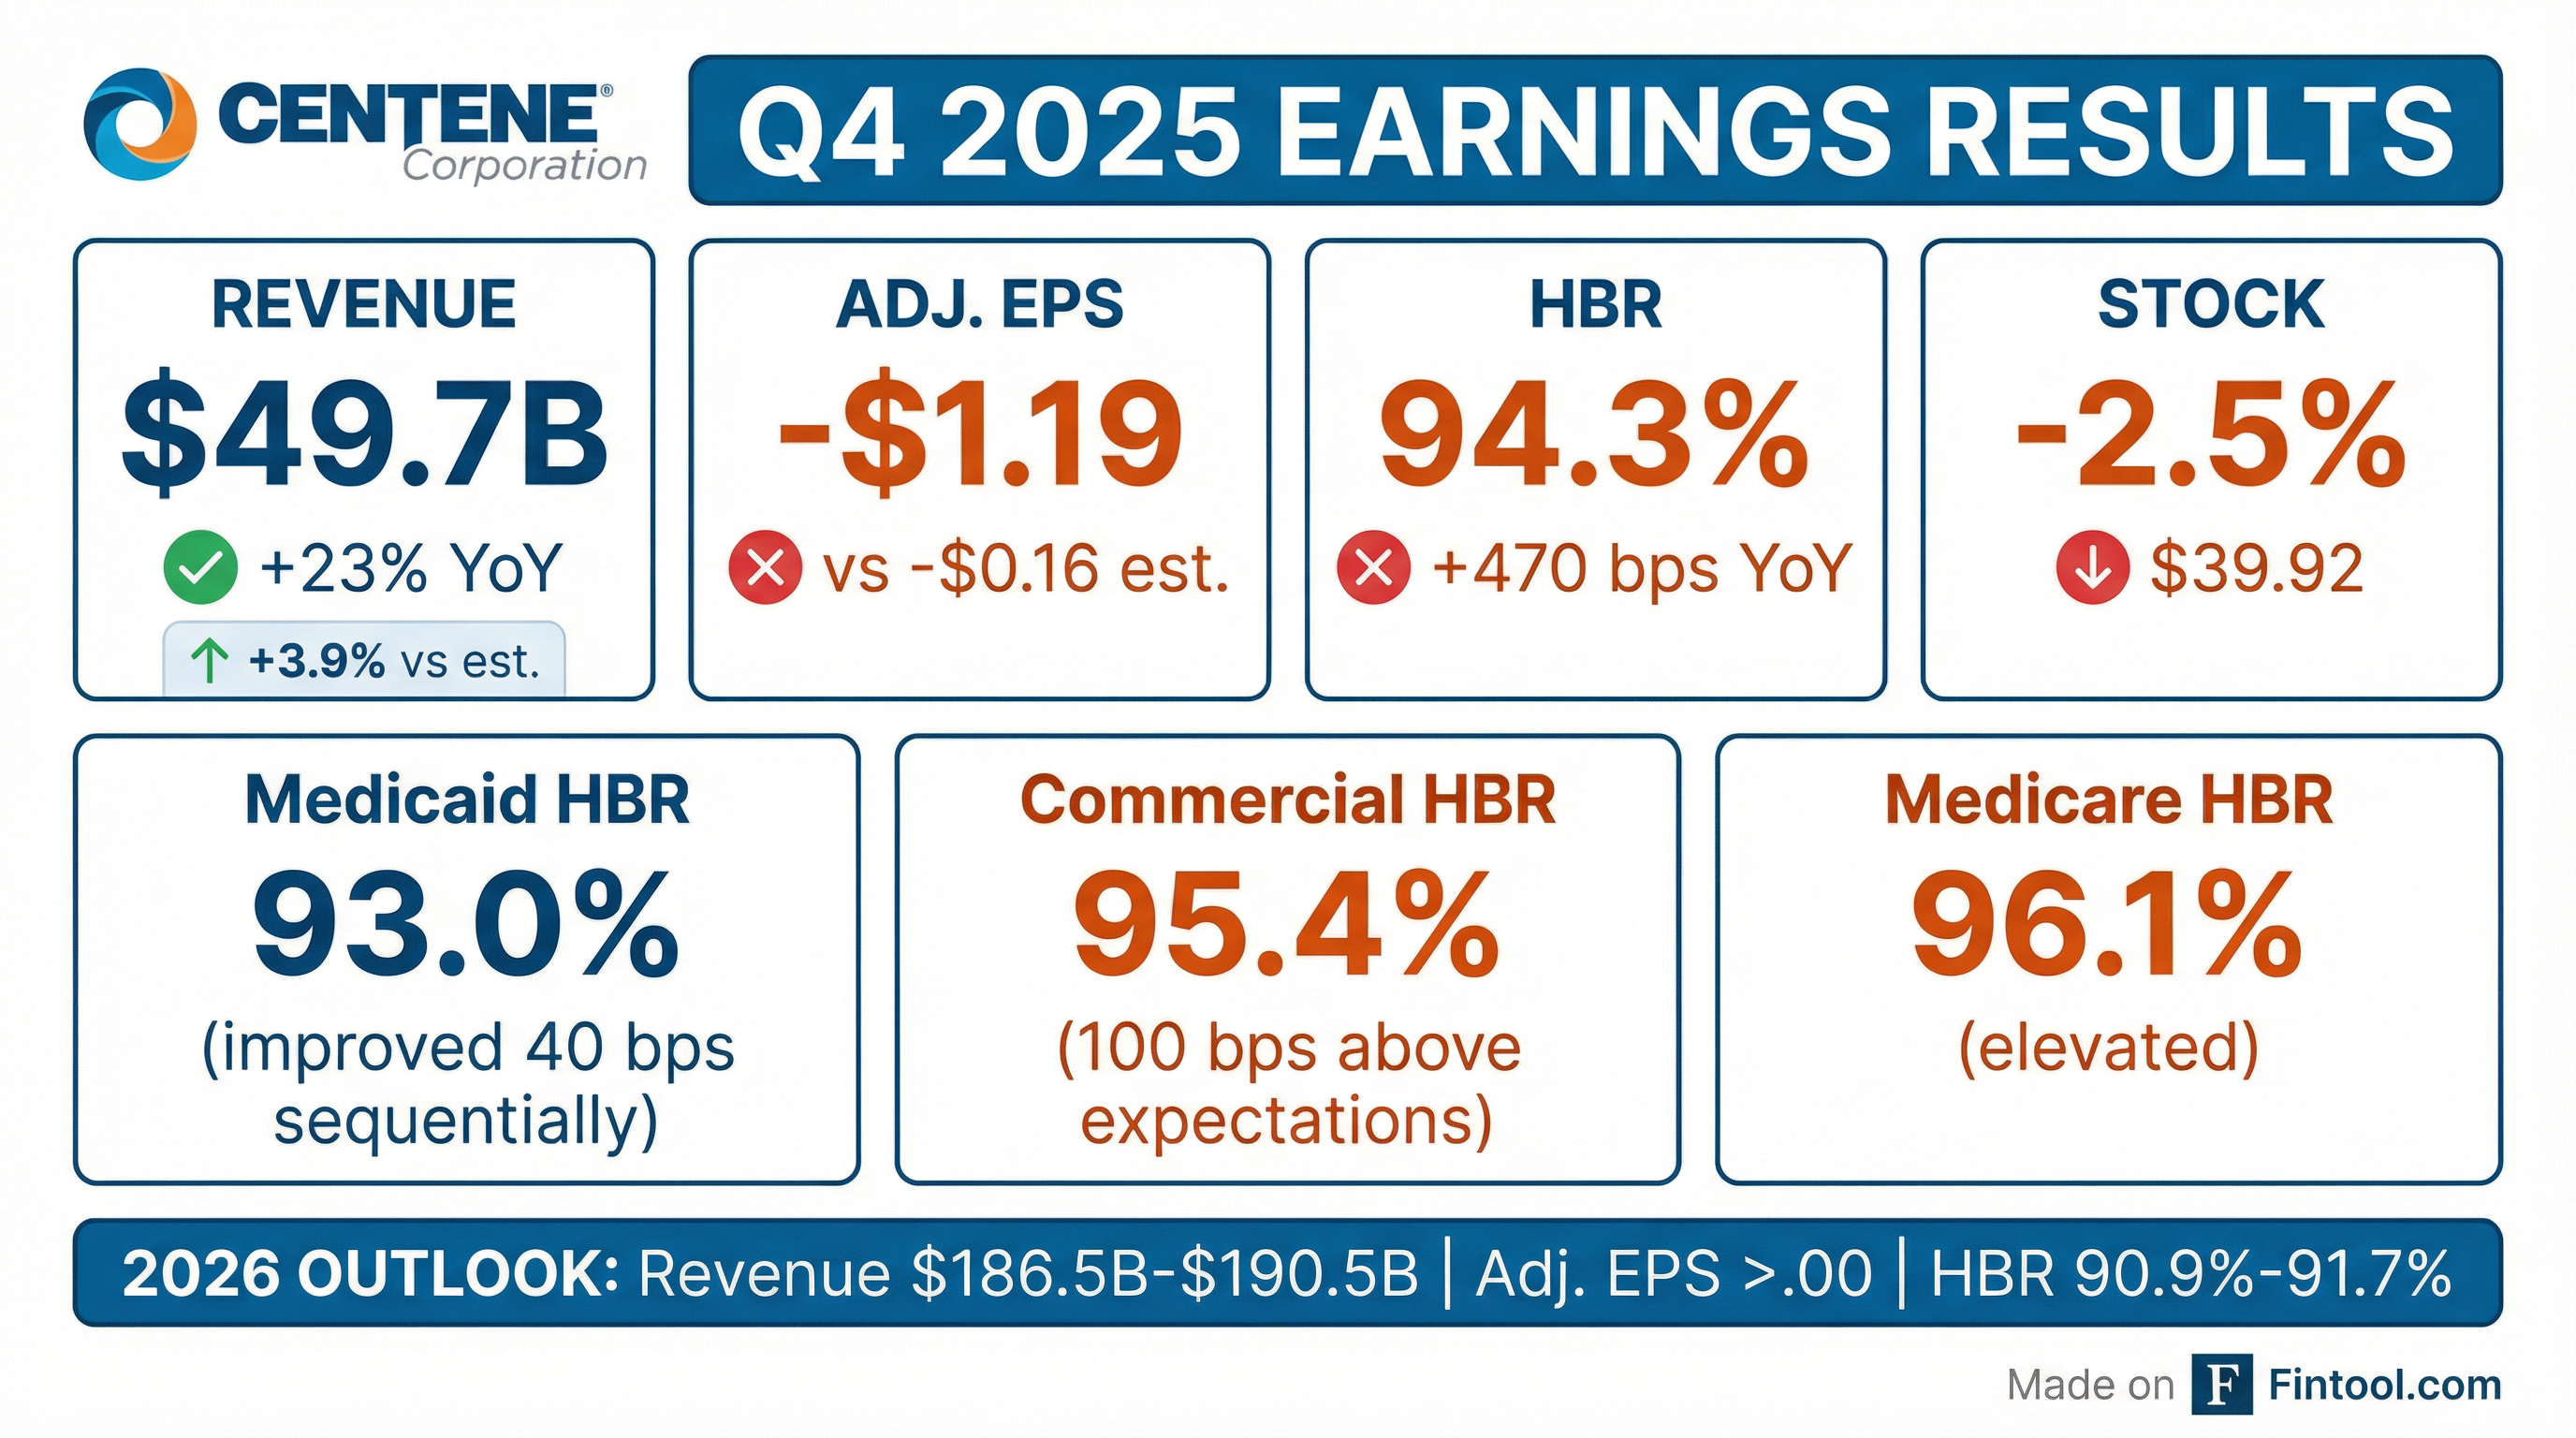
- Centene reported a Q4 2025 adjusted diluted loss per share of $1.19 and full-year 2025 adjusted diluted EPS of $2.08.
- Q4 premium and service revenue totaled $174.6 billion; GAAP diluted loss per share was $2.24, including a $389 million net loss on the Magellan divestiture.
- Medicaid health benefits ratio improved to 93.0% (40 bps sequential, 190 bps YoY) and membership closed at 12.5 million, reflecting continued margin momentum.
- 2026 guidance includes premium and service revenue of $170 billion–$174 billion, consolidated HBR of 90.9%–91.7%, and adjusted EPS of > $3.00 (over 40% YoY growth).
- Full-year 2025 SG&A expense ratio was 7.4% (down 110 bps YoY); year-end cash of $400 million and debt-to-capital ratio of 46.5% support ongoing deleveraging.
- Centene reported a fourth quarter adjusted diluted loss per share of $1.19, delivering a full year 2025 adjusted diluted EPS of $2.08.
- Fourth quarter GAAP diluted loss per share was $2.24, including a $389 M net loss on the definitive agreement to divest the remaining Magellan business, while full year premium and service revenue reached $174.6 B.
- Medicaid health benefits ratio improved to 93.0 % in Q4, supported by a 5.5 % composite rate increase, with membership ending 2025 at 12.5 M; 2026 Medicaid member months are expected to decline 5–6 %.
- Company forecasts 2026 adjusted EPS of > $3, representing > 40 % year-over-year growth, with premium and service revenue guidance of $170 B–$174 B and a consolidated health benefits ratio of 90.9 %–91.7 %.
- Full year SG&A expense ratio improved by 110 bps to 7.4 %, with a debt-to-capital ratio of 46.5 % and $400 M of cash available for general corporate use as of Q4 end.
- Q4 2025 adjusted diluted loss per share: $1.19; full year adjusted diluted EPS: $2.08; GAAP diluted loss per share: $2.24 (driven by a $389 M net loss on Magellan divestiture)
- 2026 guidance: premium and service revenue of $170 B–$174 B; consolidated health benefits ratio of 90.9%–91.7%; adjusted EPS expected to exceed $3.00, >40% YoY growth
- Medicaid: Q4 health benefits ratio improved to 93.0% (40 bps sequential improvement); 2026 net rate impact and net trend both in the mid-fours percent; member months down 5%–6%
- Marketplace and Medicare: Ambetter membership expected to reach 3.5 M by end Q1 2026 (down from 5.5 M in Dec); Medicare PDP pre-tax margin assumption of ~2%; Medicare segment revenue split 41% MA/59% PDP, MA on track for break-even in 2027
- Total revenue guidance for 2026 of $186.5 billion – $190.5 billion, with premium & service revenues expected at $170.0 billion – $174.0 billion
- GAAP diluted EPS of > $1.98 and adjusted diluted EPS of > $3.00 for 2026
- Health Benefits Ratio (HBR) guidance of 90.9 % – 91.7 %, with segment HBR changes: Commercial ~– 95 bps, Medicaid ~0 bps, Medicare ~+ 35 bps
- 2026 estimated segment premium & service revenues: Medicare $88 billion, Commercial $45 billion, Medicaid $34.5 billion, Other $4.5 billion
- Centene reported Q4 revenue of $45.1 B, TTM revenue of $176.2 B, a GAAP TTM net loss of $6.7 B (basic EPS -$13.53) and a Q4 adjusted diluted loss of $1.19 per share.
- Full-year 2025 adjusted diluted EPS was $2.08, with 2026 guidance of at least $3 per share, implying over 40% growth vs. 2025.
- CEO Sarah London highlighted improvements in Medicaid profitability and recovering Marketplace and Medicare Advantage margins as drivers for 2026, despite headwinds from shrinking ACA premiums, enrollment softness, elevated medical utilization, and policy risks.
- The company divested its remaining Magellan Health assets in December, incurring a $389 M after-tax impairment.
- 2025 full-year GAAP diluted loss per share of $(13.53); adjusted diluted EPS of $2.08
- Total 2025 revenues of $194.8 billion, including $174.6 billion of premium and service revenues; Q4 revenues of $49.7 billion (premium and service $44.7 billion)
- Q4 2025 GAAP diluted loss per share of $(2.24); adjusted diluted loss per share of $(1.19); health benefits ratio of 94.3% (Medicaid 93.0%, Commercial 95.4%)
- Operating cash flow of $5.1 billion for 2025 (Q4: $437 million) and full-year adjusted SG&A expense ratio of 7.4%
- 2026 guidance: adjusted EPS > $3.00, GAAP EPS > $1.98; revenues $186.5–190.5 billion, premium and service revenues $170–174 billion; HBR 90.9–91.7%; SG&A ratio 7.1–7.7%; tax rate 27–28%
- Total revenues of $49.7 billion in Q4 and $194.8 billion for full-year 2025; premium and service revenues of $44.7 billion and $174.6 billion, respectively.
- Health benefits ratio of 94.3 % in Q4 and 91.9 % for the full year, with adjusted SG&A expense ratio of 7.4 % for 2025.
- GAAP diluted loss per share of $(2.24) in Q4 and $(13.53) for 2025; adjusted diluted EPS of $(1.19) in Q4 and $2.08 for 2025.
- 2026 guidance: GAAP EPS > $1.98, adjusted EPS > $3.00, premium & service revenues of $170–174 billion, and HBR of 90.9 %–91.7 %.
- In 2026, Wellcare will offer Medicare Advantage to over 51 million beneficiaries in 32 states (covering >75% of eligible beneficiaries) and Prescription Drug Plans to over 8 million members nationwide, adding 51 new counties across eight states.
- Transitioning five Medicare-Medicaid Plans (MMPs) to integrated Dual Eligible Special Needs Plans (D-SNPs) effective Jan 1, 2026, expanding its integrated D-SNP footprint.
- Enhanced member benefits include the Wellcare Spendables® card accepted at >66,000 retailers, digital mental health support, $0/low PCP copays, and insulin capped at $35 or 25% of the drug price.
- Prescription Drug Plans will feature two products (Classic and Value Script) in all 34 regions with 68 plans nationwide and $0 Tier 1 copays at preferred pharmacies.
- Medicare Advantage to 51 million beneficiaries across 32 states and PDP to over 8 million members nationwide, adding 51 new counties in eight states for the 2026 Annual Enrollment Period (Oct. 15–Dec. 7, 2025).
- Transition of five Medicare-Medicaid Plans to integrated Dual Eligible Special Needs Plans (D-SNPs) in eight states, effective Jan. 1, 2026, to improve care coordination for dual eligibles.
- Enhanced member experience via the Wellcare Spendables® card at 66,000+ retailers, integrated rewards, and modernized onboarding with videos in eight languages.
- Nationwide PDP expansion with 68 Prescription Drug Plans (Classic and Value Script) in all 34 regions, featuring competitive premiums, $0 Tier 1 copays, and $0 cost-sharing for ACIP-recommended vaccines.
- The 2026 Medicare Annual Enrollment Period runs from Oct. 15–Dec. 7, 2025 for coverage effective Jan. 1, 2026.
- Wellcare Medicare Advantage plans will be available to more than 51 million beneficiaries (over 75% of eligible) across 32 states, with footprint expanded by 51 counties in eight states.
- Plan benefits include $0 or low copays for primary care visits, insulin cost capped at $35 or 25% of the negotiated price, $0 cost-sharing for ACIP-recommended Part D vaccines, and a network of over 60,000 pharmacies.
- Medicare Prescription Drug Plans offer two products (Classic and Value Script) in all 34 regions (68 PDPs), featuring $0 Tier 1 copay and competitive low-premium options.
Fintool News
In-depth analysis and coverage of CENTENE.

Quarterly earnings call transcripts for CENTENE.
Ask Fintool AI Agent
Get instant answers from SEC filings, earnings calls & more