Earnings summaries and quarterly performance for COSTAR GROUP.
Executive leadership at COSTAR GROUP.
Andrew C. Florance
Chief Executive Officer and President
Christian Lown
Chief Financial Officer
Frank Simuro
Chief Technology Officer
Frederick Saint
President, Marketplaces
Gene Boxer
General Counsel and Corporate Secretary
Lisa Ruggles
Senior Vice President, Global Operations
Board of directors at COSTAR GROUP.
Research analysts who have asked questions during COSTAR GROUP earnings calls.
Peter Christiansen
Citigroup Inc.
9 questions for CSGP
Ryan Tomasello
Keefe, Bruyette & Woods
9 questions for CSGP
Curtis Nagle
Bank of America
6 questions for CSGP
Jeffrey Meuler
Robert W. Baird & Co. Incorporated
5 questions for CSGP
Stephen Sheldon
William Blair & Company
5 questions for CSGP
Alexei Gogolev
JPMorgan Chase & Co.
4 questions for CSGP
Brett Huff
Stephens Inc.
4 questions for CSGP
George Tong
Goldman Sachs
4 questions for CSGP
Stephen Sheldon
William Blair
4 questions for CSGP
John Campbell
Stephens Inc.
3 questions for CSGP
Andrew Boone
JMP Securities
2 questions for CSGP
Craig Huber
Huber Research Partners
2 questions for CSGP
Jeffrey Silber
BMO Capital Markets
2 questions for CSGP
Keen Fai Tong
Goldman Sachs Group Inc.
2 questions for CSGP
Nicholas Jones
Citizens JMP
2 questions for CSGP
Scott Wurtzel
Wolfe Research
2 questions for CSGP
Sid Chhabra
RBC Capital Markets
2 questions for CSGP
Ashish Sabadra
RBC Capital Markets
1 question for CSGP
Basal Wit
Deutsche Bank
1 question for CSGP
Basil Witte
Deutsche Bank
1 question for CSGP
Jun Yong
Wells Fargo & Company
1 question for CSGP
Jun Zhang
Wells Fargo
1 question for CSGP
Surinder Thind
Jefferies Financial Group
1 question for CSGP
Recent press releases and 8-K filings for CSGP.
- D.E. Shaw slams CoStar’s recent segment reorganization, which folds Homes.com into a broader “Residential” unit and ceases separate disclosure of Homes.com net new bookings, accusing management of obscuring underperformance.
- The stock fell 9% the day after the announcement, wiping out nearly $2 billion in market value, reflecting investor concern over the reduced visibility into Homes.com’s metrics.
- D.E. Shaw argues the move erodes accountability for the underperforming unit, noting CoStar’s shares are trading near seven-year lows, and demands enhanced board oversight to restore transparency.
- National U.S. apartment rents rose to $1,716 in February 2026, a +0.1% increase from December’s revised $1,714.
- Annual rent growth slowed to 0.4% in February 2026, down from 0.6% in January 2026 and +1.5% in February 2025.
- Month-over-month, 38 of the top 50 markets posted gains; Richmond led at +0.8%, while San Francisco delivered the strongest annual increase at +5.7%.
- Elevated supply pressures continue to temper momentum, with Sun Belt metros like Austin (-5.1%) and Phoenix (-3.3%) recording the steepest annual declines.
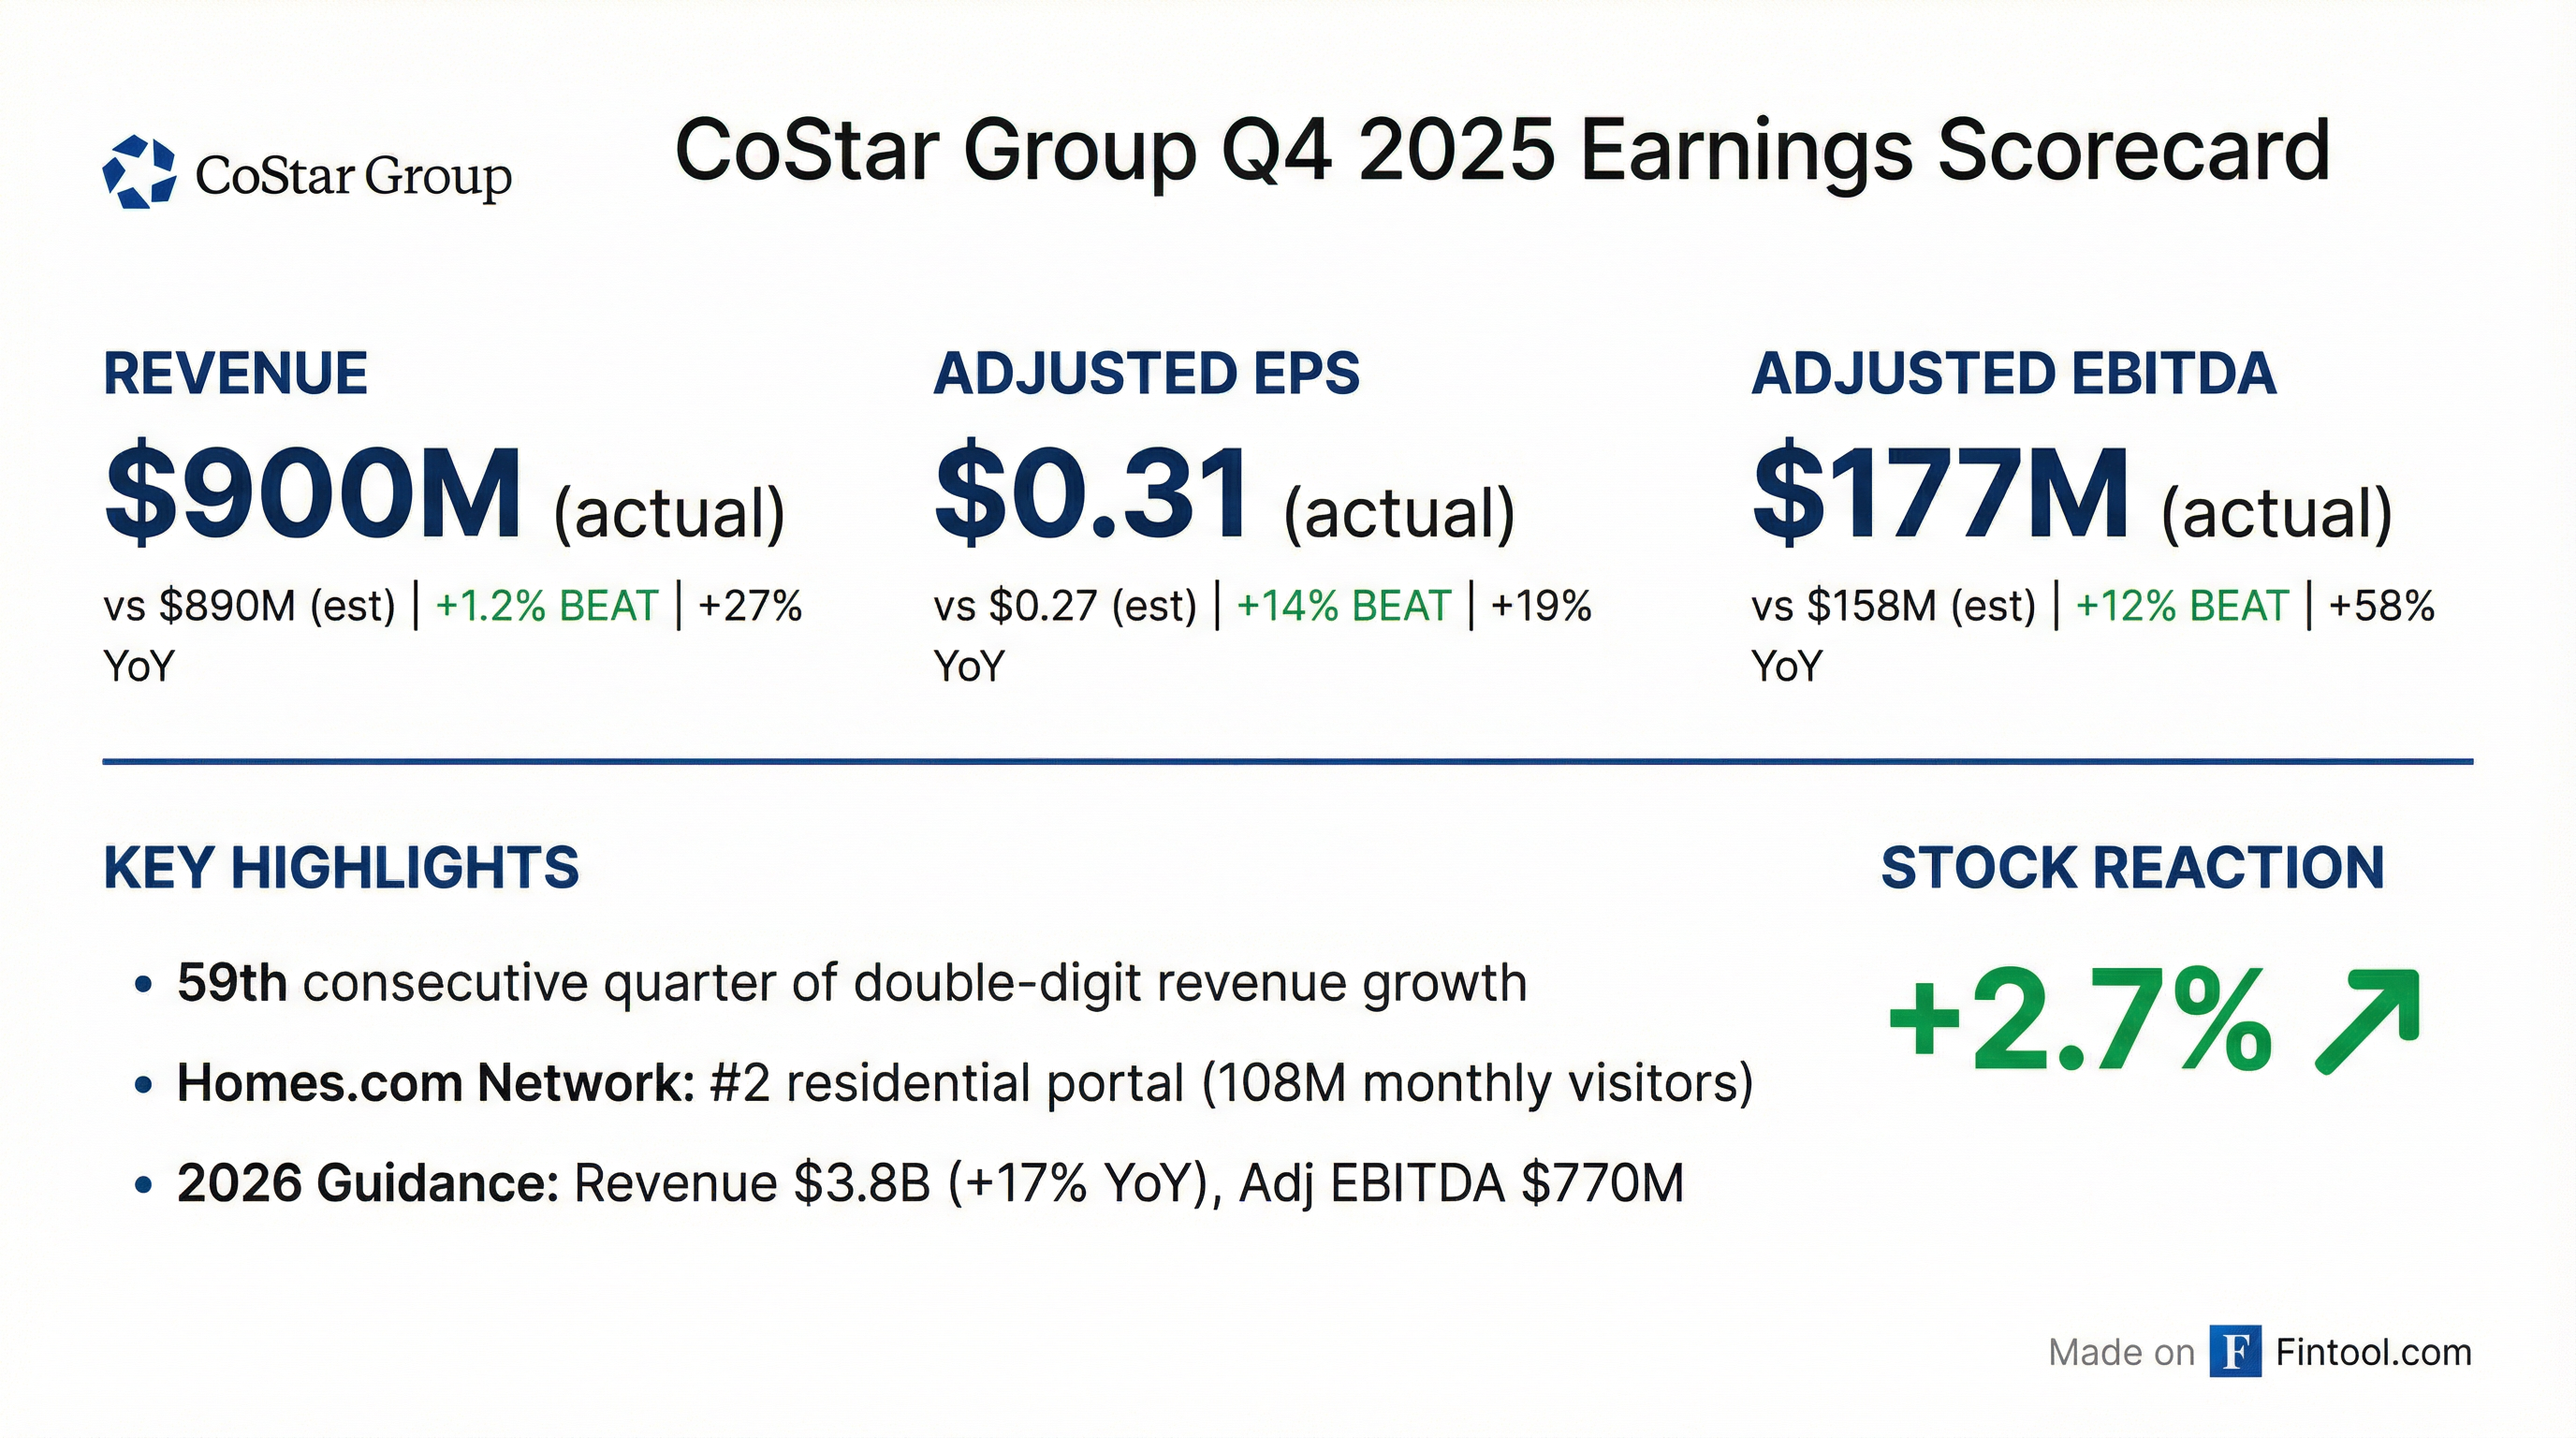
- CoStar delivered Q4 revenue of $900 million (27% y/y) and FY 2025 revenue of $3.2 billion (19% y/y); adjusted EBITDA was $442 million, up 83% y/y (14% margin).
- The company affirmed 2026 guidance: revenue of $3.78 billion–$3.82 billion (16–18% y/y growth) and adjusted EBITDA of $740 million–$800 million (20–21% margin).
- In 2025, the residential segment generated $1.46 billion in revenue (+20% y/y) and the commercial segment $1.79 billion (+18%); 2026 segment guidance is $1.825 billion–$1.845 billion for residential and $1.955 billion–$1.975 billion for commercial.
- The board authorized a new $1.5 billion share repurchase, with $700 million planned in 2026—including a $500 million accelerated buyback in Q1.
- CoStar launched Homes AI, an AI-driven home-search interface; AI users spend ~16 min 50 sec on site vs. 4 min 24 sec for non-AI users and submit 7× more leads, enhancing residential engagement.
- CoStar Group posted Q4 revenue of $900 million (up 27% YoY) and full‐year 2025 revenue of $3.2 billion (up 19% YoY), alongside full‐year adjusted EBITDA of $442 million (14% margin, +83% YoY).
- The newly defined commercial segment generated $1.79 billion in 2025 revenue (up 18% YoY), while the residential segment achieved $1.46 billion (up 20% YoY, 12% organic).
- For 2026, CoStar affirmed guidance of $3.78–3.82 billion in revenue (16–18% growth) and $740–800 million in adjusted EBITDA (20–21% margin), with quarterly EBITDA margins expected to expand by ~5 p.p. each quarter.
- Announced a $700 million share repurchase program in 2026, comprising a $500 million accelerated share repurchase this quarter and $200 million in open‐market buys.
- CoStar Group delivered Q4 revenue of $900 million (+27% Y/Y) and FY 2025 revenue of $3.2 billion (+19% Y/Y).
- GAAP net income was $47 million in Q4 and $7 million for FY, with Q4 adjusted EBITDA of $177 million (20% margin) and FY adjusted EBITDA of $442 million (14% margin).
- CoStar Group sites averaged 139 million unique visitors in Q4 2025; the Homes.com network reached 108 million.
- 2026 guidance calls for Q1 revenue of $890 million–$900 million (22%–23% Y/Y) and FY revenue of $3.78 billion–$3.82 billion; a $1.5 billion stock repurchase program was authorized, with $700 million expected to be repurchased in 2026.
- Q4 2025 revenue was $900 M, up 27% YoY; full‐year 2025 revenue reached $3.2 B, a 19% increase.
- Full‐year 2025 adjusted EBITDA was $442 M, up 83% YoY; 2026 full‐year adjusted EBITDA guidance of $740 M–$800 M (20–21% margin) and Q1 2026 EBITDA of $95 M–$115 M.
- 2025 segment revenues: Commercial at $1.79 B (+18%) and Residential at $1.46 B (+20%).
- Net new bookings in FY 2025 totaled $308 M (+23%), with Q4 2025 bookings of $75 M (+42%).
- 2026 revenue guidance of $3.78 B–$3.82 B (16–18% growth) and Q1 2026 revenue of $890 M–$900 M (+22–23%).
- Revenue for the year ended December 31, 2025 was $3.2 billion, up 19% year-over-year; Q4 2025 revenue was $900 million, up 27% versus Q4 2024.
- Profitability: Net income was $7 million for full-year 2025 and $47 million in Q4 2025; Adjusted EBITDA rose 83% to $442 million for the year and 58% to $177 million in Q4.
- Record net new bookings of $308 million in 2025; the Company completed $500 million of share repurchases in Q4 and plans to repurchase $700 million in 2026.
- 2026 guidance: full-year revenue of $3.78 billion – $3.82 billion (≈17% growth) and Adjusted EBITDA of $740 million – $800 million; Q1 2026 revenue of $890 million – $900 million and Adjusted EBITDA of $95 million – $115 million; Adjusted EPS of $1.22 – $1.33 for the year and $0.16 – $0.19 for Q1.
- Revenue of $3.2 B for the full year, up 19% YoY; Q4 revenue was $900 M, a 27% increase over Q4 2024.
- GAAP net income of $7 M (EPS $0.02) in FY 2025; adjusted net income of $364 M (+23%) and adjusted EBITDA of $442 M (+83%).
- Q4 2025 net income was $47 M (EPS $0.11); adjusted EBITDA of $177 M, a 58% YoY rise.
- Recorded net new bookings of $308 M for the year.
- Announced a $700 M share repurchase plan for 2026 after completing $500 M in Q4 2025.
- CoStar Group launched Homes AI, a real-time, voice-enabled AI experience on Homes.com powered by Microsoft Azure OpenAI, enabling two-way conversational home searches.
- Homes AI draws on Homes.com’s property database, Matterport 3D digital twins, images, proprietary school and neighborhood data, and market intelligence to deliver personalized guidance.
- The AI operates entirely within Homes.com’s proprietary ecosystem and does not train external models, while upholding “Your Listing, Your Lead” to route buyer and renter inquiries directly to listing agents.
- CoStar plans to roll out this AI capability across its other platforms, including Apartments.com, LoopNet, Land.com, and BizBuySell.
- CoStar Group has already refreshed its board with three new independent directors (including two recommended by D.E. Shaw and Third Point) and appointed a new independent board chair in response to activist demands.
- The company formed a Capital Allocation Committee and will reduce Homes.com net investment by $300 million in 2026 (and $100 million annually thereafter) to achieve break-even by 2029 while increasing commercial product investments.
- CoStar has accelerated its $500 million share repurchase program initiated in 2025 and authorized an additional $1.5 billion repurchase in January 2026.
- After engaging the top 50 stockholders (representing 77% of shares), CoStar implemented a redesigned 2026 executive compensation program with more rigorous, quantitative goals, enhanced transparency, and a simplified structure.
- Despite 14 meetings over nine months (including two with independent directors only), CoStar asserts D.E. Shaw’s narrative mischaracterizes the board’s engagement and understates the value creation plan for Homes.com.
Fintool News
In-depth analysis and coverage of COSTAR GROUP.

Quarterly earnings call transcripts for COSTAR GROUP.
Ask Fintool AI Agent
Get instant answers from SEC filings, earnings calls & more