Earnings summaries and quarterly performance for HCA Healthcare.
Executive leadership at HCA Healthcare.
Sam Hazen
Chief Executive Officer
Jon Foster
Executive Vice President and Chief Operating Officer
Michael Cuffe
Executive Vice President and Chief Clinical Officer
Michael Marks
Executive Vice President and Chief Financial Officer
Michael McAlevey
Executive Vice President – Chief Legal and Administrative Officer
Board of directors at HCA Healthcare.
Andrea Smith
Director
Hugh Johnston
Director
John Chidsey
Director
Michael Michelson
Independent Presiding Director
Nancy-Ann DeParle
Director
Robert Dennis
Director
Thomas Frist III
Chairman
Wayne Riley
Director
William Frist
Director
Research analysts who have asked questions during HCA Healthcare earnings calls.
Andrew Mok
Barclays
8 questions for HCA
Ann Hynes
Mizuho Financial Group
8 questions for HCA
Pito Chickering
Deutsche Bank
8 questions for HCA
Ryan Langston
TD Cowen
8 questions for HCA
Brian Tanquilut
Jefferies
7 questions for HCA
Joshua Raskin
Nephron Research
7 questions for HCA
Matthew Gillmor
KeyCorp
7 questions for HCA
Benjamin Hendrix
RBC Capital Markets
6 questions for HCA
Scott Fidel
Stephens Inc.
6 questions for HCA
Whit Mayo
Leerink Partners
6 questions for HCA
Justin Lake
Wolfe Research, LLC
5 questions for HCA
Raj Kumar
Stephens
5 questions for HCA
Jason Cassorla
Guggenheim Partners
4 questions for HCA
Lance Wilkes
Sanford C. Bernstein & Co., LLC
4 questions for HCA
Sarah James
Cantor Fitzgerald
4 questions for HCA
Stephen Baxter
Wells Fargo
4 questions for HCA
A.J. Rice
UBS Group AG
3 questions for HCA
Albert Rice
UBS
3 questions for HCA
Craig Hettenbach
Morgan Stanley
3 questions for HCA
Joanna Gajuk
Bank of America
3 questions for HCA
Kevin Fischbeck
Bank of America
3 questions for HCA
Stephen Baxter
Wells Fargo & Company
3 questions for HCA
Anna
Wolfe Research
2 questions for HCA
Ben Hendricks
RBC Capital Markets
2 questions for HCA
Benjamin Mayo
Leerink Partners
2 questions for HCA
Benjamin Rossi
JPMorgan Chase & Co.
2 questions for HCA
Ben Rossi
JPMorgan Chase & Co.
2 questions for HCA
Gabby
Cantor Fitzgerald
2 questions for HCA
Jamie Perse
The Goldman Sachs Group, Inc.
2 questions for HCA
John Ransom
Raymond James
2 questions for HCA
A.J. Rice
UBS
1 question for HCA
Anna Barsanti
Wolfe Research, LLC
1 question for HCA
Craig Haughton
Morgan Stanley
1 question for HCA
Josh Raskin
Nathron Research
1 question for HCA
Meghan Holtz
Jefferies Financial Group Inc.
1 question for HCA
Recent press releases and 8-K filings for HCA.
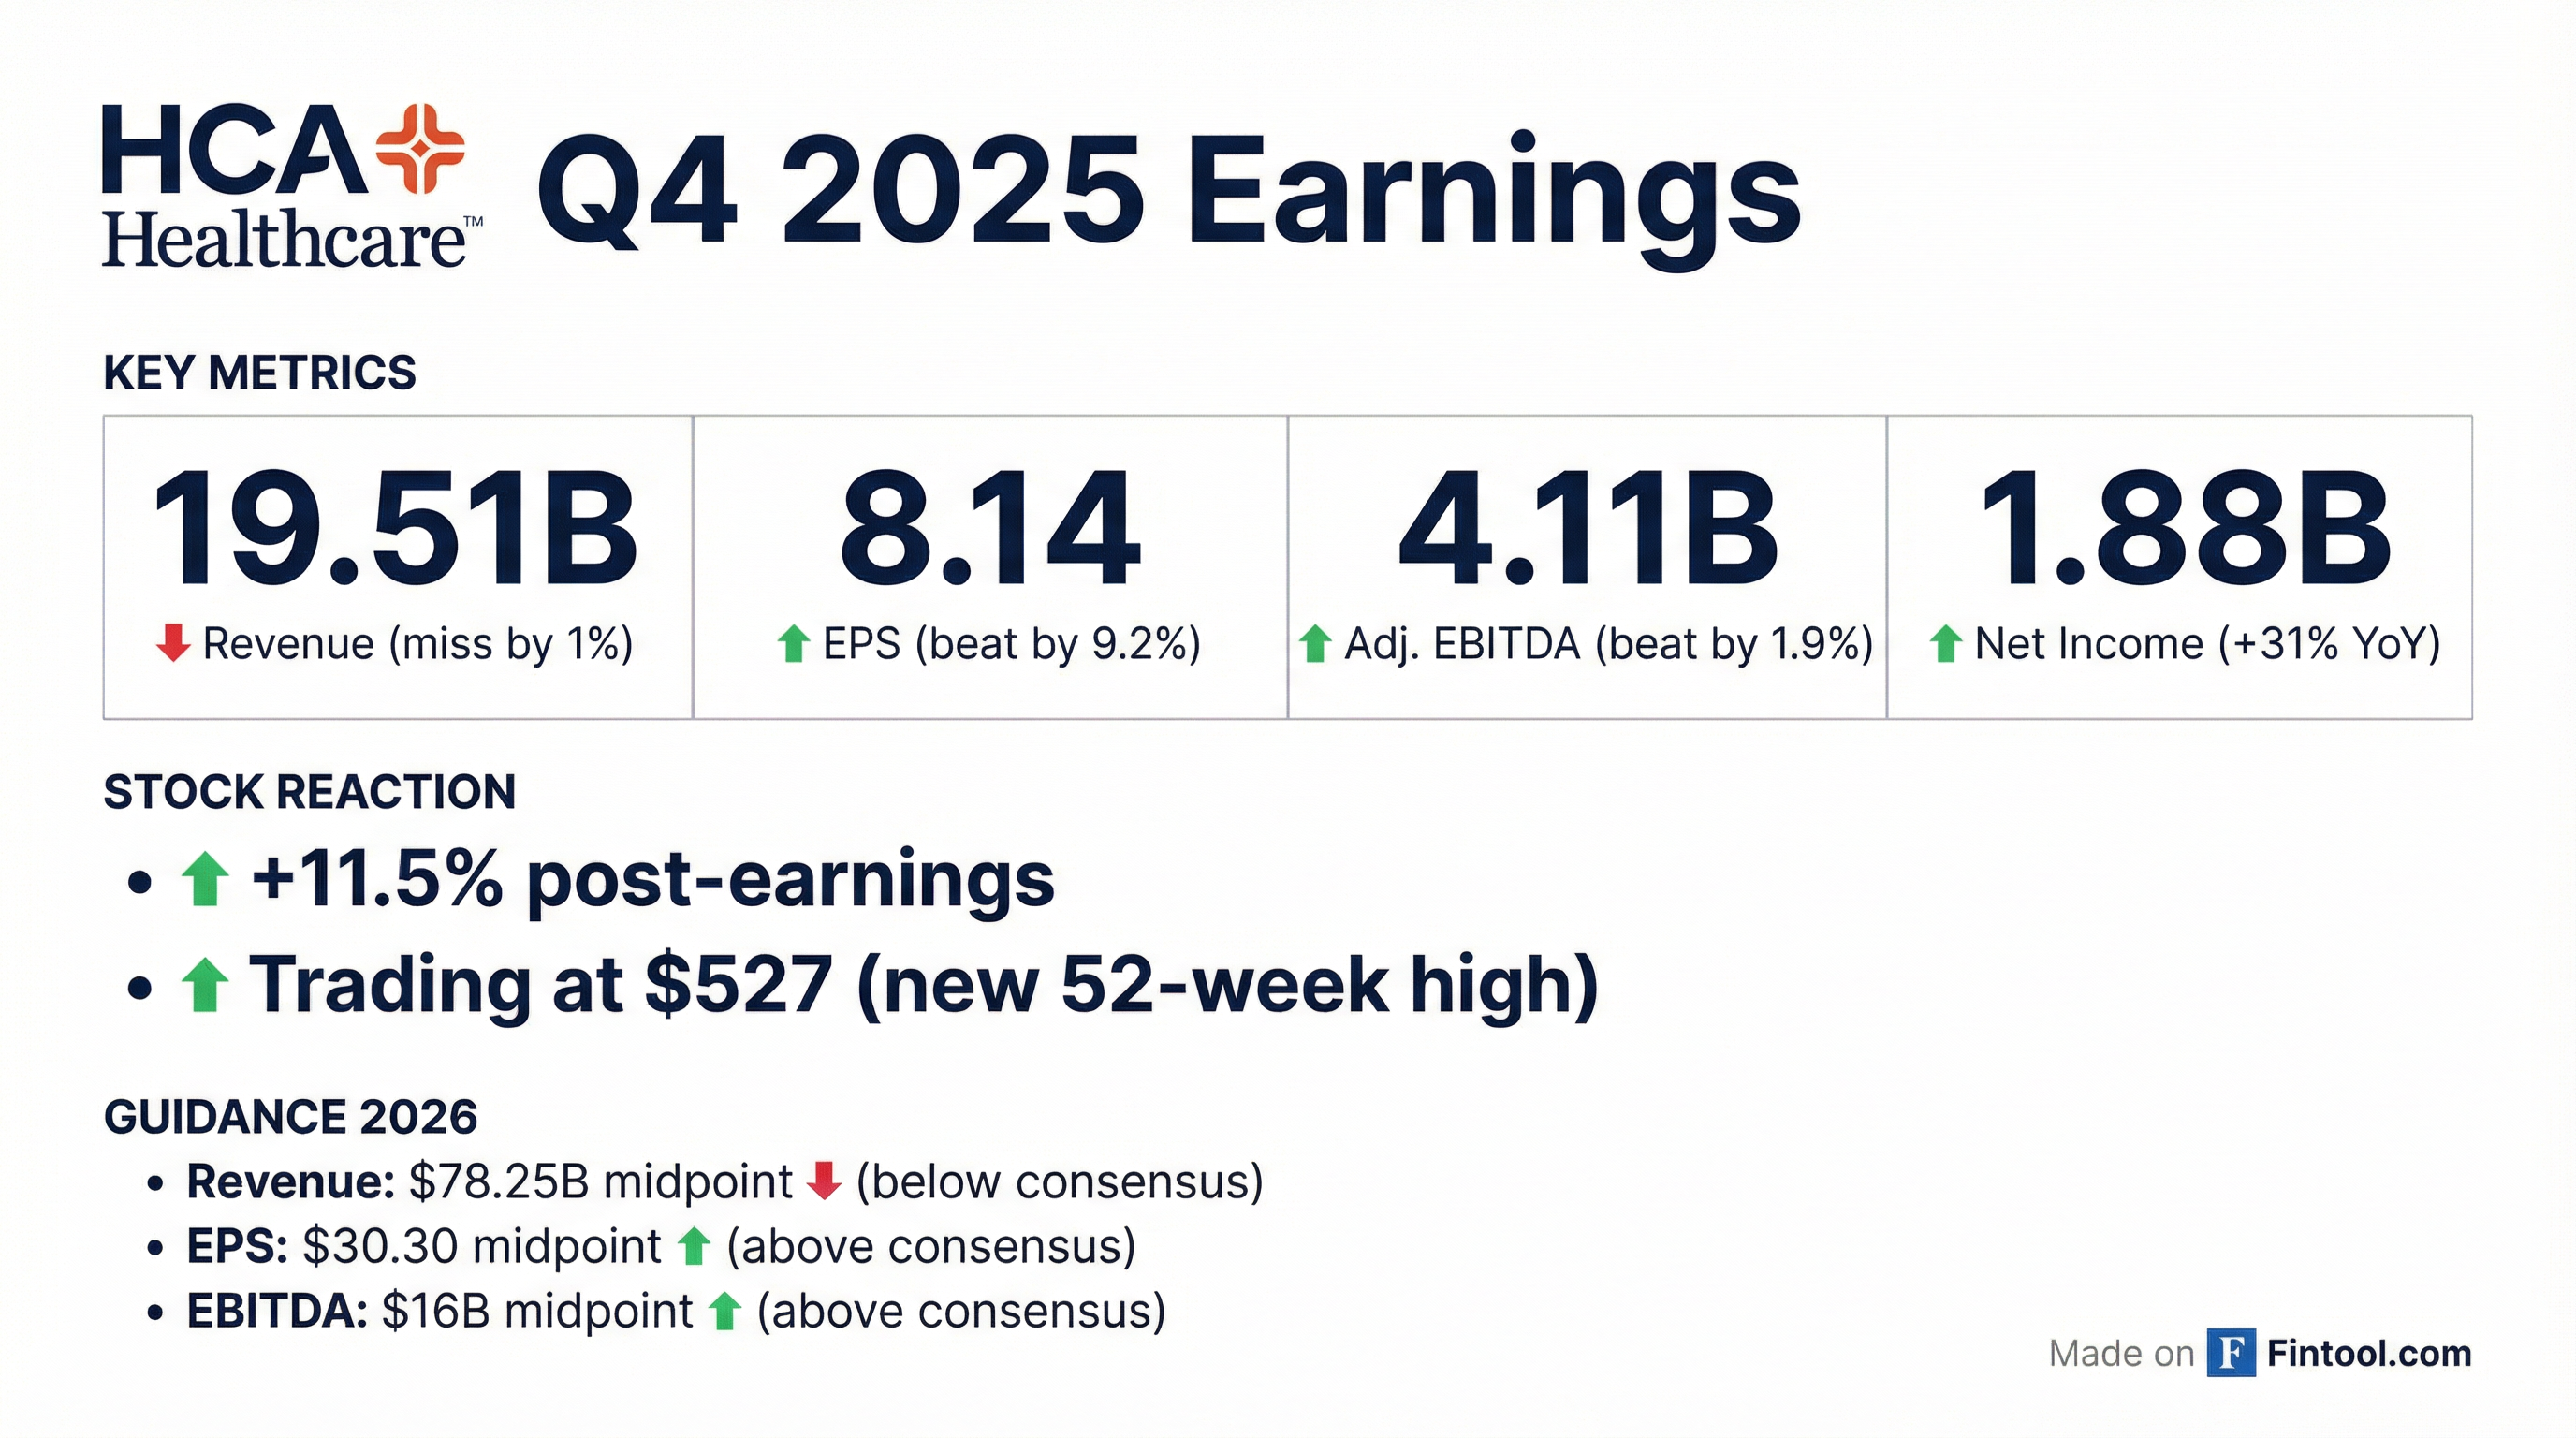
- HCA delivered 6.7% revenue growth, 31% net income increase, 29% adjusted EPS growth, and 11% adjusted EBITDA growth in Q4 2025.
- Same-facility volumes in Q4 saw admissions +2.4% and equivalent admissions +2.5%, with flat inpatient surgeries, a slight decline in outpatient surgeries, and ER visits +0.5% year-over-year.
- FY 2025 results included 6.6% revenue growth, 2.4% equivalent admissions growth, 4.1% net revenue per equivalent admission increase, 12.1% adjusted EBITDA growth, 90 bps margin expansion, and 28.5% adjusted EPS growth.
- Q4 capital expenditures were $1.5 B (FY $4.9 B), share repurchases $2.6 B (FY $10 B), dividends $162 M (FY $679 M), and cash flow from operations $2.4 B (FY $12.6 B, +20% YoY).
- 2026 guidance assumes revenues of $76.5–80 B, adjusted EBITDA $15.55–16.45 B, net income $6.5–7 B, EPS $29.10–31.50, capital spending $5–5.5 B, and operating cash flow $12–13 B, with exchange and supplemental payment headwinds partially offset by $400 M of resiliency savings.
- HCA delivered 6.7% revenue growth in Q4 2025, driving 31% Y/Y net income increase, 29% adjusted EPS growth, and 11% adjusted EBITDA gain; volume marked the 19th consecutive quarter of growth.
- For full-year 2025, same-facility revenue rose 6.6%, equivalent admissions 2.4%, adjusted EBITDA 12.1%, with 90 bps margin expansion; operating cash flow reached $12.6 billion, capex totaled $4.9 billion, and $10 billion in share repurchases were completed.
- 2026 guidance forecasts $76.5 billion–$80 billion in revenue, $15.55 billion–$16.45 billion in adjusted EBITDA, $6.5 billion–$7 billion in net income, and $29.10–$31.50 in adjusted EPS, with capex of $5 billion–$5.5 billion.
- Anticipated headwinds include a $600 million–$900 million EBITDA impact from exchange reforms and a $250 million–$450 million decline in Medicaid supplemental payments, offset by $400 million of resiliency cost savings; equivalent admissions growth is expected at 2%–3% in 2026.
- Delivered 19th straight quarter of volume growth with revenue rising 6.7% YoY; net income attributable to HCA Healthcare up ~31%, adjusted EPS +29%, and adjusted EBITDA +11% in Q4.
- Same-facility Q4 volume metrics: admissions +2.4%, equivalent admissions +2.5%; payer mix shifts: commercial equivalent admissions +1.1%, Medicare +3.5%, Medicaid +2.2%.
- Full-year 2025 results: same-facility revenue +6.6%, adjusted EBITDA +12.1%; operating cash flow $12.6 B (+20% YoY); capex $4.9 B; share repurchases $10 B and dividends $679 M.
- 2026 guidance: revenues $76.5 B–$80 B, adjusted EBITDA $15.55 B–$16.45 B, net income $6.5 B–$7 B, adjusted EPS $29.10–$31.50; capex $5 B–$5.5 B; new $10 B share buyback program and dividend raised to $0.78/sh.
- HCA posted Q4 revenues of $19.513 billion, up 6.7%, and net income attributable to HCA of $1.878 billion, a 30.6% increase; diluted EPS rose 44.6% to $8.14 ($8.01 as adjusted).
- As of December 31, 2025, $1.040 billion in cash and cash equivalents, $46.492 billion in total debt, and $60.720 billion in total assets; Q4 operating cash flow was $2.359 billion.
- Repurchased 5.432 million shares for $2.558 billion in Q4, with $750 million remaining under the current authorization, and approved an additional $10 billion buyback program.
- Declared a $0.78 quarterly dividend per share payable March 31, 2026, and provided 2026 guidance for revenues of $76.5–$80.0 billion, net income of $6.495–$7.035 billion, adjusted EBITDA of $15.55–$16.45 billion, and diluted EPS of $29.10–$31.50.
- HCA Healthcare reported Q4 revenues of $19.513 billion, up 6.7%, and net income of $1.878 billion, up 30.6%; adjusted EPS rose 28.8% to $8.01.
- For FY 2025, revenues reached $75.600 billion (+7.1%), with net income of $6.784 billion and EPS of $28.33.
- Issued 2026 guidance projecting revenues of $76.5 billion to $80.0 billion, net income of $6.495 billion to $7.035 billion, adjusted EBITDA of $15.55 billion to $16.45 billion, and EPS of $29.10 to $31.50.
- Declared a $0.78 quarterly dividend per share and authorized an additional $10 billion share repurchase program.
- 80% of hospitals are now deploying AI for operational efficiency, driving the global healthcare AI market from $17.2 billion in 2025 to $77.2 billion by 2035.
- VentriPoint Diagnostics has partnered with the Nisg̱a’a Valley Health Authority to deliver its VMS+ 3D volumetric cardiac imaging system via a hub-and-spoke model in remote and Indigenous communities.
- Doximity reported Q2 FY2026 revenue of $168.5 million (+23% YoY), operating cash flow of $93.9 million (+37% YoY), and raised its full-year 2026 revenue guidance to $640 million–$646 million.
- Oscar Health has deployed its Oswell AI agent across 2.1 million members and will launch zero-cost virtual care plans on January 1, 2026, in partnership with systems including HCA Healthcare.
- Cognizant is rolling out Anthropic’s Claude to 350,000 associates, while Certara has launched TFL Studio—cutting regulatory submission component creation time by 50%—and will release its AI PK Reports module this quarter.
- HCA projects 2%–3% volume growth driven by expanded hospital-centric networks and outpatient facilities across 43 U.S. markets and Central London, backed by ~600 inpatient beds added annually and a robust outpatient development pipeline.
- The company’s resiliency framework includes workforce development via Galen College of Nursing’s expansion from four campuses in 2021 to 20+ campuses by 2025 (targeting 30 by 2030), operational efficiencies such as a 2% reduction in length of stay, and revenue cycle enhancements to reduce denials and underpayments.
- Exchange enrollment rose 30% in 2024 (with 40% volume growth) and 13% in 2025 (with 10% volume growth), demonstrating enrollment–utilization alignment; 58% of Medicare revenue is now from Medicare Advantage, with durable volumes despite incremental utilization management.
- Same-facility professional fees increased ~10% year-to-date driven by anesthesia and radiology provider shortages; emergency and hospital medicine costs have stabilized following the Velasco acquisition, though professional fee pressures are expected to stay above inflation.
- HealthTrust GPO initiatives have mitigated tariff headwinds, and AI-driven digital and shared-service platforms are being leveraged to improve supply chain, administrative, and clinical efficiencies.
- 2%–3% volume growth expected across HCA’s 43 U.S. markets and Central London, reflecting strong market fundamentals and expanded hospital-outpatient networks.
- Deploying $4–5 billion annually in capital (with $6.7 billion in-flight), and planning to expand from 14 to 20 outpatient facilities per hospital by decade end.
- Three resiliency pillars: workforce development (e.g., Galen College of Nursing, GME residencies), operations (≈2% length-of-stay reduction), and financial efficiency (revenue cycle improvements, shared services, digital/AI).
- Medicaid reform impacts deferred to FY 2028 and beyond; Kansas, Texas, Virginia approvals secured with three additional state reviews ongoing under CMS grandfathering rules.
- HCA reaffirms above long-term guidance revenue and earnings growth for 2025, deploying ~$5 billion in capital this year with $6.7 billion under construction to expand hospitals and networks.
- The company increased its outpatient network to 14 facilities per hospital (from 10:1 pre-pandemic), aiming for 20:1 by decade-end with urgent care centers, freestanding ERs, surgery centers and clinics.
- Resiliency initiatives emphasize workforce development (Galen College of Nursing grew from 4 to 20 campuses, targeting 30 by 2030), a 2% reduction in length of stay to optimize asset utilization, and digital/AI enhancements across revenue cycle and supply chain.
- Five state Medicaid supplemental payment applications were filed on time, with approvals in Kansas, Texas and Virginia; broader Medicaid reforms phase in from FY 2028 and are expected to be manageable for HCA.
- Professional fees rose ~10% year-over-year in 3Q, driven by anesthesia and radiology pressures, with integration of the Velasco emergency and hospital medicine practice helping to stabilize and align physician services.
- Management reports mid-2% volume growth YTD and expects 2–3% growth in 2026, with the fate of enhanced premium tax credits as a key swing factor; utilization drop for uninsured patients is estimated at <50%.
- The “one big beautiful bill” provider tax reforms begin in fiscal year 2028, phased over 5–7 years, with reduced impact in non-expansion states.
- Early AI deployments include a nurse handoff tool live in 8 hospitals (broader 2026 rollout) and revenue cycle models targeting denials and underpayments, plus ambient documentation pilots.
- Capital spend in 2025 will be ~$5 billion (≈40% maintenance), funding ~600 inpatient beds annually and expanding outpatient assets toward 20 facilities per hospital by decade-end.
- A comprehensive resiliency program — spanning revenue integrity, asset utilization, cost control, and digital transformation — underpins margin improvement, with multiyear length-of-stay opportunities.
Quarterly earnings call transcripts for HCA Healthcare.
Ask Fintool AI Agent
Get instant answers from SEC filings, earnings calls & more