Earnings summaries and quarterly performance for TransDigm Group.
Executive leadership at TransDigm Group.
Board of directors at TransDigm Group.
David Barr
Director
Gary McCullough
Director
Jane Cronin
Director
Kevin Stein
Director
Michael Graff
Director
Michele Santana
Director
Peter Palmer
Director
Robert Small
Lead Independent Director
Sean Hennessy
Director
W. Nicholas Howley
Chairman
Research analysts who have asked questions during TransDigm Group earnings calls.
Gautam Khanna
TD Cowen
6 questions for TDG
Kenneth Herbert
RBC Capital Markets
6 questions for TDG
Myles Walton
Wolfe Research, LLC
6 questions for TDG
Scott Mikus
Melius Research
6 questions for TDG
Noah Poponak
Goldman Sachs
5 questions for TDG
Robert Stallard
Vertical Research Partners
5 questions for TDG
Scott Deuschle
Deutsche Bank
5 questions for TDG
Kristine Liwag
Morgan Stanley
4 questions for TDG
Seth Seifman
JPMorgan Chase & Co.
4 questions for TDG
Sheila Kahyaoglu
Jefferies
4 questions for TDG
David Strauss
Barclays
3 questions for TDG
Gavin Parsons
UBS Group AG
3 questions for TDG
Jason Gursky
Citigroup Inc.
3 questions for TDG
Ronald Epstein
Bank of America
3 questions for TDG
Peter Arment
Robert W. Baird & Co.
2 questions for TDG
Eleanor
Jefferies
1 question for TDG
Eleanor Neild
Jefferies
1 question for TDG
Joel Santos
UBS
1 question for TDG
Jordan Linus
Bank of America
1 question for TDG
Jordan Lyonnais
Bank of America
1 question for TDG
Mariana Perez Mora
Bank of America
1 question for TDG
Michael Ciarmoli
Truist Securities, Inc.
1 question for TDG
Recent press releases and 8-K filings for TDG.
- Commercial OEM revenues rose 17%, commercial aftermarket 7%, and defense 7% year-over-year in Q1 2026 on a pro forma basis.
- Delivered 7.4% organic growth, 52.4% EBITDA margin, and generated ~$900 million of free cash flow in Q1 2026.
- Ended the quarter with $2.5 billion of cash and a net debt/EBITDA ratio of 5.7x, maintaining liquidity for operations and acquisitions.
- Announced three acquisitions—Stellent Systems (~$960 M, 2025 revenue
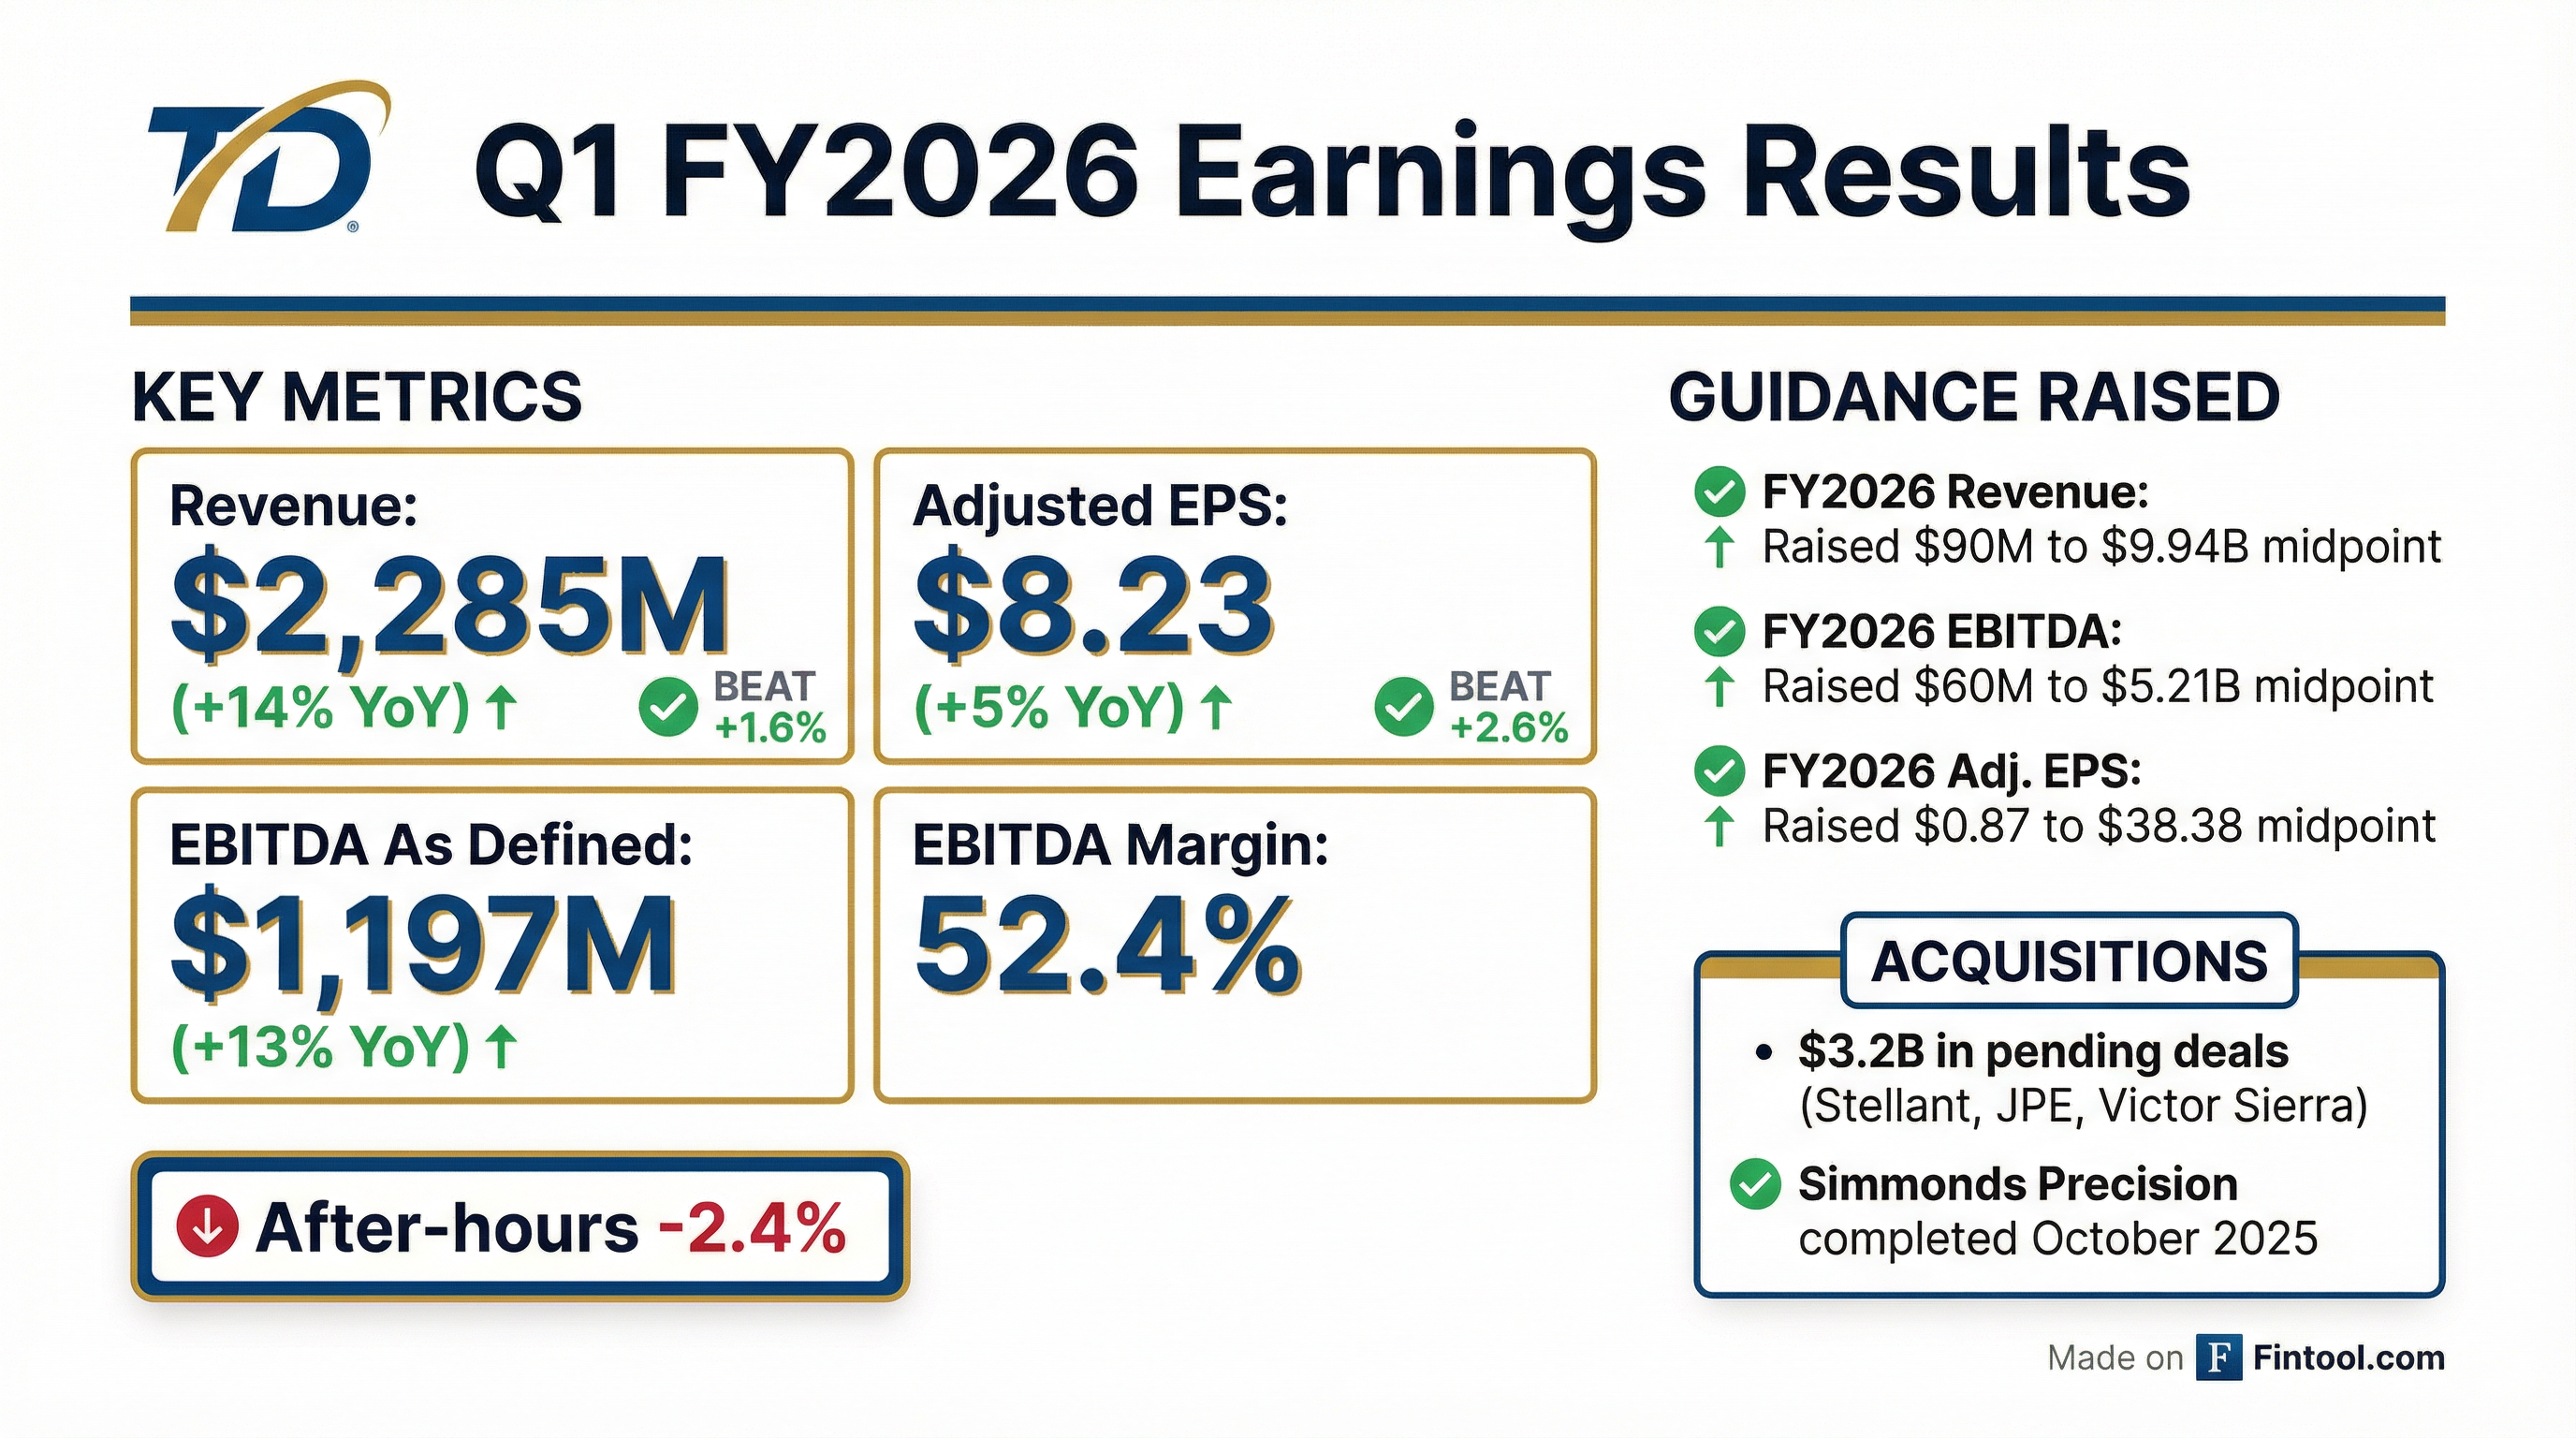
$300 M), Jet Parts Engineering & Victor Sierra ($2.2 B, 2025 revenue ~$280 M)—aligned with TransDigm’s aftermarket-focused M&A strategy. - Raised fiscal 2026 guidance to $9.94 billion in revenue (+13% YoY) and $5.21 billion in EBITDA (+9%), with an expected margin of ~52.4%, excluding pending acquisitions.
- Revenue of $2,285 million, up 13.9% year-over-year in Q1 FY 2026.
- EBITDA As Defined of $1,197 million, a 12.8% increase versus prior year.
- Adjusted EPS of $8.23, up 5.1% from $7.83 in Q1 FY 2025.
- Fiscal 2026 guidance reiterated with revenues of $9,845–$10,035 million and Adjusted EPS of $37.42–$39.34.
- Organic growth of 7.4%, EBITDA margin of 52.4%, and free cash flow of ~$900 million in Q1; ended the quarter with $2.5 billion of cash and a net debt/EBITDA ratio of 5.7×
- Q1 revenue grew 17% in commercial OEM, 7% in commercial aftermarket, and 7% in defense markets on a pro forma basis
- Raised full-year 2026 guidance: revenue midpoint of $9.94 billion (+13%), EBITDA midpoint of $5.21 billion (+9%), and adjusted EPS of $38.38, excluding pending acquisitions
- Announced acquisitions of Stellant Systems (~$960 million), Jet Parts Engineering and Victor Sierra Aviation (combined
$2.2 billion), leaving **$10 billion** in remaining M&A firepower - Deployed >$100 million on share repurchases in Q1, reiterating priority on organic reinvestment, disciplined M&A, and shareholder returns
- TransDigm delivered 7.4% organic growth in Q1 2026, with pro forma channel growth of 17% in commercial OEM, 7% in commercial aftermarket, and 7% in defense.
- Q1 EBITDA margin was 52.4%, free cash flow was $900 million, and cash on hand ended at $2.5 billion; net debt/EBITDA was 5.7x, and the company repurchased $100 million of shares.
- Full-year 2026 guidance was raised to $9.94 billion in revenue (+13%) and $5.21 billion in EBITDA defined (+9%), with adjusted EPS of $38.38, assuming no further acquisitions.
- TransDigm signed three acquisitions—Stellent Systems ($960 million, $300 million revenue), Jet Parts Engineering and Victor Sierra Aviation ($2.2 billion, $280 million revenue)—leaving $10 billion in M&A capacity.
- TransDigm delivered net sales of $2,285 million, up 14% year-over-year, with net income of $445 million and GAAP EPS of $6.62; adjusted EPS rose to $8.23 from $7.83 in Q1 2025.
- Q1 EBITDA As Defined was $1,197 million, a 12.8% increase, representing a 52.4% margin on net sales.
- The company raised its full-year 2026 guidance, forecasting net sales of $9,845–$10,035 million (midpoint +12.6%), GAAP EPS of $32.47–$34.39, and EBITDA As Defined of $5,140–$5,280 million.
- TransDigm completed the acquisition of Simmonds Precision Products and announced agreements to acquire Stellant, Jet Parts Engineering, and Victor Sierra for approximately $3.2 billion in aggregate.
- TransDigm delivered Q1 net sales of $2,285 million, up 13.9% year-over-year, with net income of $445 million and GAAP EPS of $6.62.
- EBITDA As Defined reached $1,197 million (52.4% margin), and adjusted EPS was $8.23, a 5.0% increase.
- The company raised its full-year fiscal 2026 guidance to $9,845 million–$10,035 million in net sales (12.6% growth at the midpoint) and adjusted EPS of $37.42–$39.34.
- Subsequent to quarter end, TransDigm agreed to acquire Stellant, Jet Parts Engineering and Victor Sierra for approximately $3.2 billion of capital deployment.
- TransDigm Group agrees to acquire Jet Parts Engineering and Victor Sierra Aviation from Vance Street Capital for $2.2 billion.
- Jet Parts Engineering is a leading independent designer and manufacturer of proprietary aerospace aftermarket solutions, serving commercial, regional and cargo airlines as well as MRO providers.
- Victor Sierra Aviation offers a complete line of proprietary PMA and OEM-aftermarket parts for general and business aviation through brands including McFarlane Aviation and Tempest Aero Group.
- The transaction aligns with TransDigm’s strategic focus on expanding its portfolio of highly engineered aerospace components in the aftermarket segment.
- Harris Williams and Paul Hastings acted as advisors to the sellers, and Baker Hostetler served as legal advisor to TransDigm.
- TransDigm Group enters a definitive agreement to acquire Jet Parts Engineering and Victor Sierra Aviation Holdings for $2.2 billion in cash, including certain tax benefits.
- Jet Parts Engineering (JPE) is a Seattle-based designer and manufacturer of proprietary PMA aftermarket parts, employing approximately 300 people across the U.S. and U.K..
- Victor Sierra Aviation Holdings (VSA) offers PMA and other aftermarket parts for general and business aviation—through brands like McFarlane Aviation and Tempest Aero—and employs around 400 staff at facilities in Kansas, North Carolina, Illinois, and satellite locations.
- The combined companies generated $280 million in revenue for the calendar year ended December 31, 2025; the acquisition is subject to U.S. regulatory approvals and customary closing conditions.
- TransDigm Group agreed to acquire Jet Parts Engineering and Victor Sierra Aviation Holdings for approximately $2.2 billion in cash, including certain tax benefits.
- The two companies collectively generated $280 million in revenue for the calendar year ended December 31, 2025, with nearly 100% derived from the commercial aftermarket.
- Jet Parts Engineering (300 employees) and Victor Sierra Aviation (400 employees) will operate independently under TransDigm, bolstering its portfolio of proprietary PMA aftermarket parts.
- The transaction remains subject to U.S. regulatory approvals and customary closing conditions.
- Drill hole TDG25-013 intersected 1.25 g/t Au, 2.2 g/t Ag, 0.33% Cu over 128.7 m, including 1.44 g/t Au, 2.4 g/t Ag, 0.37% Cu over 103.5 m, extending Aurora West mineralization 100 m south of previous limits.
- Visual sulphide mineralization (pyrite and chalcopyrite) was observed 500 m north of the defined Aurora West Zone in hole TDG25-020, with assays pending.
- 2026 winter drilling program is mobilizing on schedule to complete paused holes and target extensions of the Aurora West Zone, the broader Aurora Complex, and the near-surface Shasta MRE area.
Fintool News
In-depth analysis and coverage of TransDigm Group.


Quarterly earnings call transcripts for TransDigm Group.
Ask Fintool AI Agent
Get instant answers from SEC filings, earnings calls & more