Earnings summaries and quarterly performance for INTERFACE.
Executive leadership at INTERFACE.
Laurel Hurd
President and Chief Executive Officer
Bruce Hausmann
Vice President and Chief Financial Officer
David Foshee
Vice President, General Counsel and Secretary
James Poppens
Vice President and Chief Commercial Officer
Nigel Stansfield
Vice President and Chief Innovation & Sustainability Officer
Board of directors at INTERFACE.
Catherine Kilbane
Director
Catherine Marcus
Director
Christopher Kennedy
Chairman of the Board
Daniel Hendrix
Director
David Kohler
Director
Dwight Gibson
Director
John Burke
Director
Joseph Keough
Director
Robert O'Brien
Director
Research analysts who have asked questions during INTERFACE earnings calls.
David Macgregor
Longbow Research
6 questions for TILE
Brian Biros
Stephens Inc.
5 questions for TILE
Alexander Paris
Barrington Research Associates, Inc.
4 questions for TILE
Alex Paris
Barrington Research Associates
2 questions for TILE
Reuben Garner
Stifel
2 questions for TILE
Kathryn Thompson
Thompson Research Group
1 question for TILE
Recent press releases and 8-K filings for TILE.
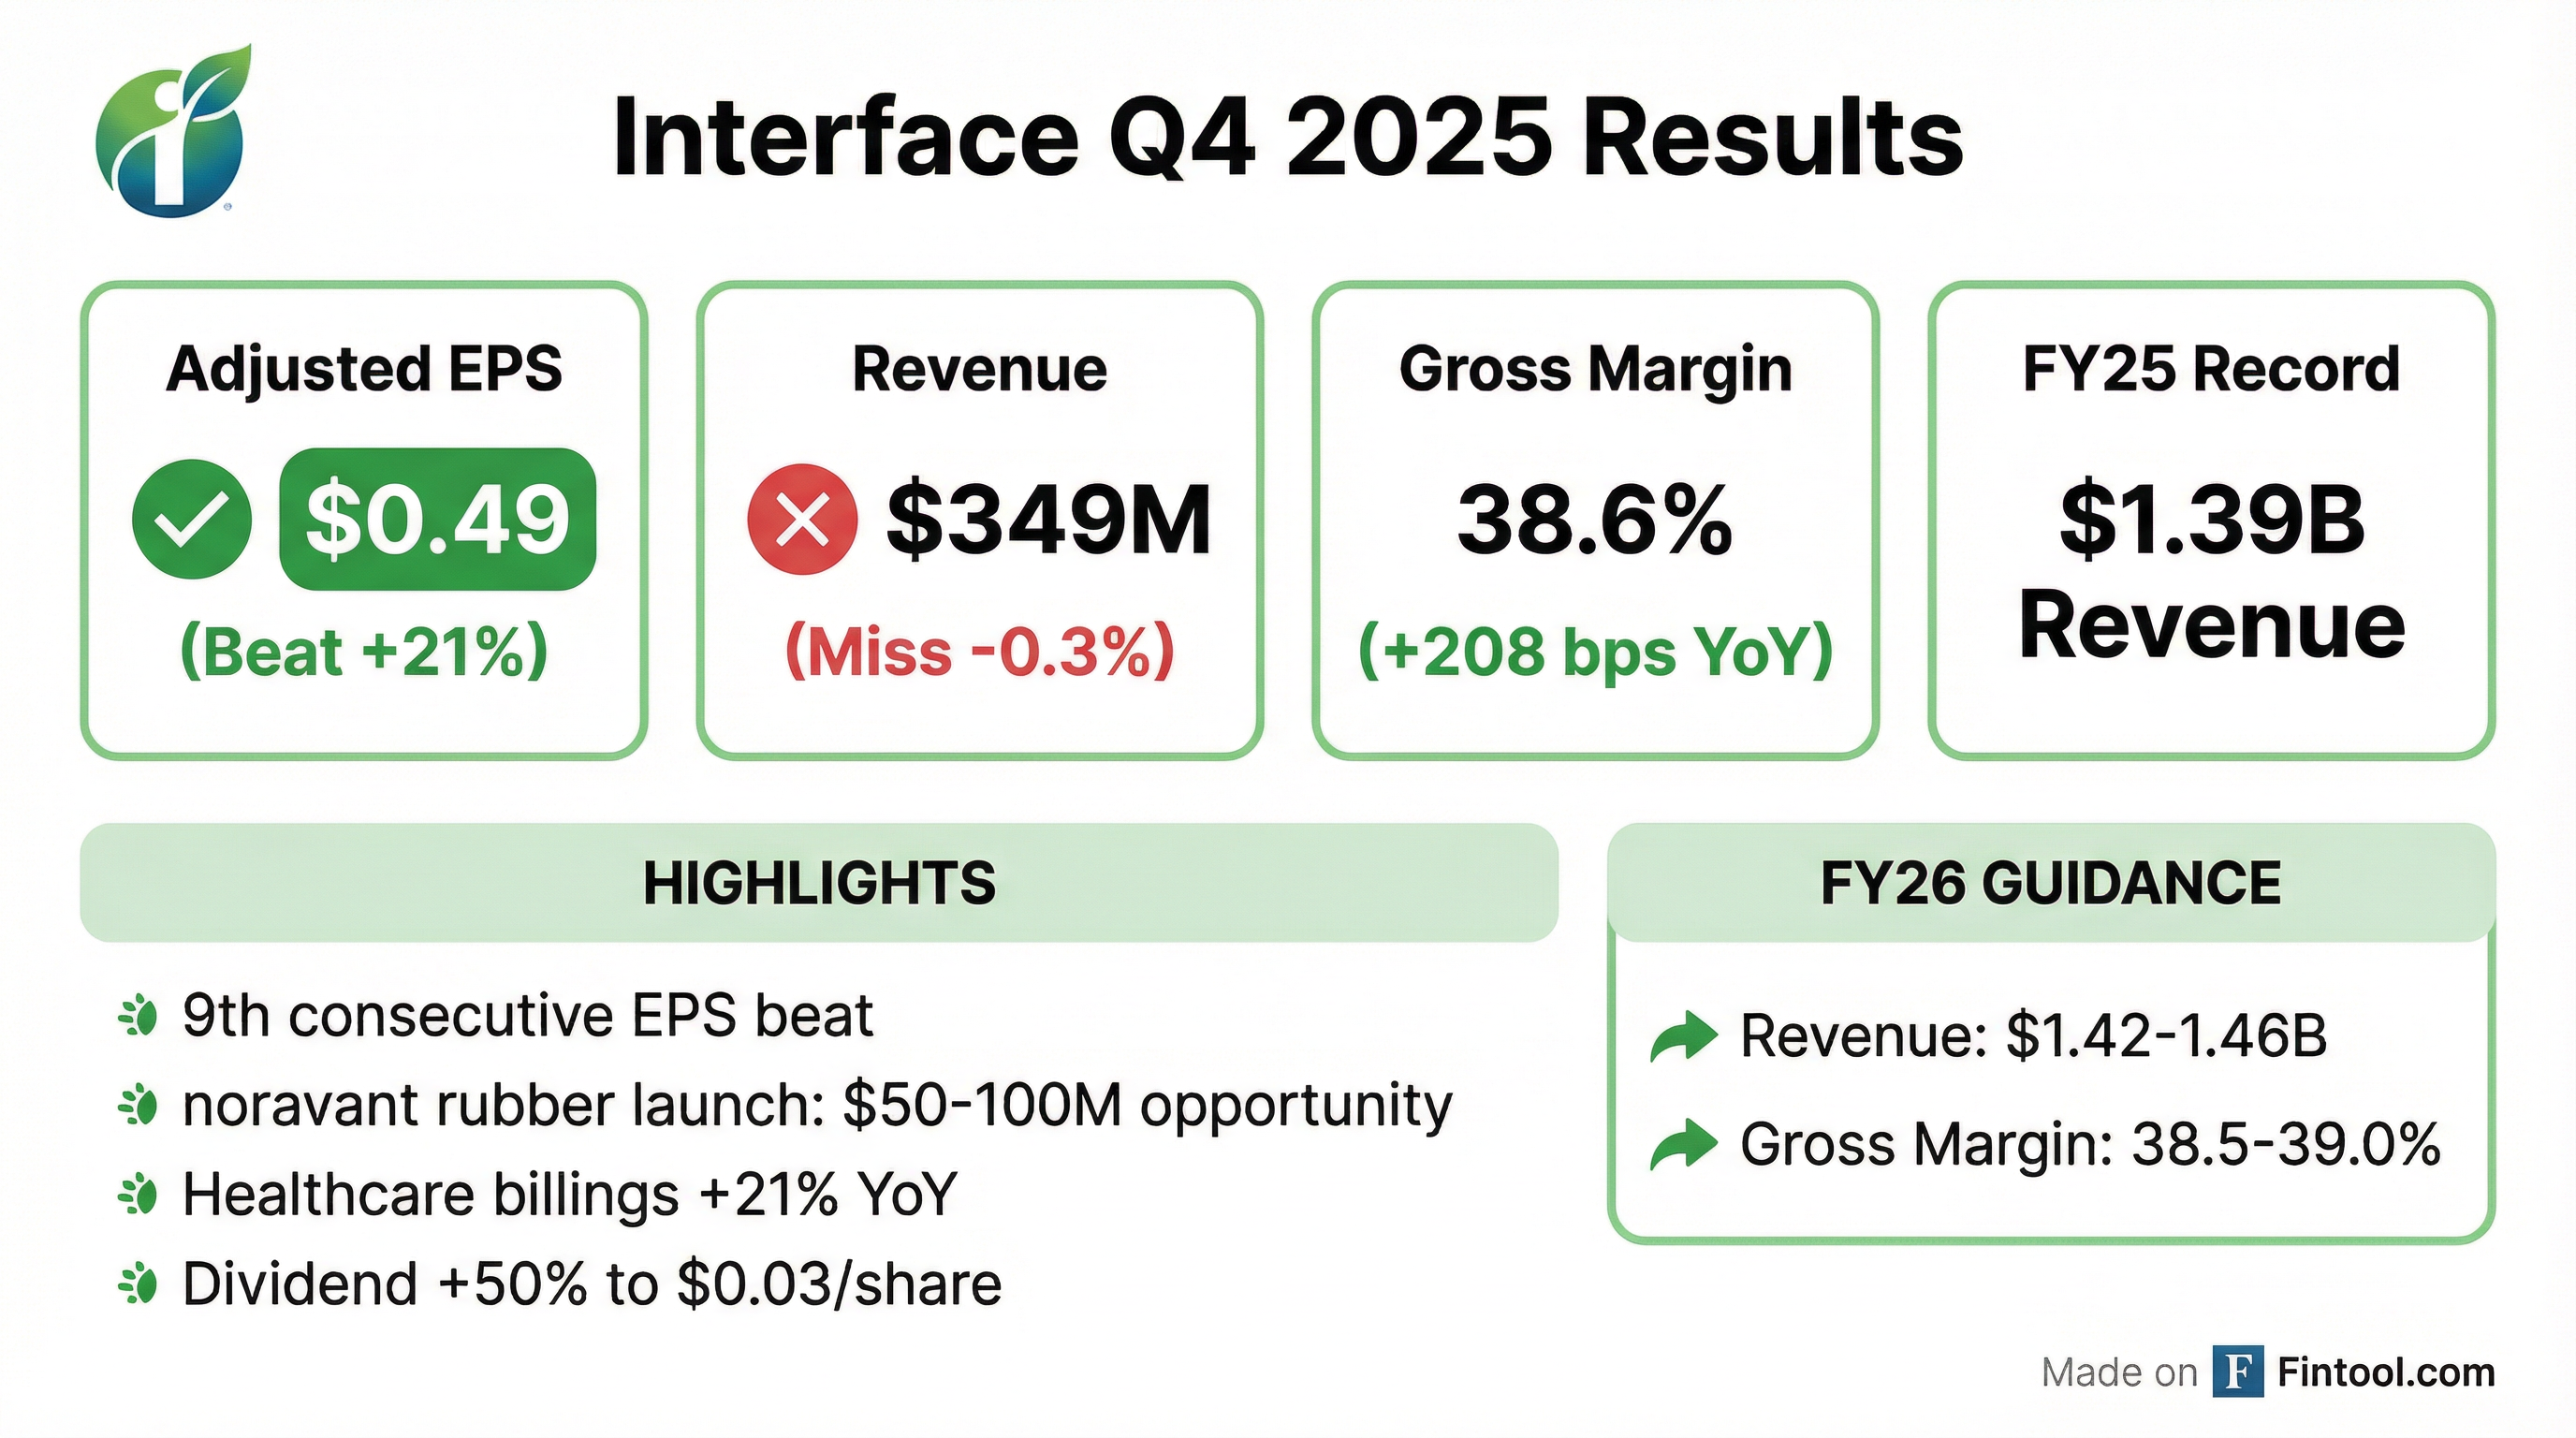
- Interface reported a record year in 2025, with full-year currency-neutral net sales increasing 4% year-over-year to $1.39 billion and adjusted EPS rising 33% to $1.94.
- The company's full-year adjusted gross profit margin expanded to 39%, with Q4 2025 adjusted gross profit margin at 38.6%, achieving its long-term ambition ahead of schedule.
- Growth was driven by the One Interface strategy, leading to a 21% increase in global healthcare billings and an 8% increase in education billings in 2025. Global rubber billings were also up 17%.
- Interface launched noravant, a new PVC-free rubber flooring innovation, which is anticipated to expand the addressable market and contribute to revenue starting in the fourth quarter of 2026.
- Interface reported Net Sales of $349.4 million for Q4 2025 and $1,386.9 million for the full fiscal year 2025, achieving currency neutral year-over-year Net Sales growth of +4.3% for FY 2025.
- For fiscal year 2025, the company's Adjusted Diluted EPS was $1.94, and its Adjusted Gross Profit Margin reached 39.0%.
- Interface demonstrated a strong financial foundation with a Net Debt / LTM Adjusted EBITDA ratio of 0.5x and Adjusted EBITDA of $217.9 million for FY 2025.
- The company's strategy focuses on accelerating growth through enhanced commercial productivity and expanding margins through global supply chain management.
- Interface achieved a record year in 2025, with net sales, Adjusted Operating Income, and Adjusted EBITDA reaching their highest levels in the company's history, driven by the One Interface strategy.
- For the full year 2025, net sales grew 5.4% to $1.39 billion, and adjusted earnings per diluted share increased 33% to $1.94. The adjusted gross profit margin expanded to 39%.
- The company is launching noravant, a new groundbreaking rubber flooring innovation, which is expected to generate $5 million-$10 million in revenue in 2026 and $50 million-$100 million over the next five years.
- For fiscal year 2026, Interface anticipates net sales of $1.42 billion-$1.46 billion and an adjusted gross profit margin of 38.5%-39%.
- Interface increased its quarterly dividend from $0.02 to $0.03 per share and repurchased $18.2 million of common stock in 2025.
- Interface achieved a record year in 2025 for net sales, Adjusted Operating Income, and Adjusted EBITDA, attributing the success to its One Interface strategy.
- For fiscal year 2025, net sales grew 5.4% to $1.39 billion, with adjusted gross profit margin expanding to 39% and adjusted EPS increasing 33% to $1.94.
- The company issued FY 2026 guidance, projecting net sales between $1.42 billion and $1.46 billion and an adjusted gross profit margin of 38.5%-39%.
- Interface demonstrated commitment to shareholder returns by repurchasing $18.2 million of common stock in FY 2025 and increasing its quarterly dividend from $0.02 to $0.03 per share.
- A new rubber flooring innovation, noravant, was launched, expected to contribute $5 million-$10 million in revenue in 2026, supported by a 7% increase in backlog entering the fiscal year.
- Interface, Inc. delivered record 2025 sales of $1,387 million, an increase of 5.4% year-over-year, with GAAP earnings per diluted share of $1.96 and adjusted earnings per diluted share of $1.94.
- For the fourth quarter of 2025, net sales totaled $349 million, up 4.3% year-over-year, and adjusted earnings per diluted share were $0.49.
- The company generated $49 million of cash from operations in Q4 2025, repaid $128 million of debt, and repurchased $13 million of common stock.
- Interface anticipates Q1 Fiscal Year 2026 net sales to be between $315 million and $325 million, and full fiscal year 2026 net sales to be between $1.420 billion and $1.460 billion.
- Interface reported record full fiscal year 2025 net sales of $1,387 million, a 5.4% increase year-over-year, and adjusted earnings per diluted share of $1.94, up 33%.
- For the fourth quarter of 2025, net sales reached $349 million, growing 4.3% year-over-year, with adjusted earnings per diluted share at $0.49.
- The company generated $49 million of cash from operations in Q4 2025, repaid $128 million of debt, and repurchased $13 million of common stock.
- Interface projects full fiscal year 2026 net sales between $1.420 billion and $1.460 billion.
- Interface, Inc. entered into a Third Amended and Restated Syndicated Facility Agreement on December 3, 2025, extending the maturity date of its revolving and term loan credit facilities from October 14, 2027 to December 3, 2030.
- The company added a new term loan facility in an aggregate principal amount of $170 million, which was fully drawn at closing, and reduced its revolving credit facility from $300 million to $250 million.
- At closing, the total indebtedness under the Agreement was approximately $205 million, with an estimated weighted average interest rate of 5.24%.
- The Agreement includes financial covenants requiring a Consolidated Secured Net Leverage Ratio of no greater than 3.00:1.00 and a Consolidated Interest Coverage Ratio of no less than 2.25:1.00.
- Interface reported Net Sales of $364.5 million for Q3 2025, an increase of 5.9% compared to Q3 2024, with year-to-date net sales reaching $1,037.5 million, up 5.8%.
- Diluted EPS (GAAP) for Q3 2025 was $0.78, a 62.5% increase from Q3 2024, and year-to-date diluted EPS grew 39.6% to $1.55.
- Adjusted EBITDA for Q3 2025 increased by 23.3% to $66.2 million, contributing to a year-to-date adjusted EBITDA of $168.1 million, up 17.6%.
- The company significantly improved its Net Debt / Adjusted EBITDA ratio, reducing it to 0.6x as of Q3 2025, down from 1.1x in FY2024.
- Interface maintains a diversified revenue base, with 61% from the Americas, 28% from EMEA, and 10% from APAC, and key customer segments including 45% Corporate Office and 20% Education (LTM Q3 2025).
- Interface Inc. reported strong Q3 2025 net sales of $364.5 million, an increase of 5.9% as reported and 4.2% on a currency-neutral basis compared to Q3 2024, exceeding expectations.
- Profitability saw significant gains, with adjusted gross profit margin expanding by 208 basis points to 39.5% and adjusted earnings per share rising 27% to $0.61.
- Growth was broad-based across regions and product categories, notably with global healthcare billings up 29% and nora rubber sales growing 20% in the quarter.
- The company raised its full-year 2025 guidance, now projecting net sales of $1.375 to $1.390 billion and an adjusted gross profit margin of 38.5%.
- Interface generated $76.7 million in operating cash flow and repurchased $0.7 million of common stock during the quarter, while planning increased capital expenditures for productivity and innovation in 2026.
- Interface reported strong Q3 2025 financial results, with net sales of $364.5 million, up 5.9% as reported and 4.2% currency-neutral year-over-year, exceeding expectations.
- Adjusted gross profit margin expanded by 208 basis points to 39.5%, contributing to a 27% increase in adjusted earnings per share to $0.61 compared to Q3 2024.
- The company raised its full-year 2025 net sales guidance to a range of $1.375 billion to $1.390 billion and anticipates an adjusted gross profit margin of 38.5%.
- Growth was driven by the "One Interface" strategy, with global healthcare billings up 29% and nora rubber sales growing 20% in Q3 2025, alongside ongoing investments in automation and innovation.
Quarterly earnings call transcripts for INTERFACE.
Ask Fintool AI Agent
Get instant answers from SEC filings, earnings calls & more