Earnings summaries and quarterly performance for UNITED RENTALS.
Executive leadership at UNITED RENTALS.
Matthew Flannery
President and Chief Executive Officer
Andrew Limoges
Vice President, Controller and Principal Accounting Officer
Anthony Leopold
Senior Vice President, Chief Technology & Strategy Officer
Craig Pintoff
Executive Vice President and Chief Administrative Officer
Joli Gross
Senior Vice President, Chief Legal & Sustainability Officer, Corporate Secretary
Michael Durand
Executive Vice President and Chief Operating Officer
Ted Grace
Executive Vice President and Chief Financial Officer
Board of directors at UNITED RENTALS.
Francisco Lopez-Balboa
Director
Gracia Martore
Lead Independent Director
Julie Brandt
Director
Kim Harris Jones
Director
Larry De Shon
Director
Marc Bruno
Director
Michael Kneeland
Chair of the Board
Shiv Singh
Director
Terri Kelly
Director
Research analysts who have asked questions during UNITED RENTALS earnings calls.
Scott Schneeberger
Oppenheimer & Co. Inc.
6 questions for URI
Steven Fisher
UBS
5 questions for URI
Angel Castillo Malpica
Morgan Stanley
4 questions for URI
Kenneth Newman
KeyBanc Capital Markets
4 questions for URI
Kyle Menges
Citigroup
4 questions for URI
Neil Tyler
Redburn Atlantic
4 questions for URI
Steven Ramsey
Thompson Research Group
4 questions for URI
Clay Williams
Goldman Sachs
3 questions for URI
David Raso
Evercore ISI
3 questions for URI
Jamie Cook
Truist Securities
3 questions for URI
Jerry Revich
Goldman Sachs Group Inc.
3 questions for URI
Michael Feniger
Bank of America
3 questions for URI
Timothy Thein
Raymond James
3 questions for URI
Ken Newman
KeyBanc
2 questions for URI
Kevin Wilson
Truist Securities
2 questions for URI
Oliver
Morgan Stanley
2 questions for URI
Randy
Citigroup
2 questions for URI
Robert Wertheimer
Melius Research
2 questions for URI
Tim Thein
Raymond James Financial
2 questions for URI
Blake Greenhalgh
Bank of America
1 question for URI
Tami Zakaria
JPMorgan Chase & Co.
1 question for URI
Recent press releases and 8-K filings for URI.
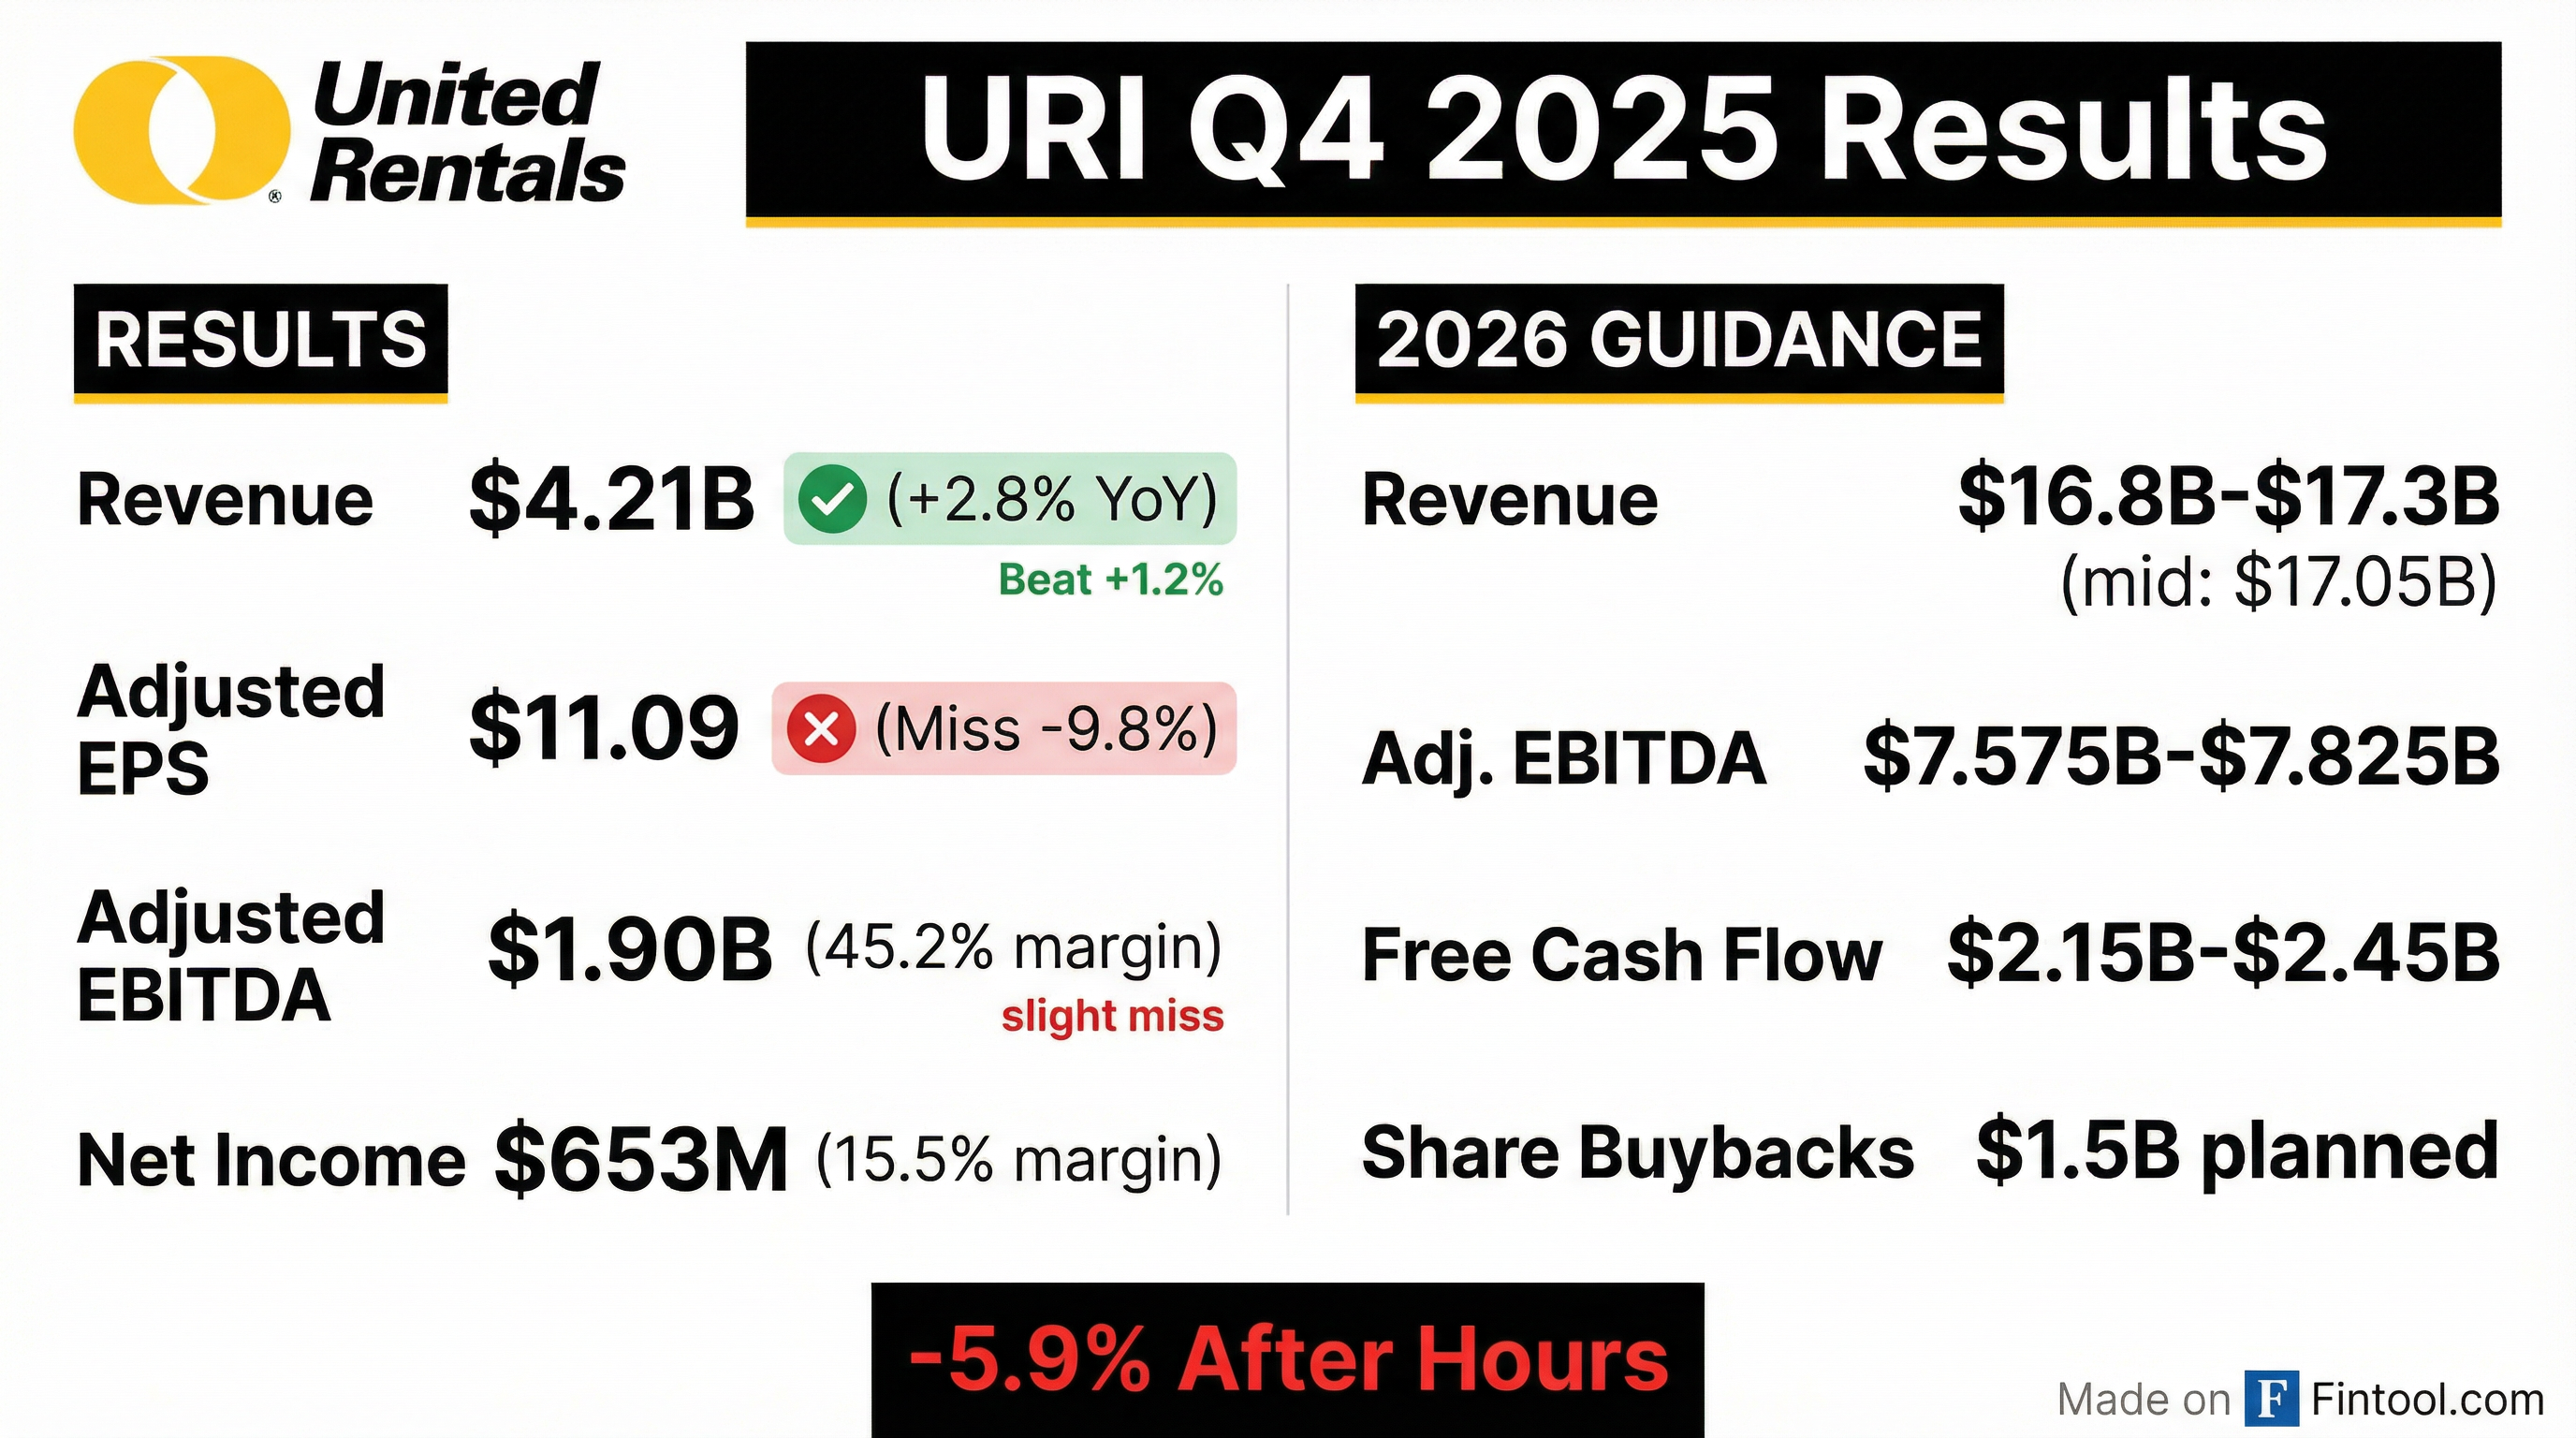
- United Rentals delivered Q4 revenue of $4.2 billion (+2.8% y/y) and rental revenue of $3.58 billion (+4.6%), generating adjusted EBITDA of $1.901 billion (45.2% margin) and adjusted EPS of $11.09.
- In Q4, the company sold $769 million of original equipment cost at a 50% recovery rate, bringing full-year used equipment sales to $2.73 billion.
- Full-year 2025 CapEx reached $4.19 billion, free cash flow was $2.18 billion (13.5% free cash flow margin), and net leverage was 1.9 ×.
- In 2025, United Rentals returned $2.4 billion to shareholders via dividends and share repurchases; for 2026, it plans $1.5 billion of buybacks and a 10% increase in quarterly dividend to $1.97/share.
- 2026 guidance includes revenue of $16.8–$17.3 billion, adjusted EBITDA of $7.575–$7.825 billion, gross CapEx of $4.3–$4.7 billion, and free cash flow of $2.15–$2.45 billion.
- Q4 revenue rose 2.8% YoY to $4.2 billion, led by rental revenue of $3.6 billion (+4.6%), with adjusted EBITDA of $1.9 billion (45.2% margin) and EPS of $11.09
- Full-year free cash flow was $2.18 billion (13.5% margin), enabling $2.4 billion returned to shareholders via $1.9 billion in share repurchases and $464 million in dividends; net leverage of 1.9× and liquidity >$3.3 billion
- Used equipment sales of $769 million in Q4 at a 50% recovery rate, with full-year OEC sales of $2.73 billion; rental CapEx of $4.19 billion in 2025
- 2026 guidance: total revenue $16.8 billion–$17.3 billion (≈6% growth ex used), adjusted EBITDA $7.575 billion–$7.825 billion, gross CapEx $4.3 billion–$4.7 billion, free cash flow $2.15 billion–$2.45 billion; dividend +10% to $1.97/qtr and $1.5 billion share repurchase plan
- United Rentals reported full-year $16.099 billion in revenue (up 4.9% YoY), $2.494 billion in net income (15.5% margin), and $7.328 billion in adjusted EBITDA (45.5% margin).
- Specialty segment revenue reached $5.873 billion, representing 36.5% of total revenue in 2025, up from 33.4% in 2024.
- Free cash flow was $2.186 billion (13.6% margin), supported by $5.190 billion in operating cash flow (32.2% margin) .
- 2026 guidance calls for $16.8 billion–$17.3 billion in revenue, $7.575 billion–$7.825 billion in adjusted EBITDA, and $2.15 billion–$2.45 billion in free cash flow.
- The quarterly dividend will increase 10% to $1.97, and share repurchases of $1.5 billion are planned for 2026.
- Q4 total revenue rose 2.8% YoY to $4.2 billion, rental revenue increased 4.6% to $3.6 billion, fleet productivity gained 0.5%, adjusted EBITDA was $1.9 billion (45.2% margin), and adjusted EPS was $11.09.
- Sold $769 million of owned equipment for rent (OEC) in Q4 at a 50% recovery rate, generating $386 million of proceeds at a 47.2% margin.
- 2025 CapEx totaled $4.19 billion, free cash flow was $2.18 billion (13.5% margin), and the company returned $2.4 billion to shareholders via $1.9 billion of buybacks and $464 million of dividends; net leverage was 1.9× with $3.3 billion liquidity.
- 2026 guidance: revenue of $16.8–17.3 billion (≈5.9% growth), adjusted EBITDA of $7.575–7.825 billion, gross CapEx $4.3–4.7 billion, free cash flow $2.15–2.45 billion, a 10% dividend increase to $1.97/qtr, and $1.5 billion of share repurchases.
- United Rentals reported Q4 total revenue of $4.208 billion, including rental revenue of $3.581 billion; net income was $653 million (15.5% margin), GAAP diluted EPS of $10.27, adjusted EPS of $11.09, and adjusted EBITDA of $1.901 billion (45.2% margin).
- For the full year, net cash provided by operating activities totaled $5.190 billion; free cash flow was $2.181 billion; full-year gross rental capex was $4.189 billion; year-end net leverage ratio was 1.9×, with total liquidity of $3.322 billion.
- The company issued 2026 guidance calling for $16.8 billion to $17.3 billion in revenue, $7.575 billion to $7.825 billion of adjusted EBITDA, $5.3 billion to $6.1 billion of operating cash flow and $2.15 billion to $2.45 billion of free cash flow; net rental capex is expected at $2.85 billion to $3.25 billion (gross $4.3 billion to $4.7 billion).
- United Rentals announced a new $5 billion share repurchase program, plans to repurchase $1.5 billion of common stock in 2026, and approved a 10% quarterly dividend increase to $1.97 per share.
- The Board of Directors approved a 10% increase in the quarterly cash dividend.
- The new dividend of $1.97 per share is payable on February 25, 2026, to holders of record as of February 11, 2026.
- United Rentals’ fleet has an original cost of $22.48 billion, supporting 1,663 North American locations and operations in Europe, Australia, and New Zealand.
- On December 1, 2025, United Rentals (North America), Inc. completed a private placement of $1.5 billion aggregate principal amount of 5.375% Senior Notes due 2033.
- The notes are senior unsecured obligations of URNA, guaranteed by United Rentals, Inc. and certain domestic subsidiaries, accrue interest at 5.375% per annum payable semi-annually on May 15 and November 15 (first payment May 15, 2026), and mature on November 15, 2033.
- Redemption provisions include callable redemption at 102.688% of principal in 2028, 101.344% in 2029 and 100.000% in 2030 and thereafter, a make-whole redemption before November 15, 2028, up to 40% equity-funded redemption at 105.375%, and a 101% change-of-control repurchase option.
- United Rentals introduced two new digital features—Smart Suggestions (ML-based equipment recommendations) and Equipment Fit AR (3D jobsite placement)—cutting equipment identification and ordering time by 27%.
- Smart Suggestions leverages customer order history, jobsite data, seasonality, and industry trends to predict equipment needs.
- Equipment Fit AR enables contractors to virtually place equipment models on-site via mobile devices, with plans to expand to additional categories.
- Developed with direct contractor and operations feedback, these tools bolster United Rentals’ digital transformation to boost retention, efficiency, and rental volumes; the stock has outperformed peers, gaining 28.9% over the past year versus a 4.3% industry decline.
- On August 7, 2025, United Rentals filed an 8-K announcing Amendment No. 1 to its Amended and Restated Credit and Guaranty Agreement with Bank of America N.A. and other lenders.
- The amendment reduces the Applicable Margin to 1.50% on Term SOFR loans and to 0.50% on Base Rate loans.
- It reaffirms all guarantees, pledges and security interests under the loan documents, which remain in full force and effect post-amendment.
- Wells Fargo Bank, N.A. commits $137.7 million as a Refinancing Term Lender, with total converting refinancing commitments of $849.8 million.
- Total Q2 revenue of $3.943 B (rental revenue $3.415 B), net income $622 M (15.8% margin), adjusted EBITDA $1.810 B (45.9% margin), and fleet productivity up 3.3% YOY.
- Raised 2025 guidance to $15.8–16.1 B in total revenue (prior $15.6–16.1 B) and $7.3–7.45 B in adjusted EBITDA (prior $7.2–7.45 B); net cash from operations now $4.9–5.5 B and free cash flow $2.4–2.6 B.
- Increased share repurchase plan by $400 M to $1.9 B for 2025 (authorization expanded to $2.0 B); YTD returned $902 M to shareholders via $667 M repurchases and $235 M dividends; quarterly dividend of $1.79 per share declared.
- Strong liquidity position with net leverage ratio at 1.8x and total liquidity of $2.996 B as of June 30, 2025.
Quarterly earnings call transcripts for UNITED RENTALS.
Ask Fintool AI Agent
Get instant answers from SEC filings, earnings calls & more