Earnings summaries and quarterly performance for ALIGN TECHNOLOGY.
Executive leadership at ALIGN TECHNOLOGY.
Joseph M. Hogan
President and Chief Executive Officer
John F. Morici
Chief Financial Officer and Executive Vice President, Global Finance
Julie Coletti
Executive Vice President, Chief Legal and Regulatory Officer
Stuart Hockridge
Executive Vice President, Global Human Resources
Board of directors at ALIGN TECHNOLOGY.
Andrea L. Saia
Director
Anne M. Myong
Director
C. Raymond Larkin, Jr.
Chairman of the Board
George J. Morrow
Director
Joseph Lacob
Director
Kevin J. Dallas
Director
Kevin T. Conroy
Director
Mojdeh Poul
Director
Susan E. Siegel
Director
Research analysts who have asked questions during ALIGN TECHNOLOGY earnings calls.
Elizabeth Anderson
Evercore ISI
6 questions for ALGN
Erin Wright
Morgan Stanley
6 questions for ALGN
Jason Bednar
Piper Sandler Companies
6 questions for ALGN
Michael Cherny
Leerink Partners
6 questions for ALGN
Brandon Vazquez
William Blair & Company, L.L.C.
5 questions for ALGN
Jonathan Block
Stifel Financial Corp.
5 questions for ALGN
Michael Ryskin
Bank of America Merrill Lynch
5 questions for ALGN
David Saxon
Needham & Company
4 questions for ALGN
Jeffrey Johnson
Robert W. Baird & Co. Inc.
4 questions for ALGN
Kevin Caliendo
UBS
4 questions for ALGN
Steven Valiquette
Mizuho
3 questions for ALGN
Vik Chopra
Wells Fargo & Company
3 questions for ALGN
Dylan Finley
B. Riley Securities
2 questions for ALGN
Jeff Johnson
Robert W. Baird & Co.
2 questions for ALGN
Michael Sarcone
Jefferies
2 questions for ALGN
Steve Valiquette
Mizuho Financial Group, Inc.
2 questions for ALGN
Glen Santangelo
Jefferies
1 question for ALGN
Jon Block
Stifel, Nicolaus & Company, Incorporated
1 question for ALGN
Russell Yuen
William Blair & Company
1 question for ALGN
Vikramjeet Chopra
Wells Fargo & Company
1 question for ALGN
Recent press releases and 8-K filings for ALGN.
- Dror’s ZSmile Platform secured 510(k) FDA clearance, validating its pneumatic tooth-movement system delivered via a single smart aligner worn during sleep.
- ZSmile is the first FDA-cleared orthodontic solution using proprietary pulsating air technology, enhanced by AI-powered cloud analytics, IoT connectivity, and an integrated mobile app for remote monitoring.
- The single-aligner model eliminates the need for sequential trays and up to 22-hour daily wear, addressing Class I and II malocclusions with minimal discomfort and disruption.
- Dror plans a phased U.S. commercial launch in select markets and key-opinion-leader practices, leveraging existing CE marking and Israeli approvals for international expansion.
- Align Partners highlights Coway’s steady global growth, citing revenue CAGR of 8.9% to KRW 5.0 trillion and operating profit CAGR of 7.7% to KRW 878.7 billion in 2025.
- It notes Coway’s 16% share price decline since 2019 and contraction of valuation multiples, with NTM PER falling from 16.9× to 8.2× and MRQ PBR from 6.0× to 1.6×.
- The firm flags a structural ROE drop from 30.7% in 2019 to 17.7% in Q3 2025 and an 11.1% ROE on equity deployed since 2020, urging improved capital structure.
- Align Partners has submitted proposals for Coway’s 37th AGM, including amendments to ensure an Independent Chairman and Audit Committee, separate Audit Committee elections, two independent director nominees, and enhanced compensation disclosure.
- Align Partners Capital Management Inc. submitted formal shareholder proposals ahead of Dentium’s 26th AGM, seeking to bolster corporate governance and capital allocation practices.
- Proposals include increasing independent directors; requiring the audit committee and new related-party and compensation committees to be composed solely of independents; appointing an independent board chair; expanding the audit committee; nominating two independent directors; and capping board remuneration and variable pay, plus a non-binding call for more executive pay transparency.
- The investor cited governance shortcomings and unclear disclosures on Dentium’s hydrogen fuel cell investments as drivers of market mistrust and sustained valuation discounts.
- As of Feb. 11, 2026, Dentium’s EV/EBITDA LTM was 6.6x vs a 14.0x global average, and its P/B stood at 0.77x vs 3.13x, underscoring a significant structural valuation gap.
- Angelalign asegura que la resolución preliminar del Tribunal Unificado de Patentes de Düsseldorf, que obliga a suspender ciertas funciones de software, tendrá repercusiones mínimas para ortodoncistas y pacientes en países europeos (excluidos España, Suiza, Reino Unido e Irlanda).
- La compañía niega que su función Live Now infrinja patentes válidas de Align Technology Inc. y ha presentado una oposición ante la Oficina Europea de Patentes solicitando la invalidez permanente de la patente.
- Angelalign cumplirá con la medida cautelar mientras trabaja para demostrar que la suspensión es injustificada y confía en superar la orden preliminar.
- Reafirma su compromiso con la innovación en alineadores transparentes y destaca productos clave como angelButton, angelHook y el sistema A6 de avance mandibular en su décimo aniversario.
- A Düsseldorf court’s preliminary injunction requires Angelalign to suspend certain automatic treatment-plan updates in select European countries (excluding Spain, Switzerland, UK and Ireland), but the company expects minimal impact on orthodontists and patients.
- Angelalign denies that its Live Now feature infringes Align Technology patents, has filed an opposition with the EPO arguing lack of novelty, and is confident it will overturn the injunction.
- In response, Angelalign will comply with the interim ruling and launch the iPlan upgrade, offering equivalent reliability and greater flexibility for affected European users.
- The company highlights its broader clear-aligner portfolio and praised flexible manufacturing system as drivers of ongoing global growth.
- Align Partners Capital Management, a shareholder of SoluM, issued a public shareholder letter and submitted formal proposals for inclusion in SoluM’s 2026 AGM agenda, requesting a written response by the convocation notice deadline.
- The letter calls for a spin-off of SoluM’s Electronic Shelf Label division and publication of a comprehensive 2026 value-up plan to address a persistent undervaluation (EV/EBIT of 28.9× vs peers at 41.1× and 41.2×).
- Governance reforms proposed include an independent director majority on the board, one-year terms for independent directors and auditors, and establishment of board committees (Nomination, Compensation, Related Party Transactions), alongside nominations of two director and one audit candidate.
- Align Partners, holder of 1.9% of DB Insurance, highlights a 60% valuation discount (PBR adj. 0.40x) despite ROE of 16.1% and a K-ICS ratio of 226%, attributing the gap to inefficient capital allocation and weak governance.
- Proposes strategic actions including a shift to ROR-based management, a 50% total capital distribution policy, immediate cancellation of 12.6% of treasury shares, cessation of disadvantageous intra-group operations, and separation of CEO and board chair roles.
- Submits shareholder resolutions for the 2026 AGM to elect two independent directors to the Audit Committee and reinstate an Internal Control Committee composed solely of external directors.
- Requests a formal board response and a revised “Value-up” plan by March 6, 2026.
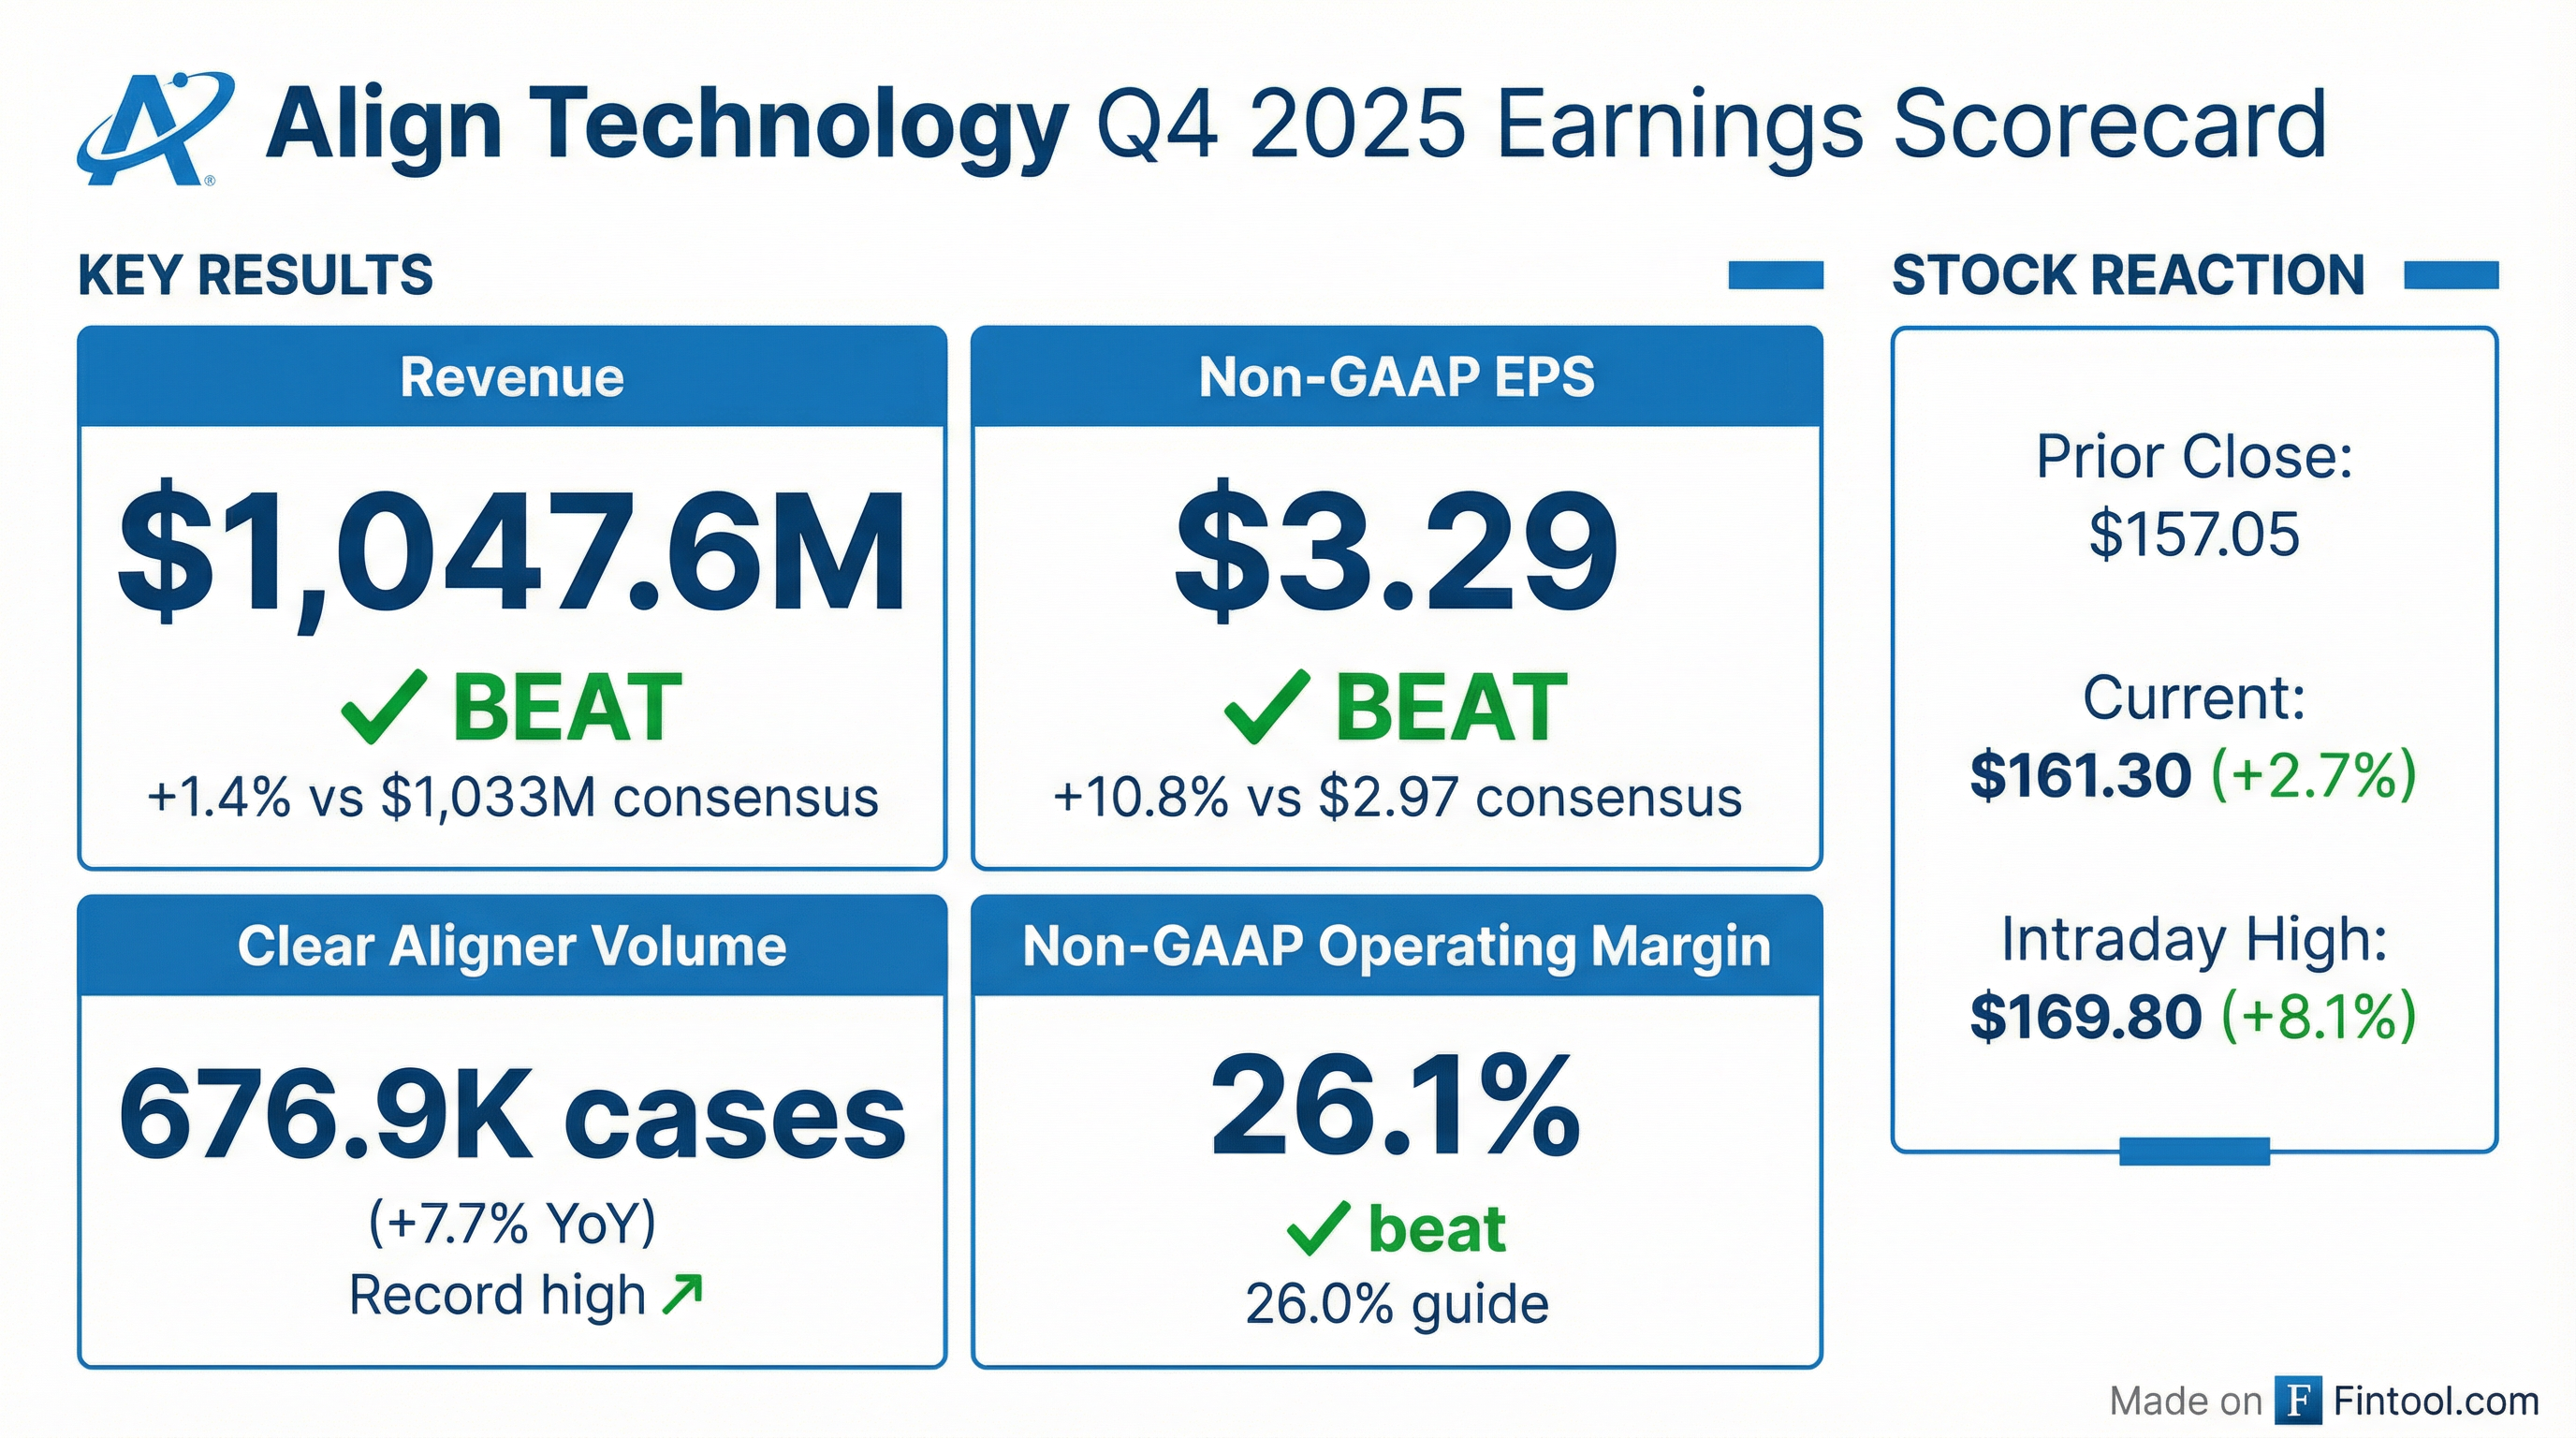
- Q4 total revenue of $1.048 billion, up 5.3% YoY; full-year 2025 revenue of $4.0 billion, up 1% YoY
- Q4 clear aligner revenue of $838 million, up 5.5% YoY, on record volume of 677,000 cases, up 7.7% YoY
- Q4 non-GAAP operating margin of 26.1%, the highest since 2021, and GAAP operating margin of 14.8%
- Q4 free cash flow of $187.3 million; cash and cash equivalents of $1.095 billion; repurchased 0.7 million shares at an average $142.87 per share in Q4
- Q1 2026 revenue outlook of $1.01–$1.03 billion (+3%–5% YoY); full-year 2026 revenue growth expected at 3%–4% with non-GAAP operating margin of ~23.7%
- Q4 revenues $1.048 B, +5.3% y/y; FY 2025 revenues $4.0 B, +1% y/y.
- Q4 clear aligner revenues $838 M, +5.5% y/y; record Q4 volume 677 K cases, +7.7% y/y; FY 2025 volume 2.6 M cases, +4.7% y/y.
- Q4 non-GAAP operating margin 26.1%, up 230 bps sequentially and highest since 2021; FY 2025 non-GAAP operating margin 22.7%.
- Q1 2026 revenue guidance $1.01 B–$1.03 B (+3%–5% y/y); FY 2026 revenue growth guidance +3%–4% with non-GAAP operating margin ~23.7%.
- Record Q4 revenues of $1.048 billion, up 5.3% year-over-year, and full-year 2025 revenues of $4 billion, up 1% year-over-year
- Q4 clear aligner revenues of $838 million with record 677,000 cases shipped, up 5.5% in revenue and 7.7% in volume year-over-year
- Non-GAAP operating margin of 26.1%, the highest since 2021, and non-GAAP gross margin of 72% in Q4
- Q1 2026 revenue guidance of $1.01 billion–$1.03 billion (up 3–5% YoY) and full-year 2026 revenue growth of 3–4%, with GAAP operating margin expected near 18%
Quarterly earnings call transcripts for ALIGN TECHNOLOGY.
Ask Fintool AI Agent
Get instant answers from SEC filings, earnings calls & more