Earnings summaries and quarterly performance for AMGEN.
Executive leadership at AMGEN.
Robert A. Bradway
Chief Executive Officer and President
David M. Reese
Executive Vice President and Chief Technology Officer
James E. Bradner
Executive Vice President, Research and Development
Murdo Gordon
Executive Vice President, Global Commercial Operations
Peter H. Griffith
Executive Vice President and Chief Financial Officer
Board of directors at AMGEN.
Amy E. Miles
Director
Brian J. Druker
Director
Charles M. Holley, Jr.
Director
Ellen J. Kullman
Director
Greg C. Garland
Director
Mary E. Klotman
Director
Michael V. Drake
Director
Robert A. Eckert
Lead Independent Director
S. Omar Ishrak
Director
Tyler Jacks
Director
Wanda M. Austin
Director
Research analysts who have asked questions during AMGEN earnings calls.
Salveen Richter
Goldman Sachs
8 questions for AMGN
Terence Flynn
Morgan Stanley
8 questions for AMGN
Yaron Werber
TD Cowen
8 questions for AMGN
David Amsellem
Piper Sandler Companies
7 questions for AMGN
Christopher Schott
JPMorgan Chase & Co.
6 questions for AMGN
Jay Olson
Oppenheimer & Co. Inc.
6 questions for AMGN
Courtney Breen
AllianceBernstein
5 questions for AMGN
Evan Seigerman
BMO Capital Markets
5 questions for AMGN
Matthew Phipps
William Blair
5 questions for AMGN
Umer Raffat
Evercore ISI
5 questions for AMGN
David Risinger
Leerink Partners
4 questions for AMGN
Michael Yee
Jefferies
4 questions for AMGN
Mohit Bansal
Wells Fargo & Company
4 questions for AMGN
Alexandria Hammond
Wolfe Research
3 questions for AMGN
Gregory Renza
RBC Capital Markets
3 questions for AMGN
Alex Hammond
Sidoti & Company, LLC
2 questions for AMGN
Carter L. Gould
Barclays
2 questions for AMGN
Chris Schott
JPMorgan Chase & Company
2 questions for AMGN
Louise Chen
Cantor Fitzgerald
2 questions for AMGN
Christopher Raymond
Piper Sandler
1 question for AMGN
Conor MacKay
BMO Capital Markets
1 question for AMGN
Geoff Meacham
Citigroup Inc.
1 question for AMGN
James Shin
Analyst
1 question for AMGN
Luca Issi
RBC Capital Markets
1 question for AMGN
Michael DiFiore
Evercore ISI
1 question for AMGN
Michael Gee
UBS Financial Services Inc.
1 question for AMGN
Mike DiFiore
Evercore ISI
1 question for AMGN
Olivia Brayer
Cantor
1 question for AMGN
Sadia Rahman
Wells Fargo
1 question for AMGN
Timothy Anderson
BofA Securities
1 question for AMGN
Trung Huynh
UBS Group AG
1 question for AMGN
Recent press releases and 8-K filings for AMGN.
- Amgen delivered double-digit revenue and EPS growth in 2025, driven by 14 blockbuster products (>$1 B sales), 13 with double-digit growth, and 18 achieving record sales.
- Key growth drivers in 2025 included Repatha (+36% to >$3 B), Evenity (+34% to $2.1 B), Tezspire (>30%), a $5.2 B rare disease portfolio, and $3 B in biosimilars sales.
- For 2026, Amgen expects total revenues of $37.0–38.4 B and non-GAAP EPS of $21.60–23.00, noting a Q1 headwind from U.S. insurance cycles and biosimilar competition.
- R&D momentum includes six global phase III MariTide trials, the VESALIUS-CV trial showing a 25% relative risk reduction with Repatha, and full FDA approval of Imdelltra for small cell lung cancer.
- Strong full-year performance: Amgen delivered double-digit revenue and EPS growth in 2025, with 14 blockbuster products, 13 achieving double-digit sales growth, and 18 setting record results.
- Franchise drivers: Key portfolio highlights include Repatha (+36% to >$3 billion) , Evenity (+34% to $2.1 billion) , Tezspire (+52% to $1.5 billion) , rare disease (+14% to ~$5.2 billion) , innovative oncology (+11% to $8.7 billion) , and biosimilars ($3 billion).
- Financial metrics: Non-GAAP operating margin of 46%, 22% increase in R&D to $7.2 billion, $8.1 billion free cash flow, $2.2 billion capex, $6 billion of debt retired, and $2.38 quarterly dividend (+6%).
- 2026 outlook: Projected revenues of $37.0 billion–$38.4 billion and non-GAAP EPS of $21.60–$23.00, with up to $3 billion in share repurchases and $2.6 billion capex; anticipates Q1 headwinds from benefit-plan changes, biosimilar competition, and inventory adjustments.
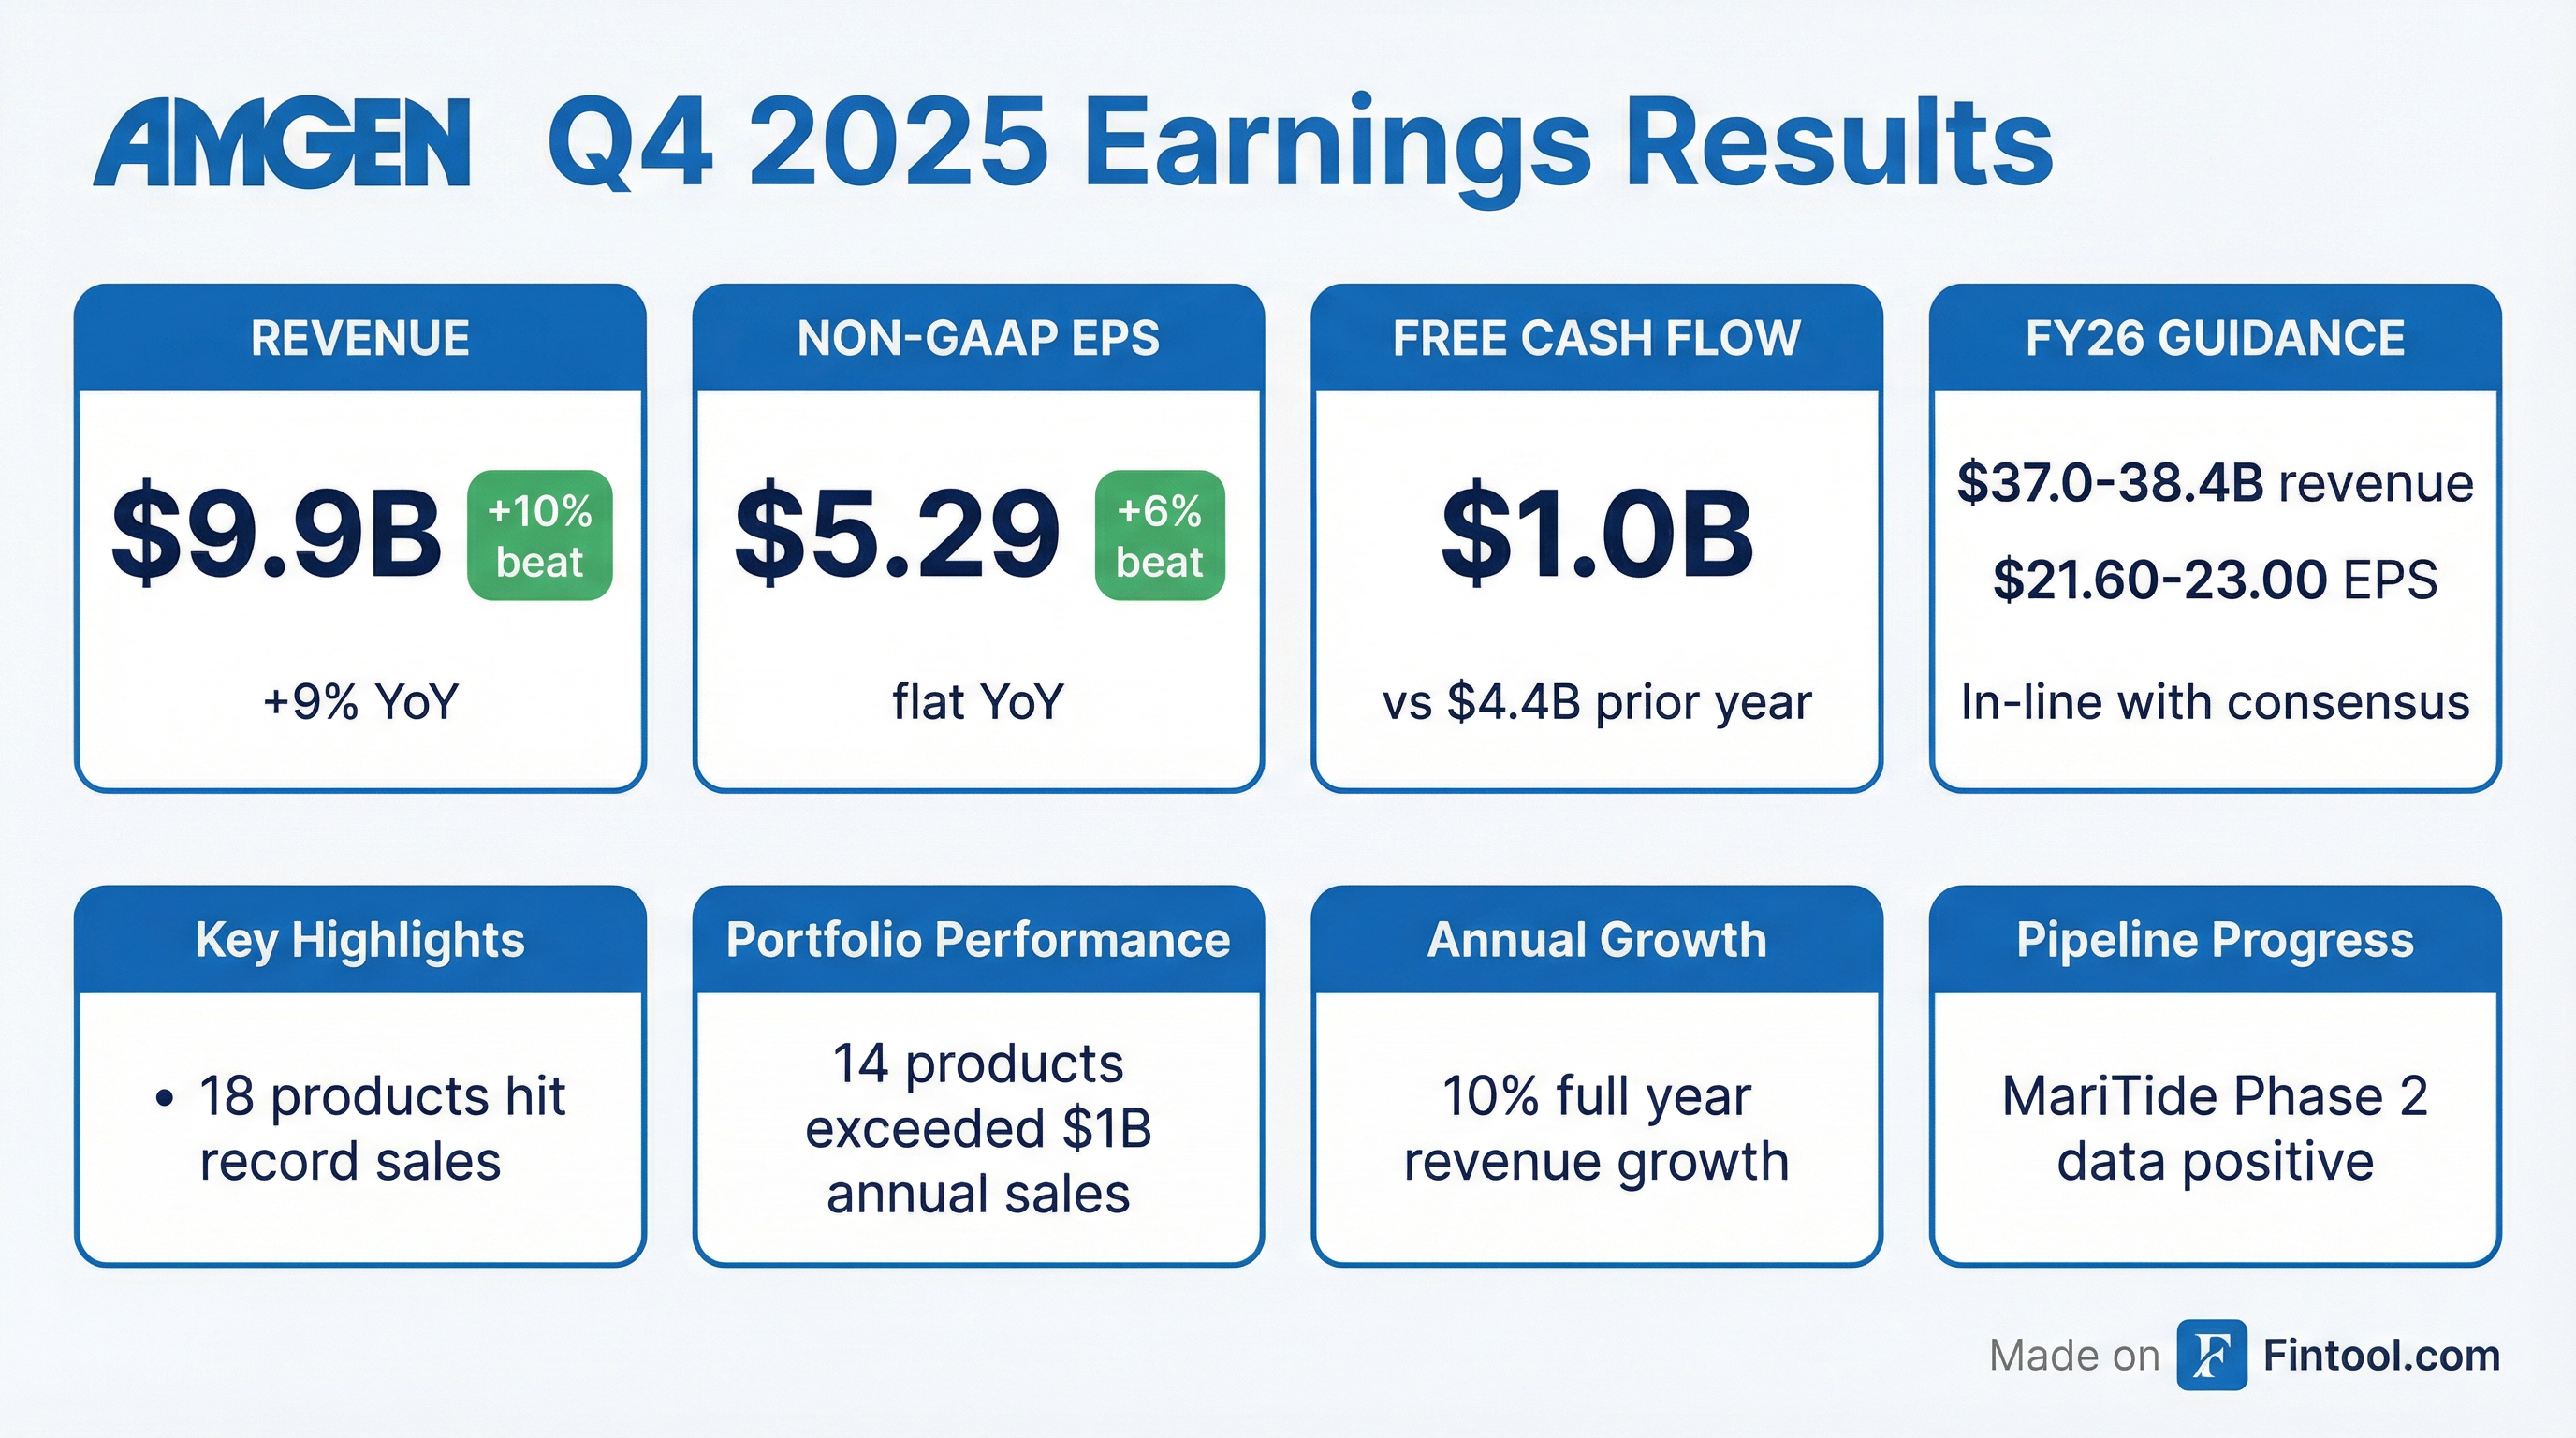
- Q4 ’25 revenue of $9.87 B, up 9% YoY; product sales of $9.37 B, up 7%; Non-GAAP EPS of $5.29 (flat YoY).
- FY 2025 revenue of $36.75 B (+10%) and Non-GAAP EPS of $21.84 (+10%).
- 2026 guidance: revenue of $37.0 B–$38.4 B; Non-GAAP EPS of $21.60–$23.00.
- Invested $7 B in R&D (+22% YoY) while maintaining a 46% Non-GAAP operating margin; advanced pipeline with five FDA approvals and key Phase 3 milestones.
- Amgen delivered 10% full-year sales growth in 2025 with double-digit revenue and EPS gains; 14 products reached blockbuster status, 13 posted double-digit sales growth, and 18 hit record sales.
- Key 2025 growth drivers included: Repatha up 36% to >$3 B, Evenity up 34% to $2.1 B, Tezspire up 52% to $1.5 B, rare disease portfolio up 14% to $5.2 B, innovative oncology up 11% to $8.7 B, and $3 B in biosimilars sales.
- Full-year non-GAAP R&D spending rose 22% to $7.2 B, funding late-stage programs such as MariTide and Olpasiran; generated $8.1 B in free cash flow and retired $6 B of debt.
- 2026 guidance forecasts revenues of $37.0 B–$38.4 B, non-GAAP EPS of $21.60–$23.00, and a non-GAAP operating margin near 45%–46%.
- Amgen delivered Q4 2025 total revenues of $9.9 billion (+9% YoY) and full year revenues of $36.8 billion (+10% YoY); GAAP EPS rose to $2.45 in Q4 (+111% YoY) and $14.23 for FY 2025 (+88% YoY).
- Fourth-quarter GAAP operating margin increased 2.5 percentage points to 29.0%, and full-year margin rose 3.1 points to 25.8%.
- Declared a Q4 dividend of $2.38 per share, a 6% increase versus Q4 2024.
- Issued 2026 guidance: total revenues of $37.0 billion–$38.4 billion, GAAP EPS of $15.45–$16.94, and non-GAAP EPS of $21.60–$23.00.
- Q4 revenues were $9.9 B (up 9% YoY) and full-year revenues were $36.8 B (up 10% YoY).
- GAAP EPS rose to $2.45 in Q4 (+111%) and $14.23 for the year (+88%); non-GAAP EPS was $5.29 in Q4 (flat) and $21.84 for the year (+10%).
- Full-year free cash flow was $8.1 B versus $10.4 B in 2024; Q4 free cash flow was $1.0 B versus $4.4 B in Q4 2024.
- The company declared a Q4 dividend of $2.38 per share (up 6%), and ended 2025 with $9.1 B in cash and $54.6 B of debt (3.2× leverage).
- 2026 guidance: revenues of $37.0–38.4 B, GAAP EPS of $15.45–16.94, and non-GAAP EPS of $21.60–23.00.
- Amgen terminated its development and commercialization agreement with Kyowa Kirin, regaining global control of the rocatinlimab program outside Japan.
- Rocatinlimab, an anti-OX40 monoclonal antibody for atopic dermatitis, achieved rIGA 0/1 response at Week 16 in Phase 3 ROCKET-IGNITE and ROCKET-HORIZON trials, with consistent safety and no new signals.
- The pediatric ROCKET-ASCEND trial is ongoing, with interim data confirming a favorable safety and tolerability profile in children.
- Amgen reaffirmed its strong commitment to addressing the high unmet medical need in atopic dermatitis.
- Kyowa Kirin will regain global control of the OX40 antagonist rocactinimab (formerly co-developed with Amgen), encompassing all development, regulatory filings, and commercialization rights.
- The move follows Amgen’s strategic reprioritization, aiming to ensure trial continuity, protect intellectual property, and accelerate regulatory submissions.
- Rocactinimab has completed Phase 3 ROCKET-IGNITE and ROCKET-HORIZON in ~1,500 moderate-to-severe atopic dermatitis patients—meeting all primary and key secondary endpoints—and has enrolled >3,300 patients across its Phase 3 program.
- Regulatory submissions are planned in H1 2026 in the US, followed by Japan, with further global market expansion based on clinical progress.
- Amgen terminated its 2021 collaboration with Kyowa Kirin on rocatinlimab on Jan. 30, 2026, effective upon receipt of regulatory approval.
- The move returns full development and commercialization rights to Kyowa Kirin.
- Amgen invested $400 million upfront and forfeited up to $850 million in potential regulatory and commercial milestones, citing competitive pressures from rivals like Dupixent.
- Kyowa Kirin plans to pursue U.S. regulatory filings and complete remaining trials after Phase 3 data demonstrated skin-clearance benefits and durable efficacy.
- Amgen has terminated its rocatinlimab collaboration, with Kyowa Kirin regaining global control over development, regulatory filings and commercialization.
- The decision stems from Amgen’s strategic portfolio prioritization; Amgen will continue manufacturing to support ongoing trials.
- Phase 3 ROCKET-IGNITE and ROCKET-HORIZON studies in nearly 1,500 adults met all co-primary and key secondary endpoints, with results published in The Lancet.
- Kyowa Kirin plans to file for U.S. regulatory approval in H1 2026, followed by submissions in Japan and other markets.
Fintool News
In-depth analysis and coverage of AMGEN.

Quarterly earnings call transcripts for AMGEN.
Ask Fintool AI Agent
Get instant answers from SEC filings, earnings calls & more