Earnings summaries and quarterly performance for BILL Holdings.
Executive leadership at BILL Holdings.
René Lacerte
Chief Executive Officer
John Rettig
President and Chief Operating Officer
Ken Moss
Chief Technology Officer
Mary Kay Bowman
Executive Vice President, General Manager of Payments and Financial Services
Mike Cieri
Executive Vice President, General Manager of Software Solutions
Rohini Jain
Chief Financial Officer
Board of directors at BILL Holdings.
Aida Alvarez
Director
Alison Wagonfeld
Director
Allie Kline
Lead Independent Director
Allison Mnookin
Director
Beth Johnson
Director
Brian Jacobs
Director
Dan Wernikoff
Director
David Hornik
Director
Keri Gohman
Director
Lee Kirkpatrick
Director
Natalie Derse
Director
Peter Feld
Director
Steven Cakebread
Director
Tina Chan Reich
Director
Research analysts who have asked questions during BILL Holdings earnings calls.
Tien-tsin Huang
JPMorgan Chase & Co.
7 questions for BILL
Andrew Schmidt
Citigroup Inc.
6 questions for BILL
Darrin Peller
Wolfe Research, LLC
6 questions for BILL
Christopher Quintero
Morgan Stanley
5 questions for BILL
Ken Suchoski
Autonomous Research
5 questions for BILL
Scott Berg
Needham & Company, LLC
5 questions for BILL
Bryan Keane
Deutsche Bank
3 questions for BILL
Alexander Markgraff
KeyBanc Capital Markets
2 questions for BILL
Bradley Sills
Bank of America
2 questions for BILL
Nate Svensson
Deutsche Bank
2 questions for BILL
Samad Samana
Jefferies
2 questions for BILL
Andrew Harte
BTIG, LLC
1 question for BILL
Hoi-Fung Wong
Oppenheimer & Co. Inc.
1 question for BILL
Ian Black
Needham & Company
1 question for BILL
James Friedman
Susquehanna Financial Group, LLLP
1 question for BILL
Keith Weiss
Morgan Stanley
1 question for BILL
Taylor McGinnis
UBS
1 question for BILL
Trevor Dodds
Jefferies Financial Group Inc.
1 question for BILL
William Nance
The Goldman Sachs Group, Inc.
1 question for BILL
Recent press releases and 8-K filings for BILL.
- BILL is leveraging AI to automate manual accounting tasks, with new agents like the BILL W-9 Agent, which has been used by 10,000 businesses to process over 40,000 W-9s, and the BILL Invoice Coding Agent, which saves customers 90% of data entry time. This strategy aims to shift accountants to more strategic work, building on BILL's existing capability to save 50% of accountants' time.
- The company reported core revenue growth accelerated from 14% in fiscal Q1 to 17% in Q2, driven by emerging payment products and strong spend and expense volume growth, leading to raised guidance.
- BILL's strategic initiatives include Embed 2.0 partnerships with companies like NetSuite, Acumatica, and Paychex, with financial impact expected in 2027. Additionally, its Supplier Payments Plus product has contracted $400 million in TPV in its first six months, with monetization between 50 and 125 bps.
- Demonstrating financial discipline, BILL operates under the Rule of 40, having grown revenue 16x since its IPO, increased profitability margins by 300 basis points annually, and maintained flat headcount for four years. The company also actively engages in stock buybacks to return capital to shareholders.
- BILL Holdings reported core revenue growth accelerated from 14% in fiscal Q1 to 17% in fiscal Q2, driven by emerging payment products and strength in spend and expense.
- The company is leveraging AI to eliminate manual work and save customers significant time through new tools like the BILL W-9 Agent, BILL Assistant, and BILL Invoice Coding Agent.
- New initiatives include Supplier Payments Plus (SPP), which has contracted $400 million in Total Payment Volume (TPV) in its first six months, with monetization expected between 50 and 125 basis points.
- Strategic Embed 2.0 partnerships with NetSuite, Acumatica, and Paychex are live, and their financial impact is anticipated to be a meaningful contributor in 2027.
- Management is focused on balancing growth and profitability, adhering to the Rule of 40, and has achieved 16x revenue growth since its IPO while increasing profitability margins by 300 basis points annually and keeping headcount flat for four years.
- BILL Holdings is actively integrating AI to enhance its platform, with new agents like the BILL W-9 Agent processing over 40,000 W-9s for 10,000 businesses and the BILL Invoice Coding Agent saving customers 90% of data entry time.
- The company reported an acceleration in core revenue growth from 14% in fiscal Q1 to 17% in Q2, attributing this to emerging payment products and strength in spend and expense, leading to raised guidance.
- BILL is expanding its platform with new solutions such as Procurement, which has seen 10,000 customers opt-in, and multi-entity reporting, offering 30-40% time savings.
- Strategic Embed 2.0 partnerships with companies like NetSuite, Acumatica, and Paychex are expected to become a meaningful financial contributor starting in 2027.
- The company prioritizes the Rule of 40 to balance growth and profitability, having 16x revenue since its IPO, consistently adding 300 basis points to profitability margins annually, and actively engaging in stock buybacks.
- BILL Holdings reported strong top-line growth with core revenue up approximately 17% year-over-year to about $375 million, contributing to a total revenue of about $414.7 million for the quarter.
- The company demonstrated margin expansion, achieving non-GAAP operating margins near 17–18% and reporting non-GAAP net income of $111.5 million for the quarter.
- Management raised its fiscal 2026 guidance, now projecting roughly a 17% non-GAAP operating margin with over 320 basis points of annual improvement.
- Operational metrics showed significant improvement, with transactions increasing approximately 16% to about 34.7 million and total payment volume (TPV) growing approximately 13% to $95.1 billion.
- Spend & Expense revenue saw a 24% increase to $166 million, while AP/AR core revenue grew 11% to $185.9 million.
- BILL Holdings reported strong Q2 2026 financial results, with core revenue growing 17% year-over-year to $375 million and a non-GAAP operating margin of 18%.
- The company raised its fiscal year 2026 guidance, now projecting core revenue between $1.490 billion and $1.510 billion (15%-16% growth) and non-GAAP EPS between $2.33 and $2.41.
- Growth was driven by increased multi-product adoption, with businesses using both AP/AR and spend and expense growing 28% year-over-year, and AP card payments volume increasing over 160% year-over-year in Q2.
- Strategic initiatives include leveraging AI with new agentic capabilities, such as the W-9 agent which collected 40,000 W-9s since its Q2 launch, and the BILL Assistant agent which increased the self-serve rate from 13% to over 40%. The company also repurchased $133 million of stock during the quarter.
- BILL Holdings delivered strong Q2 2026 results, with core revenue reaching $375 million, marking a 17% year-over-year growth and surpassing guidance, while achieving an 18% non-GAAP operating margin.
- The company experienced accelerated growth across its integrated platform, including AP card payments volume increasing over 160% year-over-year and spend and expense revenue growing 24% year-over-year to $166 million.
- Strategic initiatives are showing significant progress, with the Embed 2.0 strategy launching new partnerships that unlock potential to reach nearly 1 million businesses, and AI-driven solutions like invoice financing seeing customer growth of nearly 50% year-over-year.
- For Q3 2026, BILL Holdings projects total revenue between $397.5 million and $407.5 million and core revenue between $364.5 million and $374.5 million, reflecting 14%-17% year-over-year growth.
- For Q2 2026, BILL reported total revenue of $414.7 million, comprising $375.1 million in core revenue and $39.5 million in float revenue.
- The company achieved 17% year-over-year core revenue growth.
- Operational highlights for the three months ended December 31, 2025, include $95.1 billion in total payment volume and 34.7 million transactions processed.
- Profitability metrics for Q2 2026 show a Non-GAAP gross margin of 83.9% and Non-GAAP Net Income of $73.4 million.
- The number of businesses using BILL's solutions reached 498,500 as of Q2 2026.
- BILL Holdings reported strong Q2 2026 core revenue of $375 million, a 17% year-over-year increase, and achieved an 18% non-GAAP operating margin.
- Growth was driven by accelerated performance across its integrated platform, with AP/AR core revenue up 11% and Spend & Expense revenue up 24% year-over-year, supported by a 25% increase in card payment volume.
- The company raised its fiscal 2026 core revenue guidance to $1.490 billion-$1.510 billion (15%-16% growth) and non-GAAP EPS to $2.33-$2.41, reflecting a 170 basis point increase in core revenue guidance and over 320 basis points of non-GAAP operating margin expansion (excluding float benefit).
- Strategic focus includes leveraging AI to enhance customer value and operational efficiency, with new agents reducing invoice coding steps by 90% and increasing customer self-serve rates to 40%.
- During Q2, BILL repurchased $133 million of stock and is strategically focusing on larger customers and aligning pricing, which may lead to a slight decrease in net new customer additions in the short term.
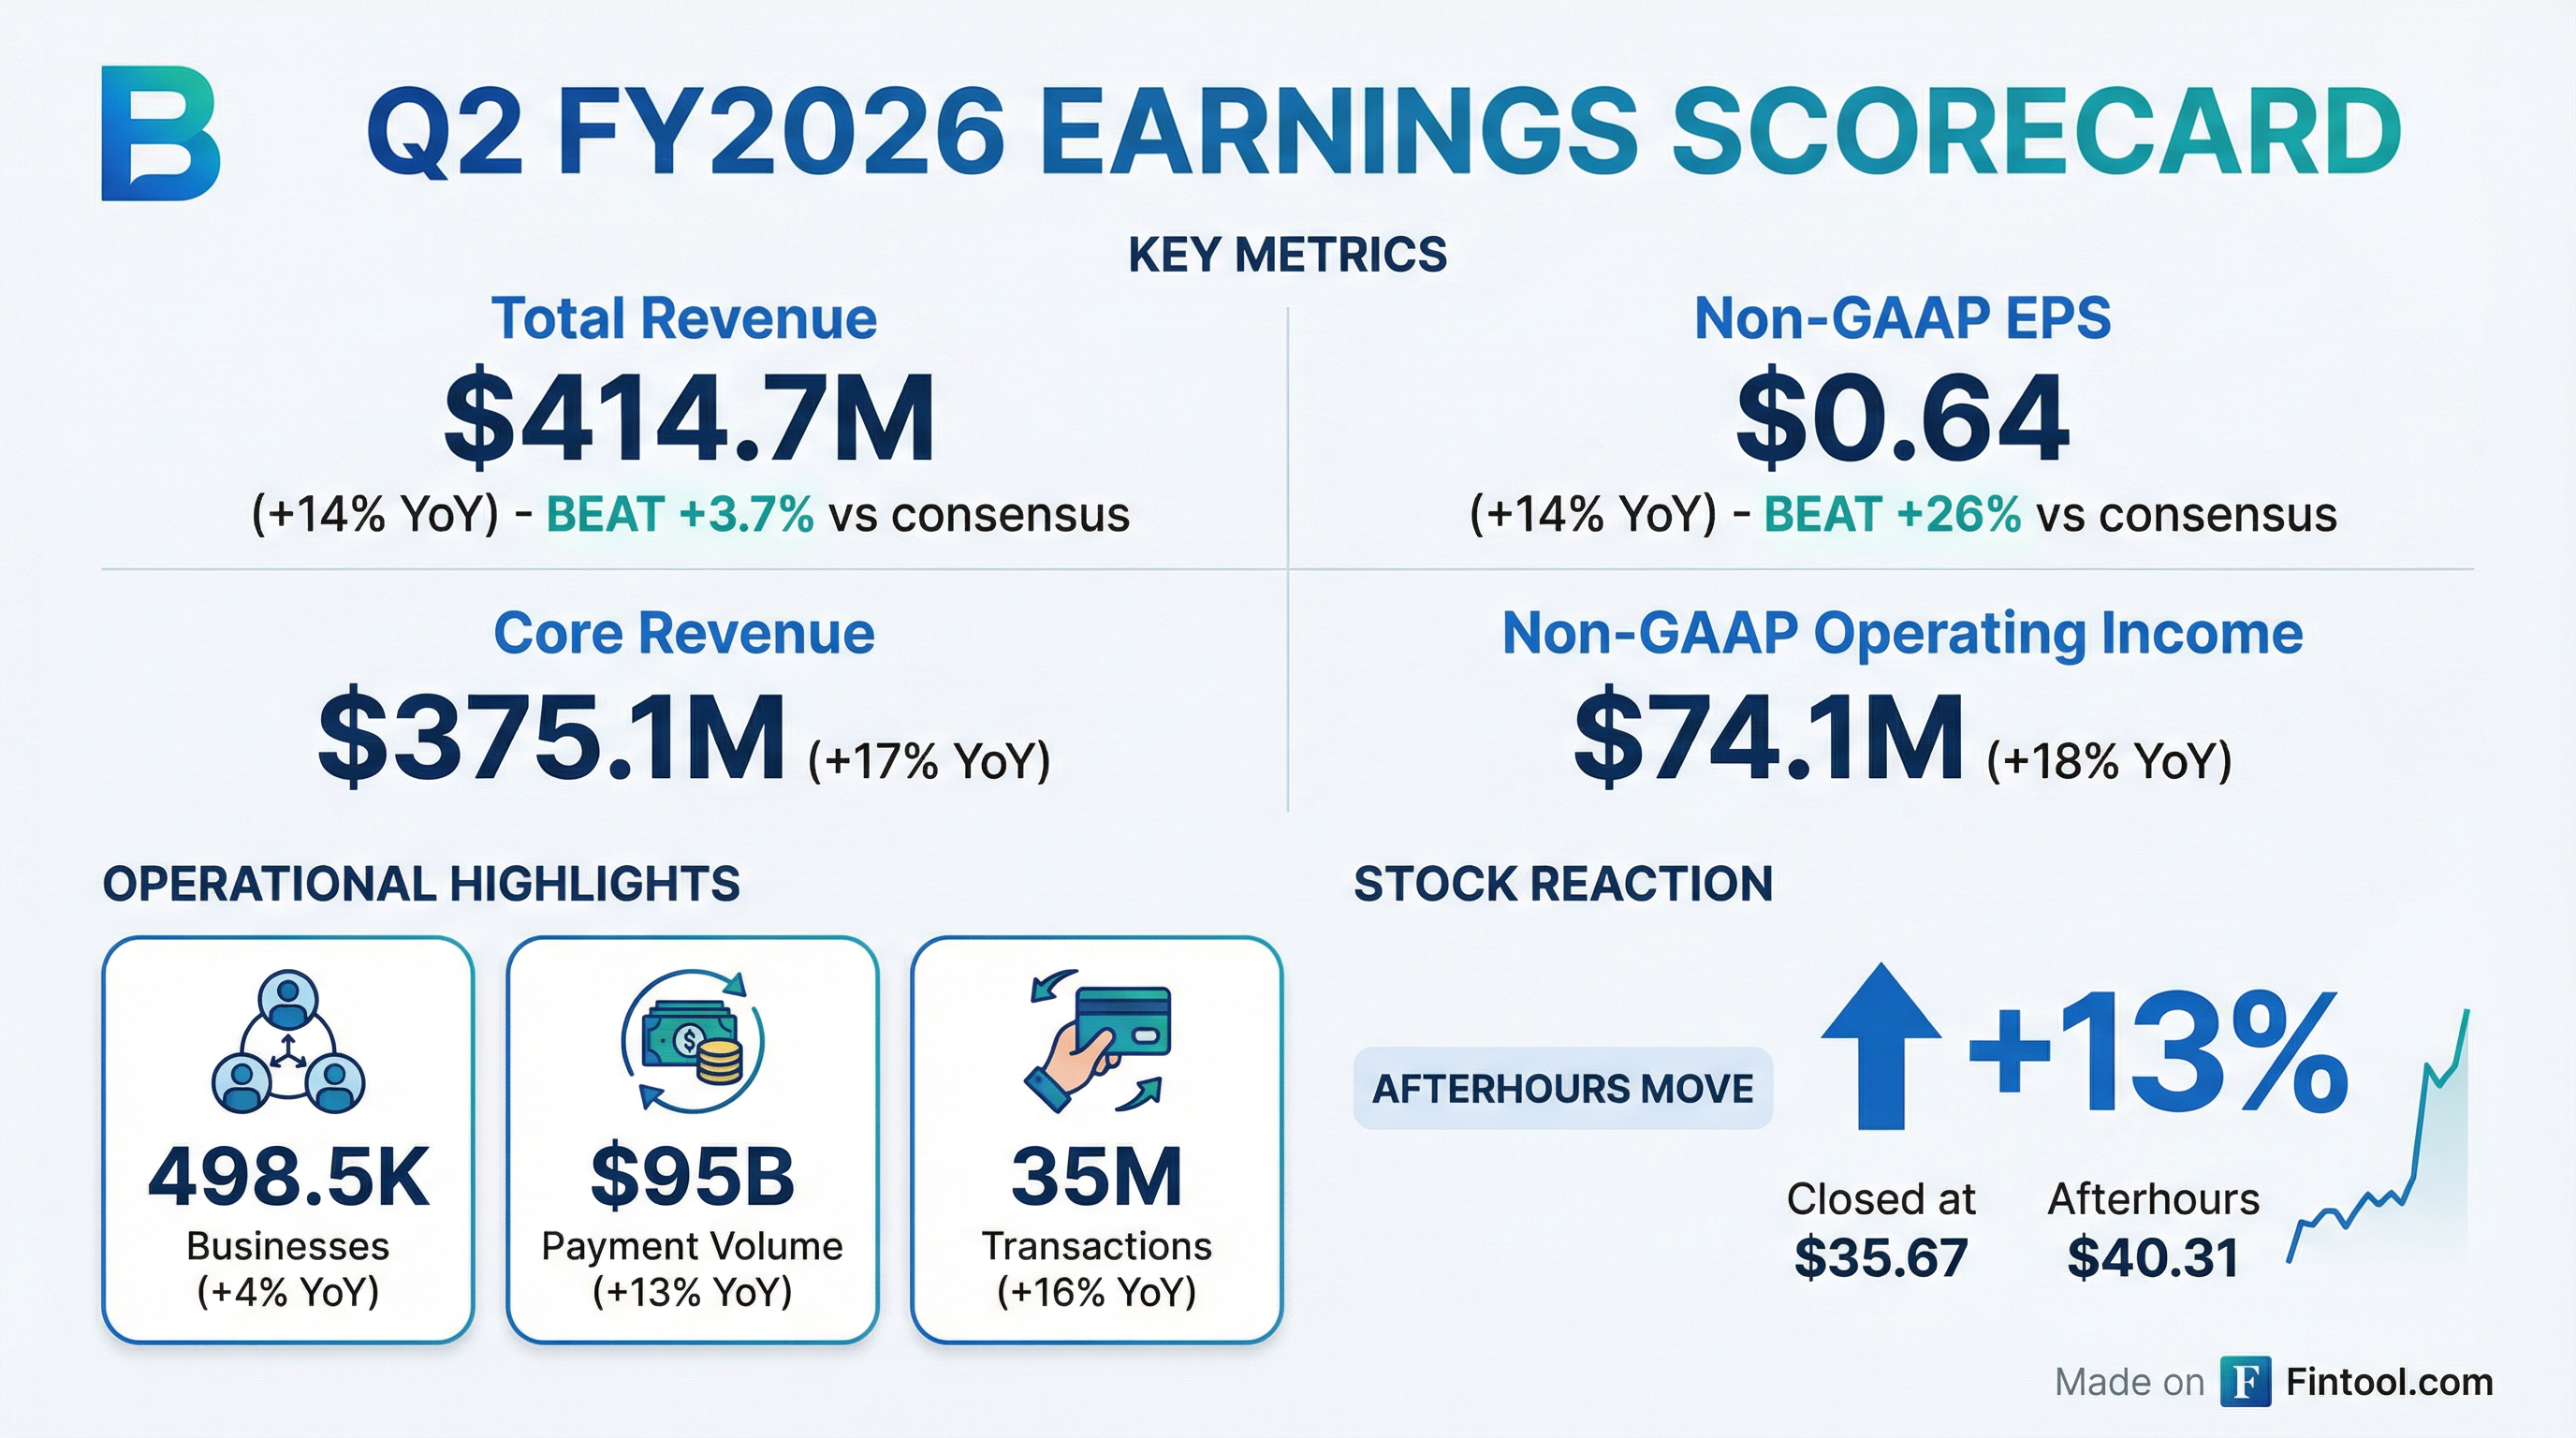
- BILL reported total revenue of $414.7 million for the second fiscal quarter ended December 31, 2025, an increase of 14% year-over-year, with core revenue growing 17% year-over-year to $375.1 million.
- For Q2 FY26, the company reported a GAAP net loss of $2.6 million, or $(0.03) per basic and diluted share, while non-GAAP net income was $73.4 million, or $0.64 per diluted share.
- BILL processed $95 billion in total payment volume and 35 million transactions during the second quarter, representing increases of 13% and 16% year-over-year, respectively.
- The company repurchased approximately 2.5 million shares of common stock for a total cost of approximately $133 million in Q2 FY26.
- For the fiscal third quarter ending March 31, 2026, BILL expects total revenue between $397.5 million and $407.5 million and non-GAAP net income per diluted share between $0.53 and $0.57.
- BILL reported strong second quarter fiscal year 2026 results for the period ended December 31, 2025, with total revenue increasing 14% year-over-year to $414.7 million and core revenue growing 17% year-over-year to $375.1 million.
- The company's non-GAAP operating income rose 18% year-over-year to $74.1 million, and non-GAAP net income reached $73.4 million, or $0.64 per diluted share in Q2 FY26.
- For the third fiscal quarter ending March 31, 2026, BILL expects total revenue between $397.5 million and $407.5 million and non-GAAP net income per diluted share between $0.53 and $0.57.
- During the second quarter, BILL repurchased approximately 2.5 million shares of common stock for a total cost of approximately $133 million.
Quarterly earnings call transcripts for BILL Holdings.
Ask Fintool AI Agent
Get instant answers from SEC filings, earnings calls & more